🚀 Kenya Oil Marketing Performance
Johnson Wairimu
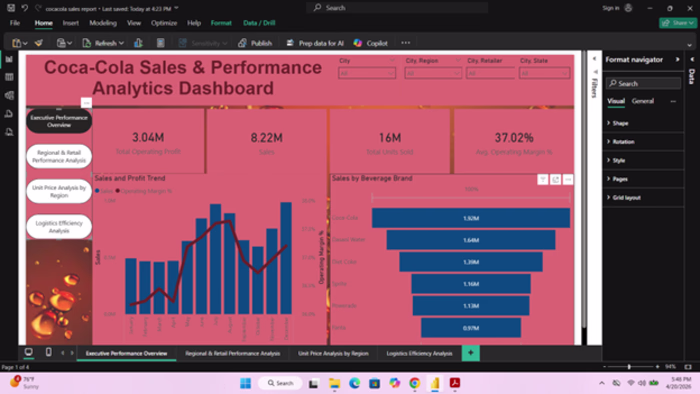
🚀 Kenya Oil Marketing Performance Dashboard | Powered by Intersect Analytics
What if you could monitor the entire oil and fuel market in Kenya—from market leaders to pricing trends—in one powerful, interactive dashboard?
Our latest Kenya Oil Marketing Companies Performance Dashboard delivers exactly that.
📊 What This Dashboard Reveals
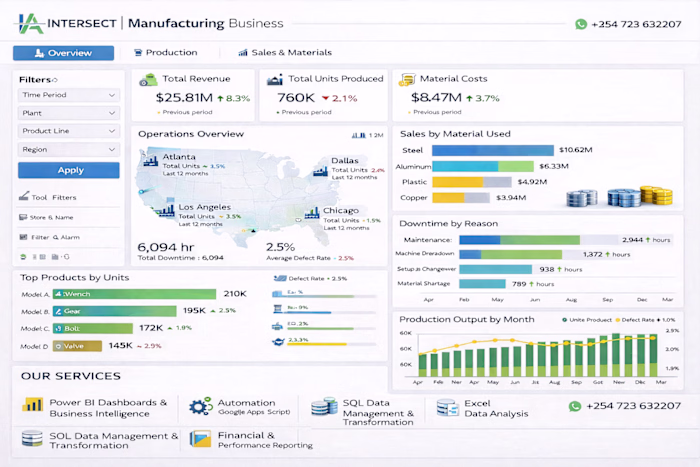
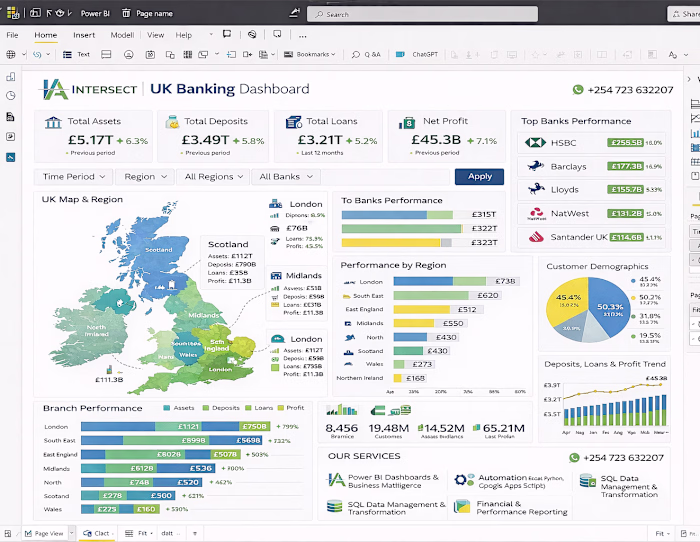
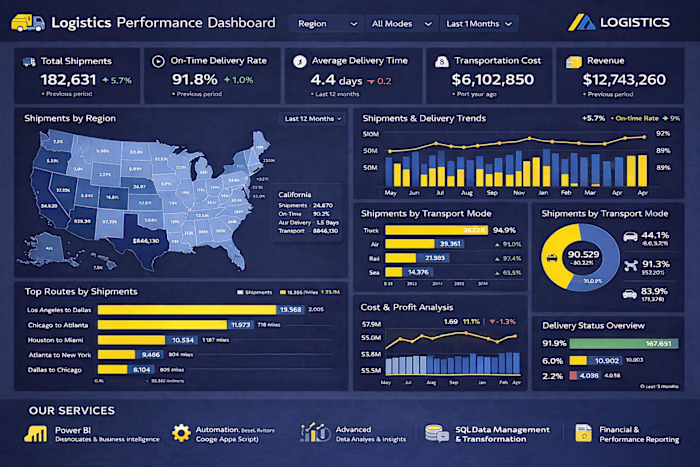
This professional Power BI dashboard provides a 360° view of the oil industry in Kenya, combining market share, pricing, operations, and regional performance into one seamless experience.
🔍 Key Highlights:
• Vivo Energy (Shell) leads the market with over 37% market share
• Top 3 companies dominate the industry, controlling a significant portion of total sales
• Fuel prices remain relatively stable, with slight fluctuations across months
• Nairobi and Mombasa drive the highest fuel consumption
• Larger companies benefit from wider station networks and operational efficiency
📈 From sales volumes to service station coverage, this dashboard transforms complex industry data into clear, actionable insights.
💡 Why This Matters for Your Business
✔ Identify market leaders and competitive positioning
✔ Understand regional demand and expansion opportunities
✔ Monitor pricing trends and cost drivers
✔ Make faster, data-driven decisions
🛠️ Our Services at Intersect Analytics
We don’t just build dashboards—we build complete data solutions:
• Power BI Dashboard Development
• Data Analysis & Visualization
• Data Cleaning, Transformation & Modeling
• Automation Solutions (Excel, Python, Google Apps Script)
• SQL Database Design & Optimization
• Custom Script Writing for Business Processes
• Financial & Operational Reporting
🎯 Why Choose Intersect Analytics?
✔ We start with clean, reliable data—no misleading insights
✔ We deliver end-to-end analytics solutions (data → insights → action)
✔ We combine technical expertise with business understanding
✔ We automate your workflows to save time and reduce errors
✔ We design dashboards that are clear, professional, and decision-focused
🚀 Turn Data Into a Competitive Advantage
This dashboard is just one example of how we help businesses unlock the power of their data.
📩 Let’s help you make smarter business decisions
📞 +254 723 632207 (WhatsApp Available)
💡 Intersect Analytics — Turning data into decisions, and insights into growth.
Like this project
Posted Apr 21, 2026
🚀 Kenya Oil Marketing Performance Dashboard | Powered by Intersect Analytics What if you could monitor the entire oil and fuel market in Kenya—from market l...