Power BI Property Management Report
Omaree Johnson
Power BI Property Report
Overview
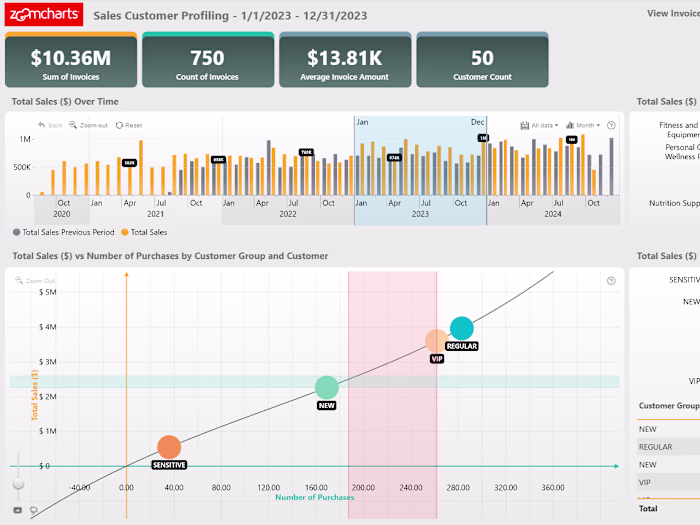
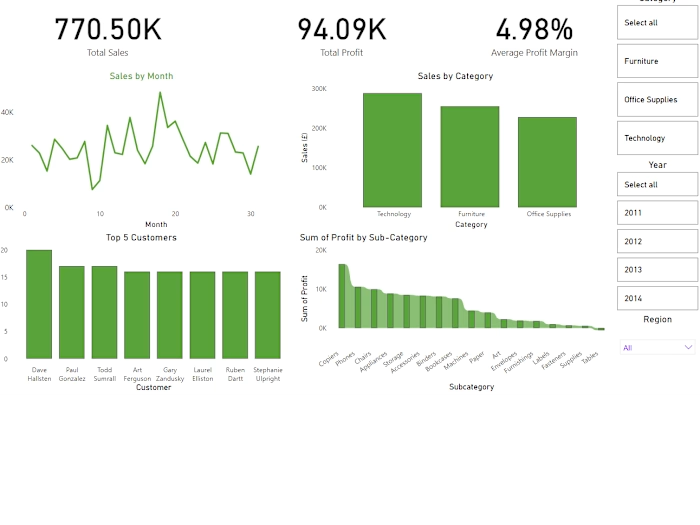
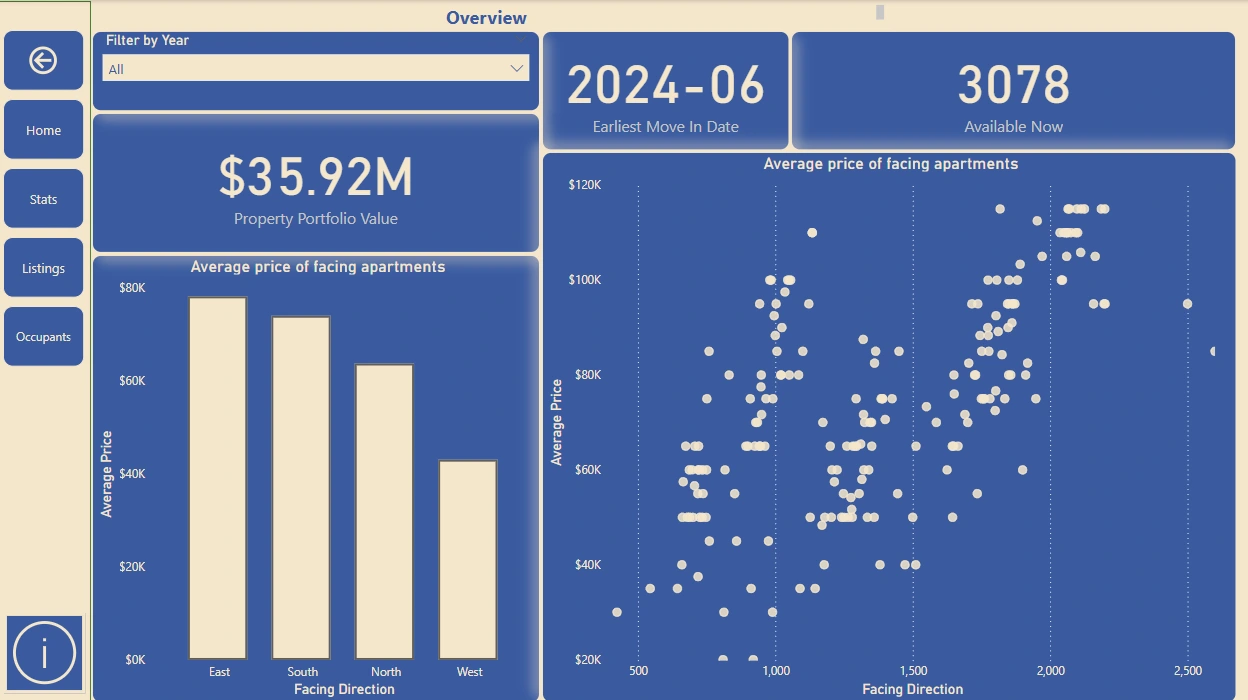
This Power BI report provides insights into property management, including financial performance, occupancy trends, and tenant details. The interactive dashboards help visualize key metrics and support data-driven decision-making.
Features
Overview Dashboard: Summary of key property metrics.
Financial Insights: Revenue, expenses, and profitability analysis.
Occupancy & Vacancy: Trends in tenant occupancy.
Maintenance Tracking: Property costs.
Market Analysis: Comparison of rental prices and trends.
Data Processing
Data Cleaning: The dataset was preprocessed using the Polars library, enabling fast and efficient handling of large data sets.
Transformation & Aggregation: Applied advanced filtering and grouping techniques for optimized reporting.
Data Pipeline: Data was processed into a pipeline format allowing for similar data to be cleaned quicker.
Like this project
Posted Jul 28, 2025
Developed a Power BI report for a property firm, showing trends in occupancy, revenue, and costs to support data-driven decisions.