RevOps Pulse — Revenue Intelligence Dashboard

Adrian Vale


Overview
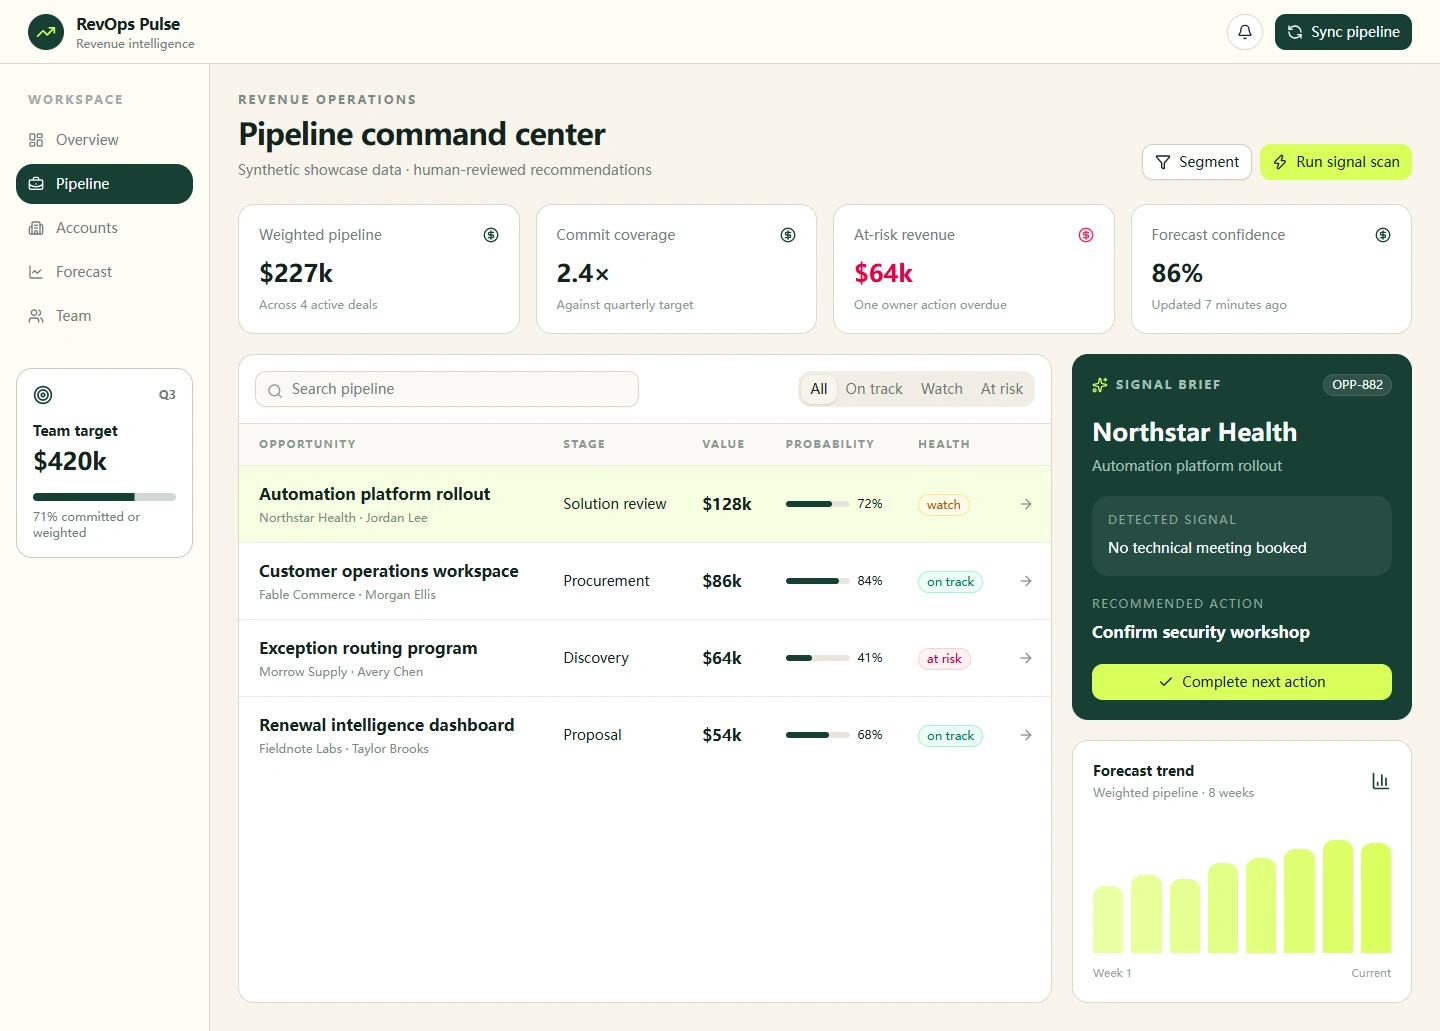
RevOps Pulse is an Independent Showcase Project built with synthetic data to demonstrate a realistic client-ready workflow. A full-stack revenue operations dashboard for pipeline health, forecast context, risk segmentation, and action-oriented opportunity follow-up.
Problem
Revenue teams often have plenty of CRM data but limited clarity about which opportunities need attention, why a deal is at risk, and what action should happen next.
My Role
Product Designer & Full-Stack Developer — product strategy, information architecture, dashboard UI, API workflow, agent tools, QA, and portfolio presentation.
Solution
I built a command center that combines pipeline metrics, opportunity health, detected signals, recommendations, filtering, and completion tracking in one operational view.
Technical Approach
The application uses Next.js, React, TypeScript, Tailwind CSS, shadcn/ui, REST-style API route, WebMCP, Playwright. The interface is backed by a local API route for validated state changes, while browser-exposed structured tools demonstrate how an agent can inspect or update the workflow within explicit safety boundaries.
Key Features
Pipeline KPIs and weighted forecast context
Searchable opportunity table with health segments
Per-opportunity signal brief and recommended action
Action completion with forecast-state update
Responsive layouts, empty state, and API validation
WebMCP tools for pipeline inspection and controlled action completion
Challenges
The central challenge was turning many revenue indicators into a small number of credible actions. The interface uses progressive detail: portfolio-level metrics first, opportunity context second, and one clear reviewed action last.
Outcome
The completed showcase passes production build, lint, and browser acceptance checks for selection, segmentation, action completion, forecast updates, empty state, responsive layout, and console errors. It demonstrates the ability to turn operational data into a usable decision workflow.
Technology
Next.js, React, TypeScript, Tailwind CSS, shadcn/ui, REST-style API route, WebMCP, Playwright.
Feature Screens
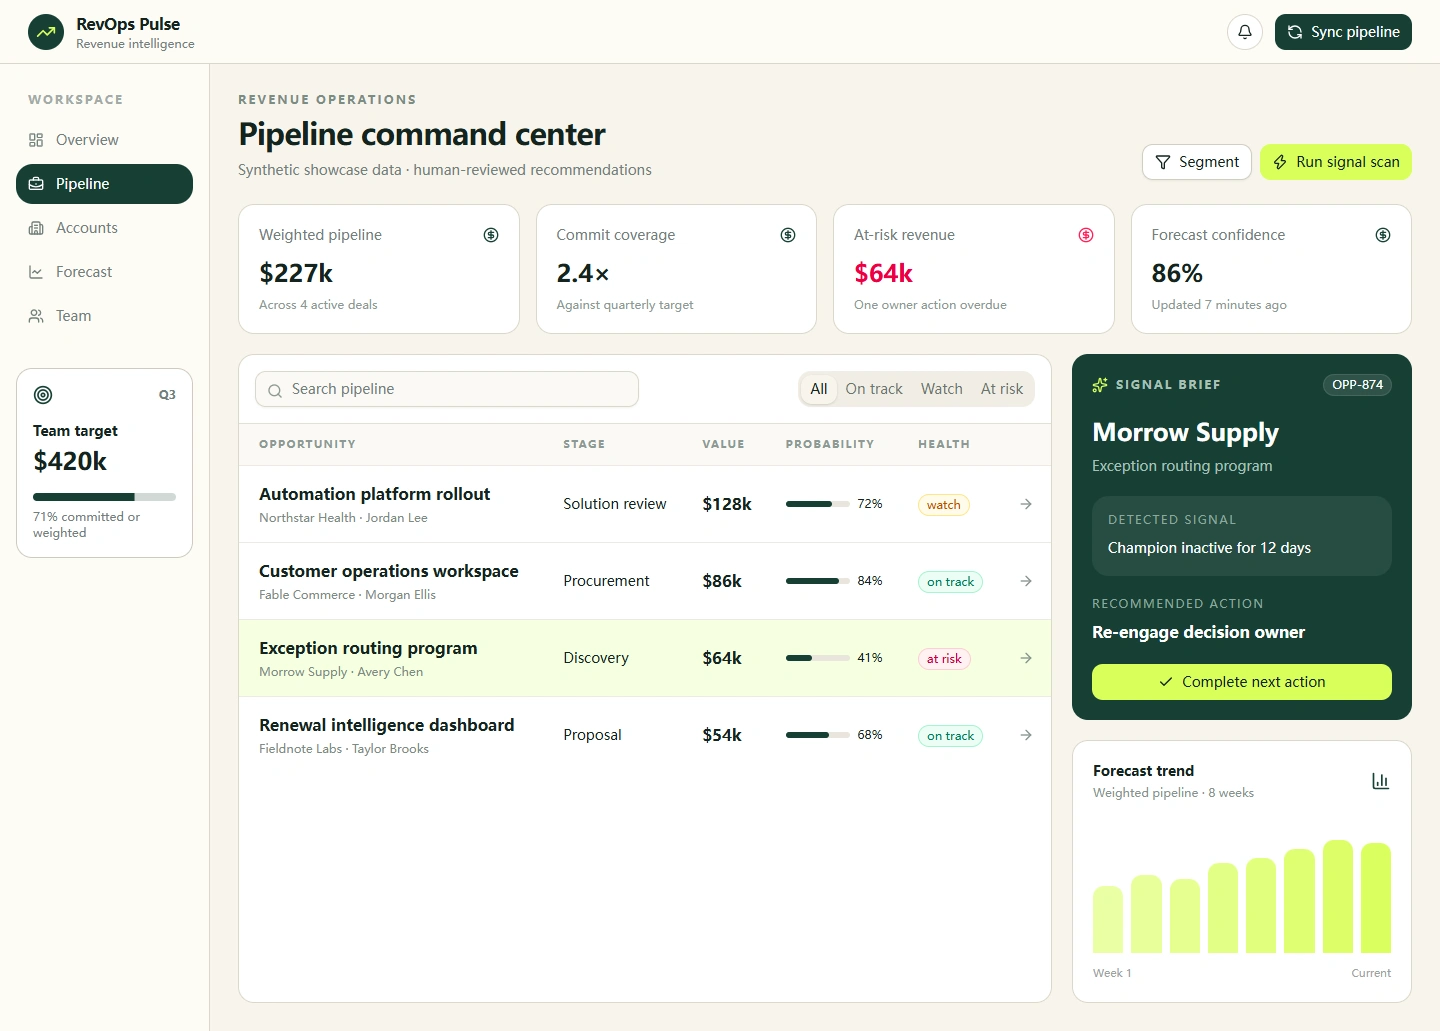
Revenue pipeline overview
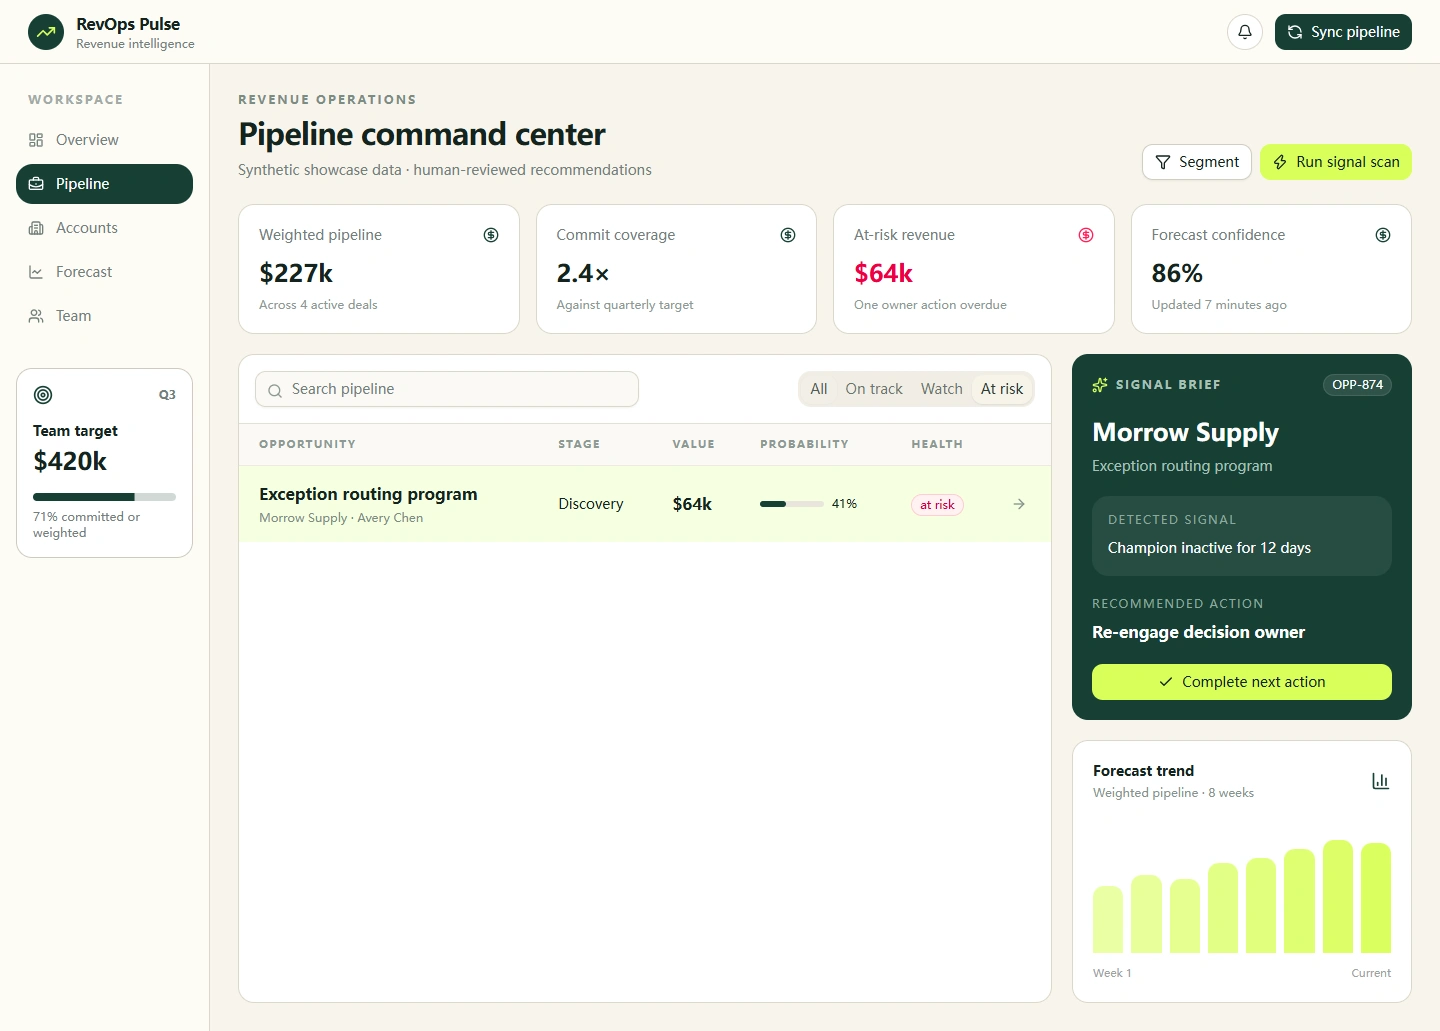
Opportunity risk signals
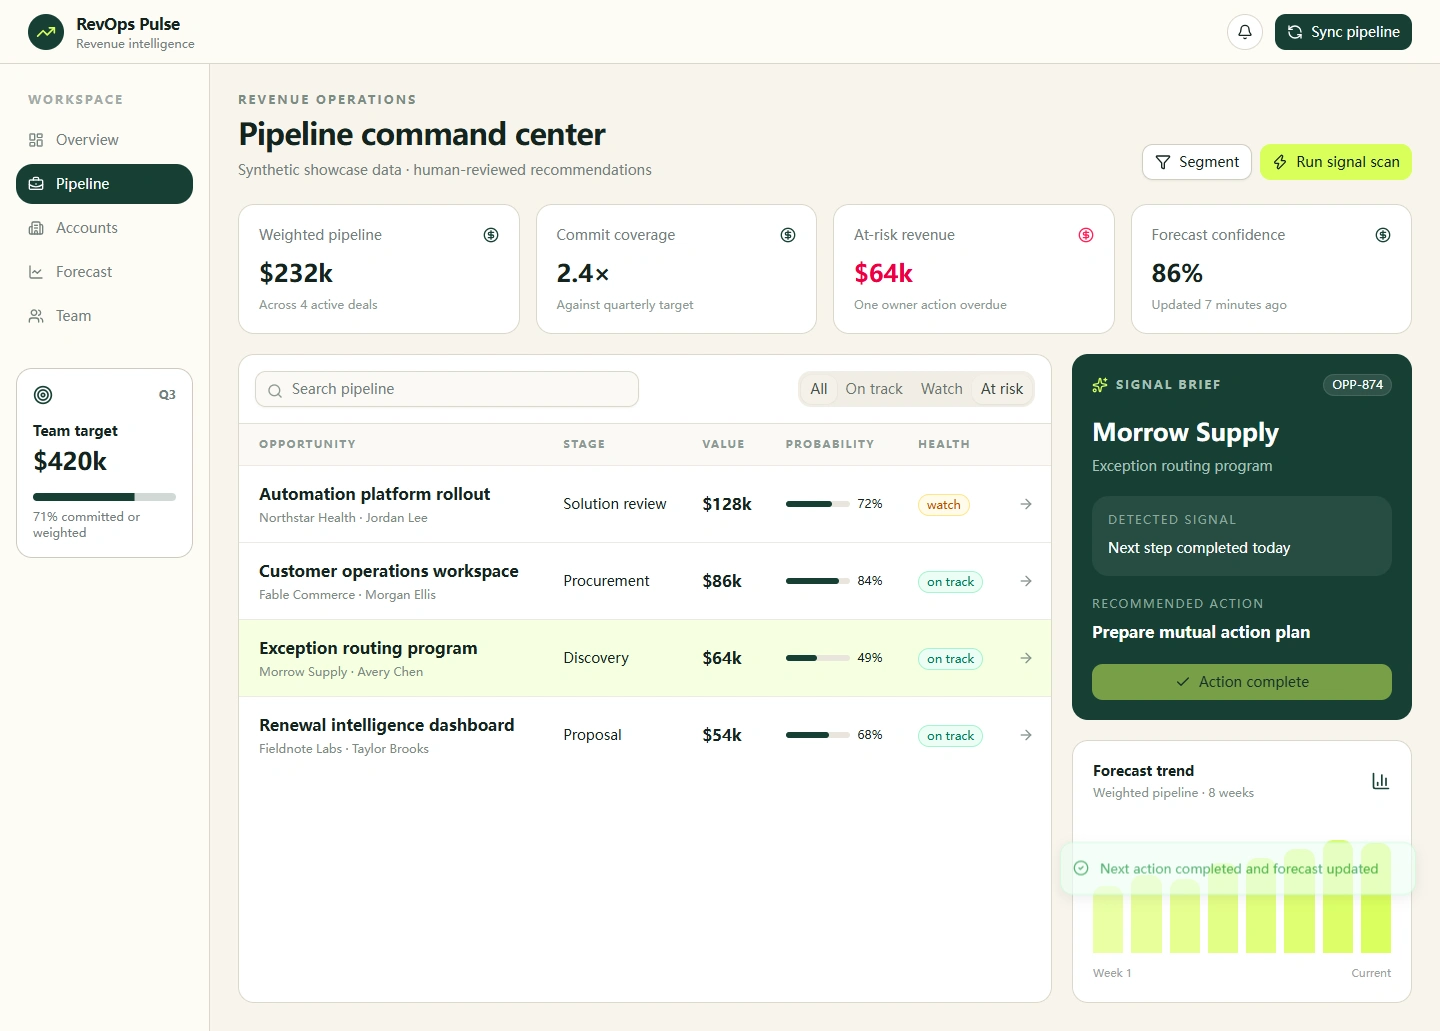
Reviewed next action
Source Code
Like this project
Posted Sep 16, 2026
Independent Showcase Project using synthetic data: a full-stack revenue operations dashboard for pipeline health, forecast context, risk segmentation, and action-oriented follow-up.