State of the Ocean —

State of the Ocean — Environmental Data Visualization & Infographic
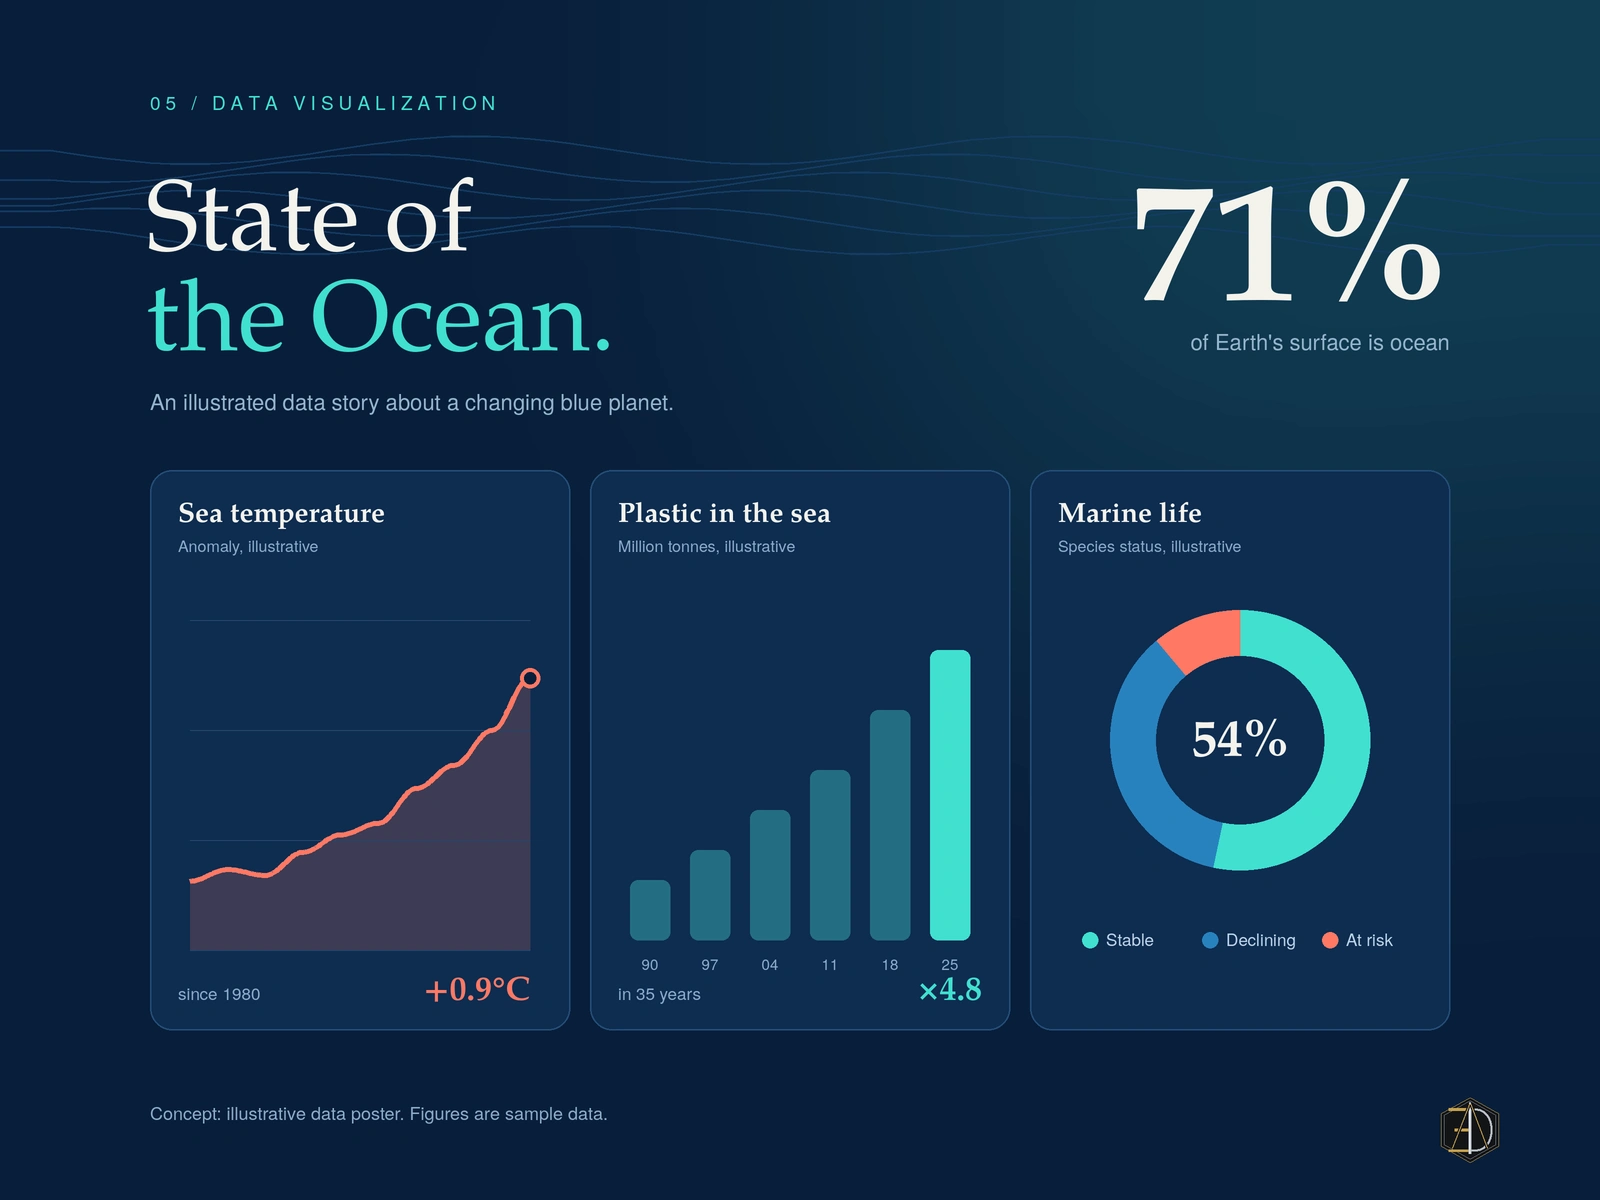
High-impact data storytelling dashboard illustrating global ocean metrics. Designed with dark oceanic themes, dynamic charts for sea temperature anomalies (+0.9°C), plastic accumulation trends (x4.8), and marine species health breakdown.
#datavisualization #dashboarddesign #uidesign #infographic #environmental #figma
0 likes · 0 views · Oct 15, 2026
State of the Ocean — Environmental Data Visualization & Infographic High-impact data storytelling dashboard illustrating global ocean metrics. Designed with ...