
Project Title: Sales Data Analysis & Interactive Dashboard
Tools Used: Excel, Power BI, Data Visualization, Data Analysis
Project Overview:
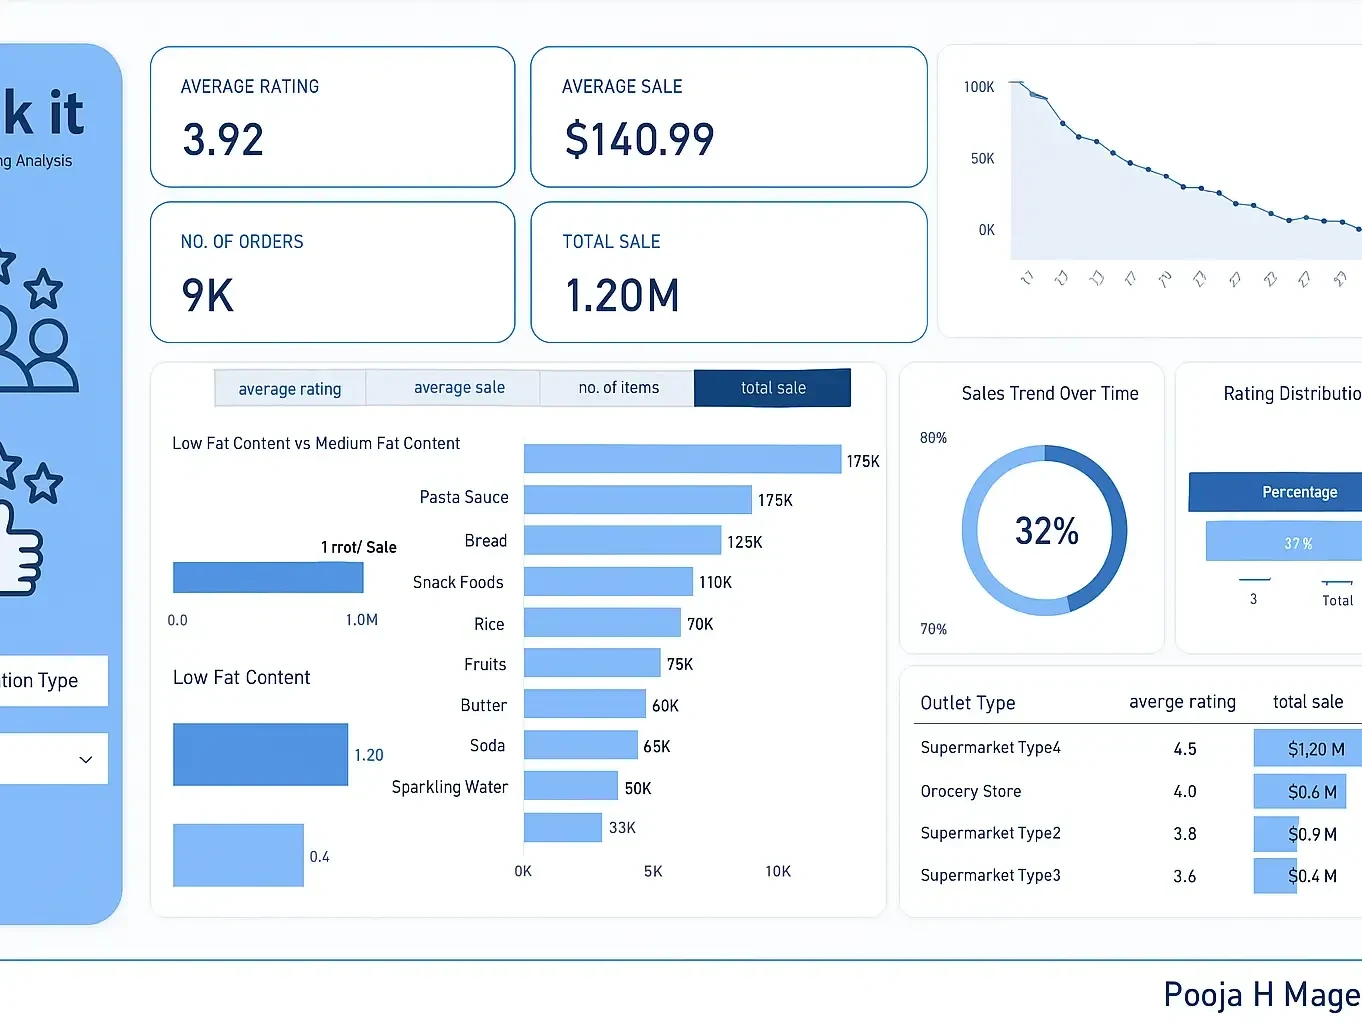
Analyzed a dataset of over 10,000 sales records to identify key trends, seasonal patterns, and high-performing products. Developed a dynamic, interactive Power BI dashboard visualizing revenue, product categories, monthly trends, and customer behavior insights.
Impact:
Enabled the client to make data-driven decisions regarding inventory management and marketing strategies, improving operational efficiency and sales performance.
0 likes · 2 views · Dec 3, 2025
Project Title: Sales Data Analysis & Interactive Dashboard Tools Used: Excel, Power BI, Data Visualization, Data Analysis Project Overview: Analyzed a datase...


