
Pooja Magewad
Power Bi | Data Analyst |IBM Certified
Ready for work
Pooja is ready for their next project!
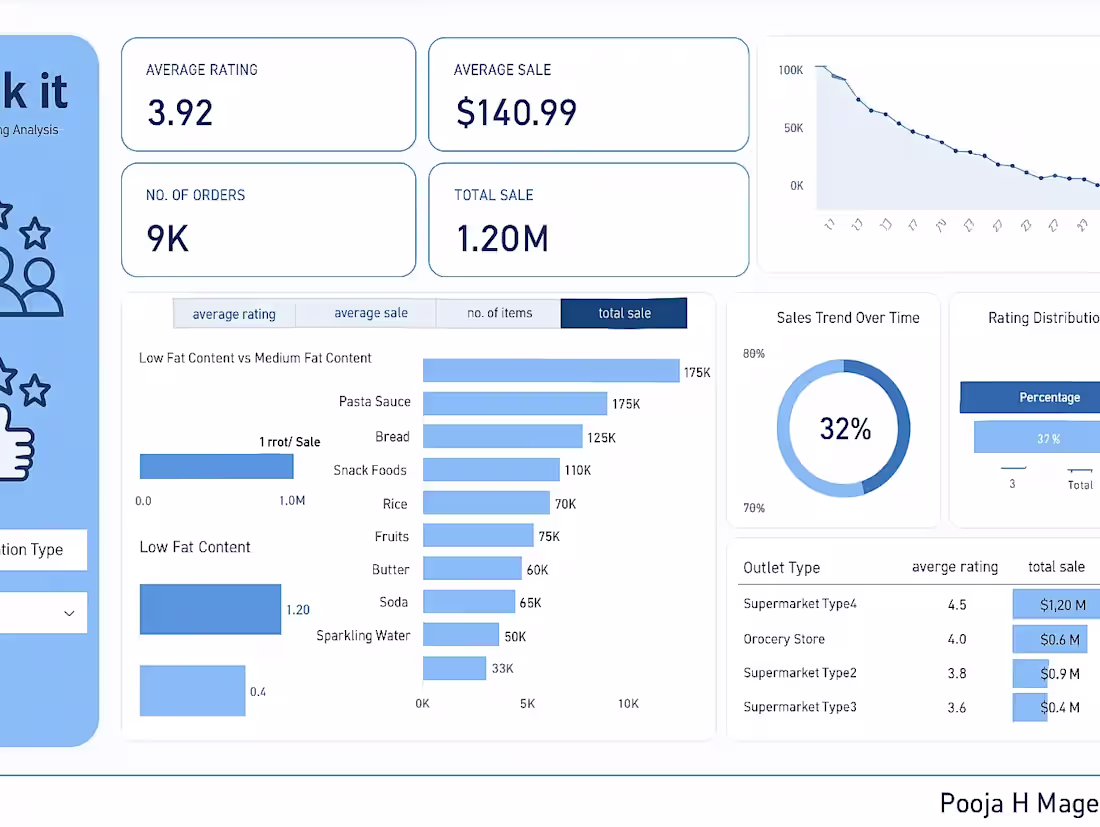
Sales Performance Dashboard
Tools Used:
SQL, Google Data Studio, Data Analysis, Data Visualization
Project Overview:
Developed an interactive and user-friendly sales performance dashboard using SQL and Google Data Studio. The project focused on tracking key performance indicators (KPIs), analyzing overall sales performance, and visualizing trends across products, regions, and time periods. This dashboard delivers actionable insights that help stakeholders monitor performance, identify growth opportunities, and make informed, data-driven decisions to improve revenue and operational efficiency.
Skills & Deliverables:
SQL for data extraction, cleaning, and transformation
Interactive dashboard creation in Google Data Studio
KPI tracking and trend visualization
Actionable insights to support strategic business decisions
0
58
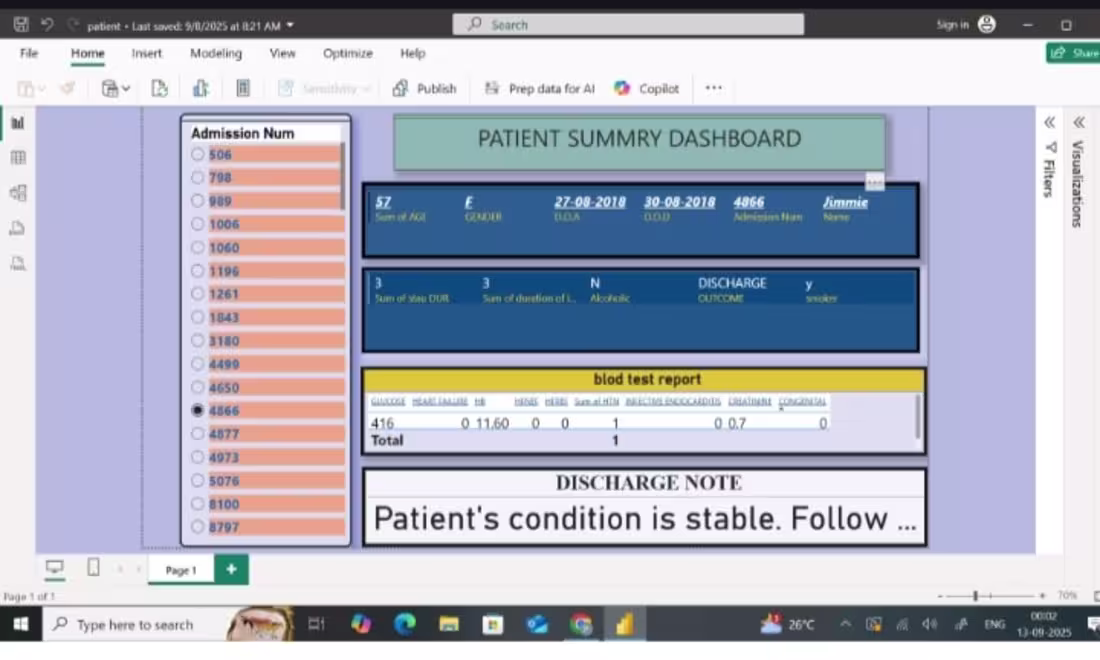
Project Title: Patient Summary Dashboard
Tools Used: Power BI, Data Analysis, Data Visualization
Project Overview:
Developed an interactive Power BI Patient Summary Dashboard that consolidates key patient information, including demographics, admission/discharge details, duration of stay, medical history, lifestyle factors, and lab test results. The dashboard allows doctors and healthcare staff to monitor patient conditions, analyze health outcomes, and make informed decisions. By integrating all critical records into a single platform, it improves operational efficiency, reduces manual work, and supports better patient care and hospital management.
Skills & Deliverables:
Data Analysis & Cleaning
Interactive Analytics Dashboard
Data Visualization & Reporting
Streamlined hospital workflows and enhanced decision-making
0
51
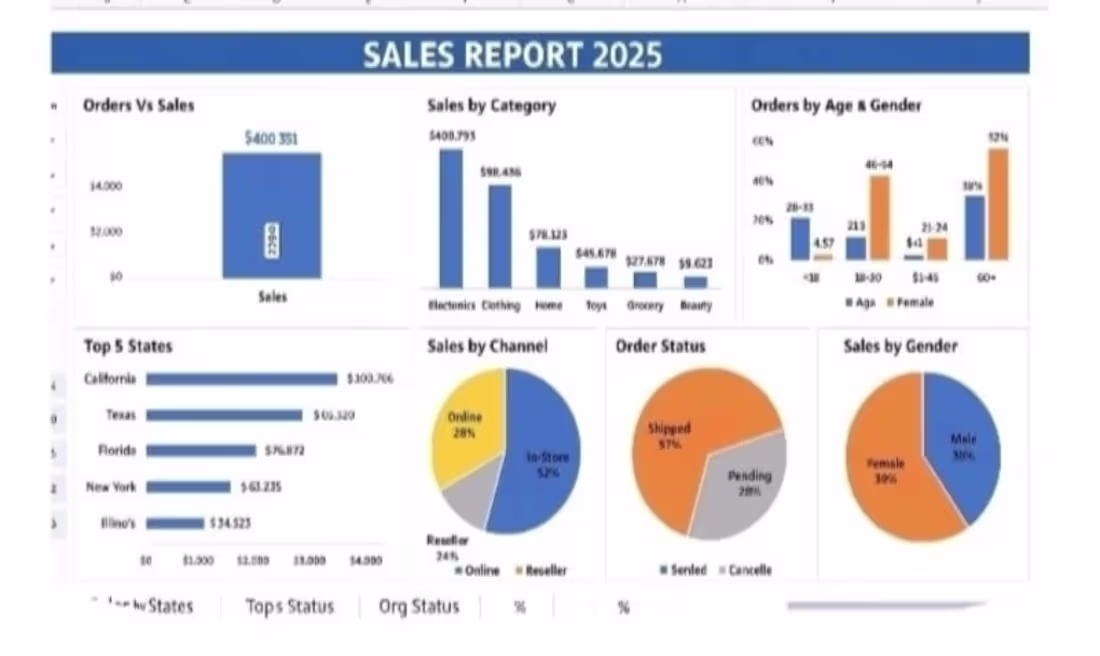
Project Title: Sales Data Analysis & Interactive Dashboard
Tools Used: Excel, Power BI, Data Visualization, Data Analysis
Project Overview:
Analyzed a dataset of over 10,000 sales records to identify key trends, seasonal patterns, and high-performing products. Developed a dynamic, interactive Power BI dashboard visualizing revenue, product categories, monthly trends, and customer behavior insights.
Impact:
Enabled the client to make data-driven decisions regarding inventory management and marketing strategies, improving operational efficiency and sales performance.
5
3
111
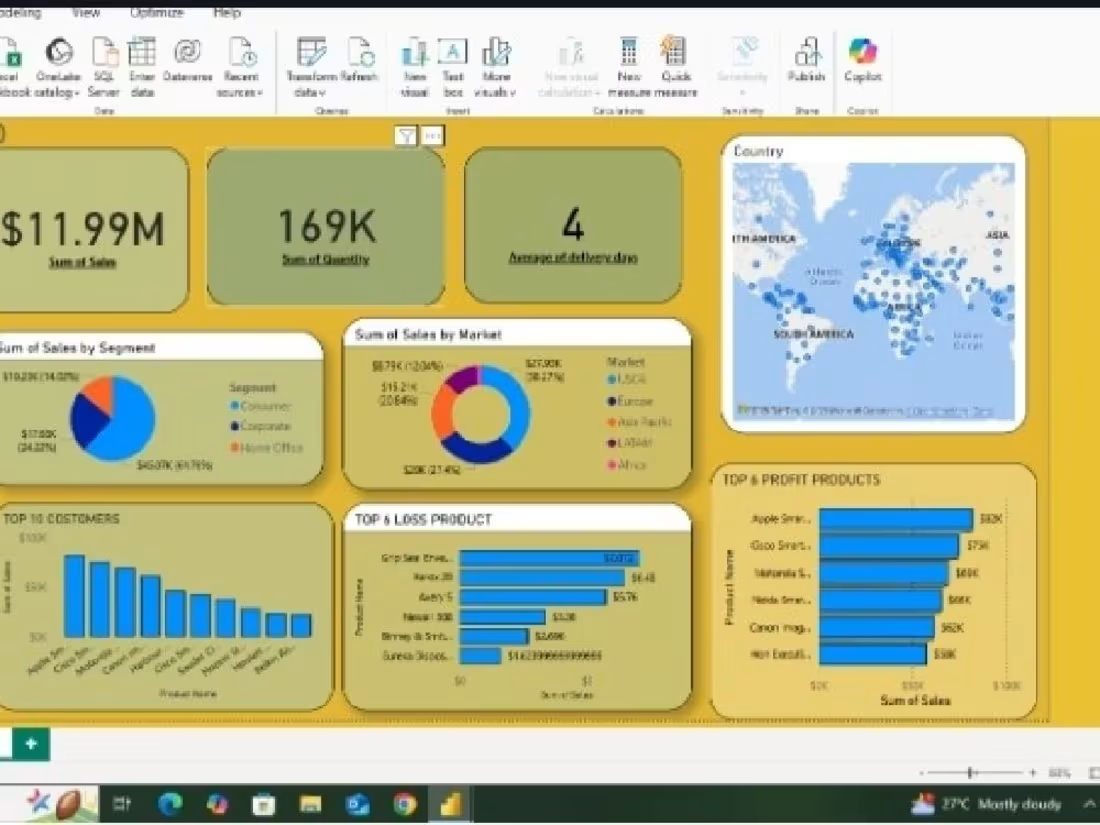
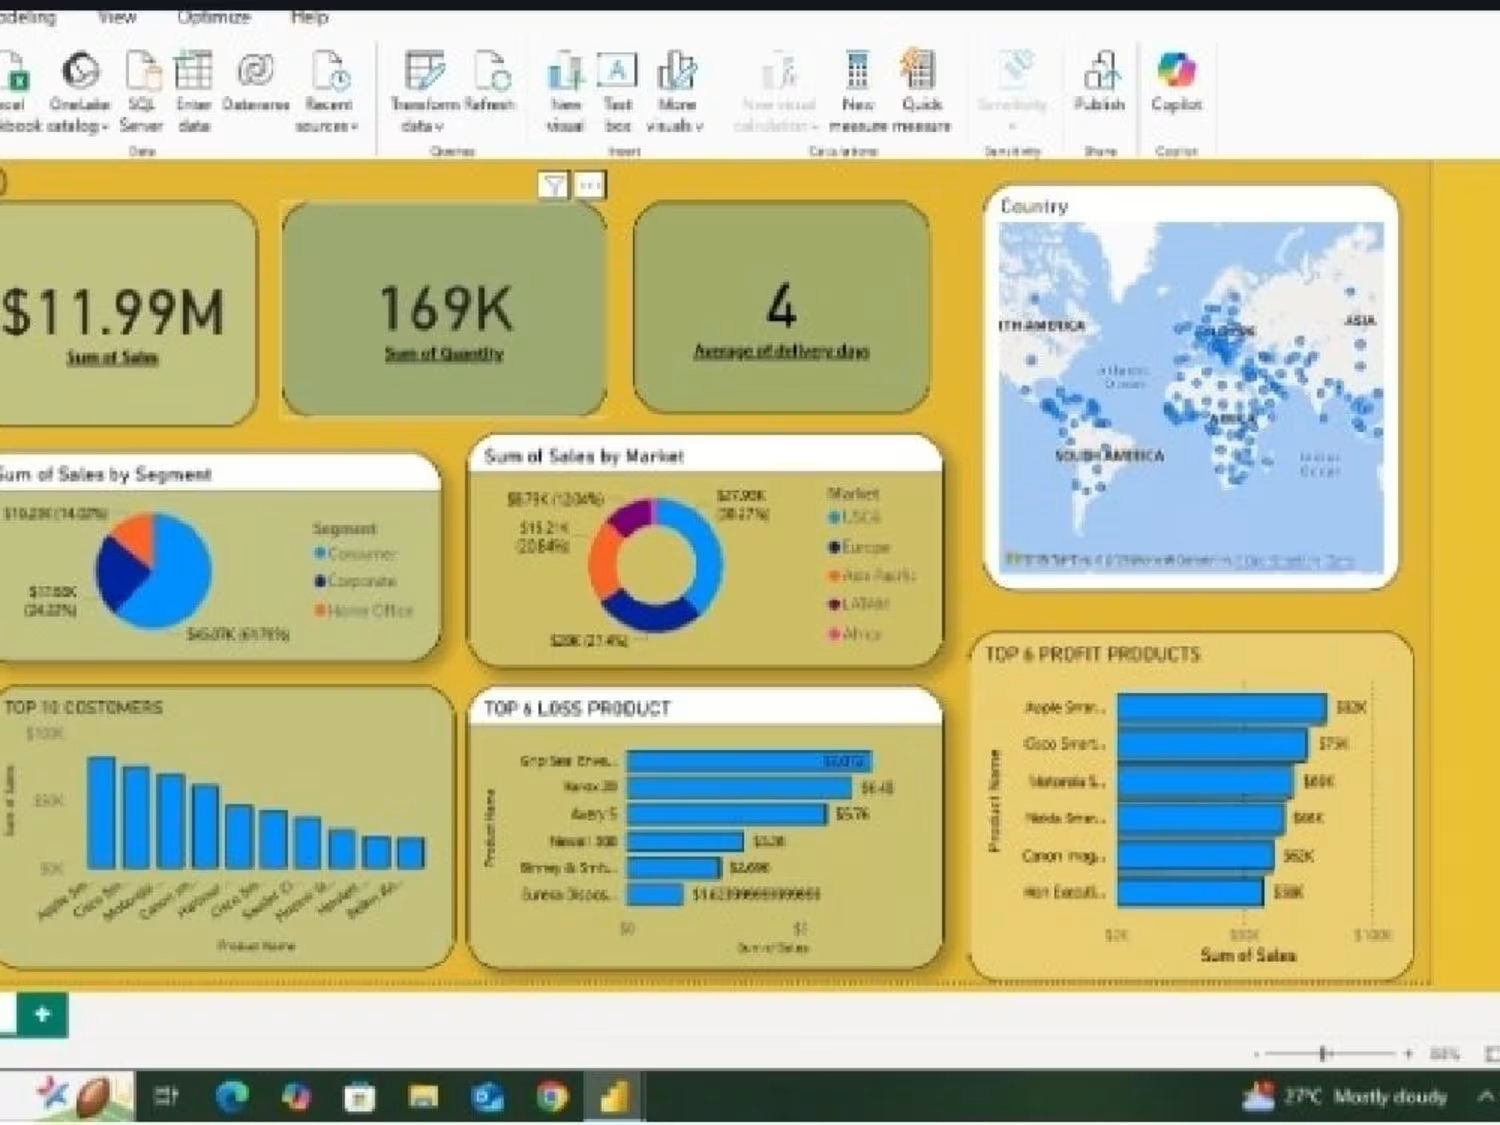
Global Sales Performance Dashboard
My Role:
Designed an end-to-end Power BI Sales Dashboard to track KPIs, markets, and product performance, supporting global business growth.
Project Description:
Developed a Power BI Sales Performance Dashboard delivering actionable insights into global sales operations. It tracks key KPIs such as total sales, quantity sold, and average delivery days. The dashboard shows sales distribution by segment and market, identifies top customers, and compares profit-making versus loss-making products. Interactive visuals and drill-down analytics help stakeholders analyze trends, monitor performance, and make data-driven decisions to improve efficiency, profitability, and strategic growth.
Skills & Deliverables:
Microsoft Power BI
Data Visualization
Data Analysis
Data Modeling
Data Cleaning
0
47