11:11 Admin Dashboard Development
Klevis Miho
Project Overview
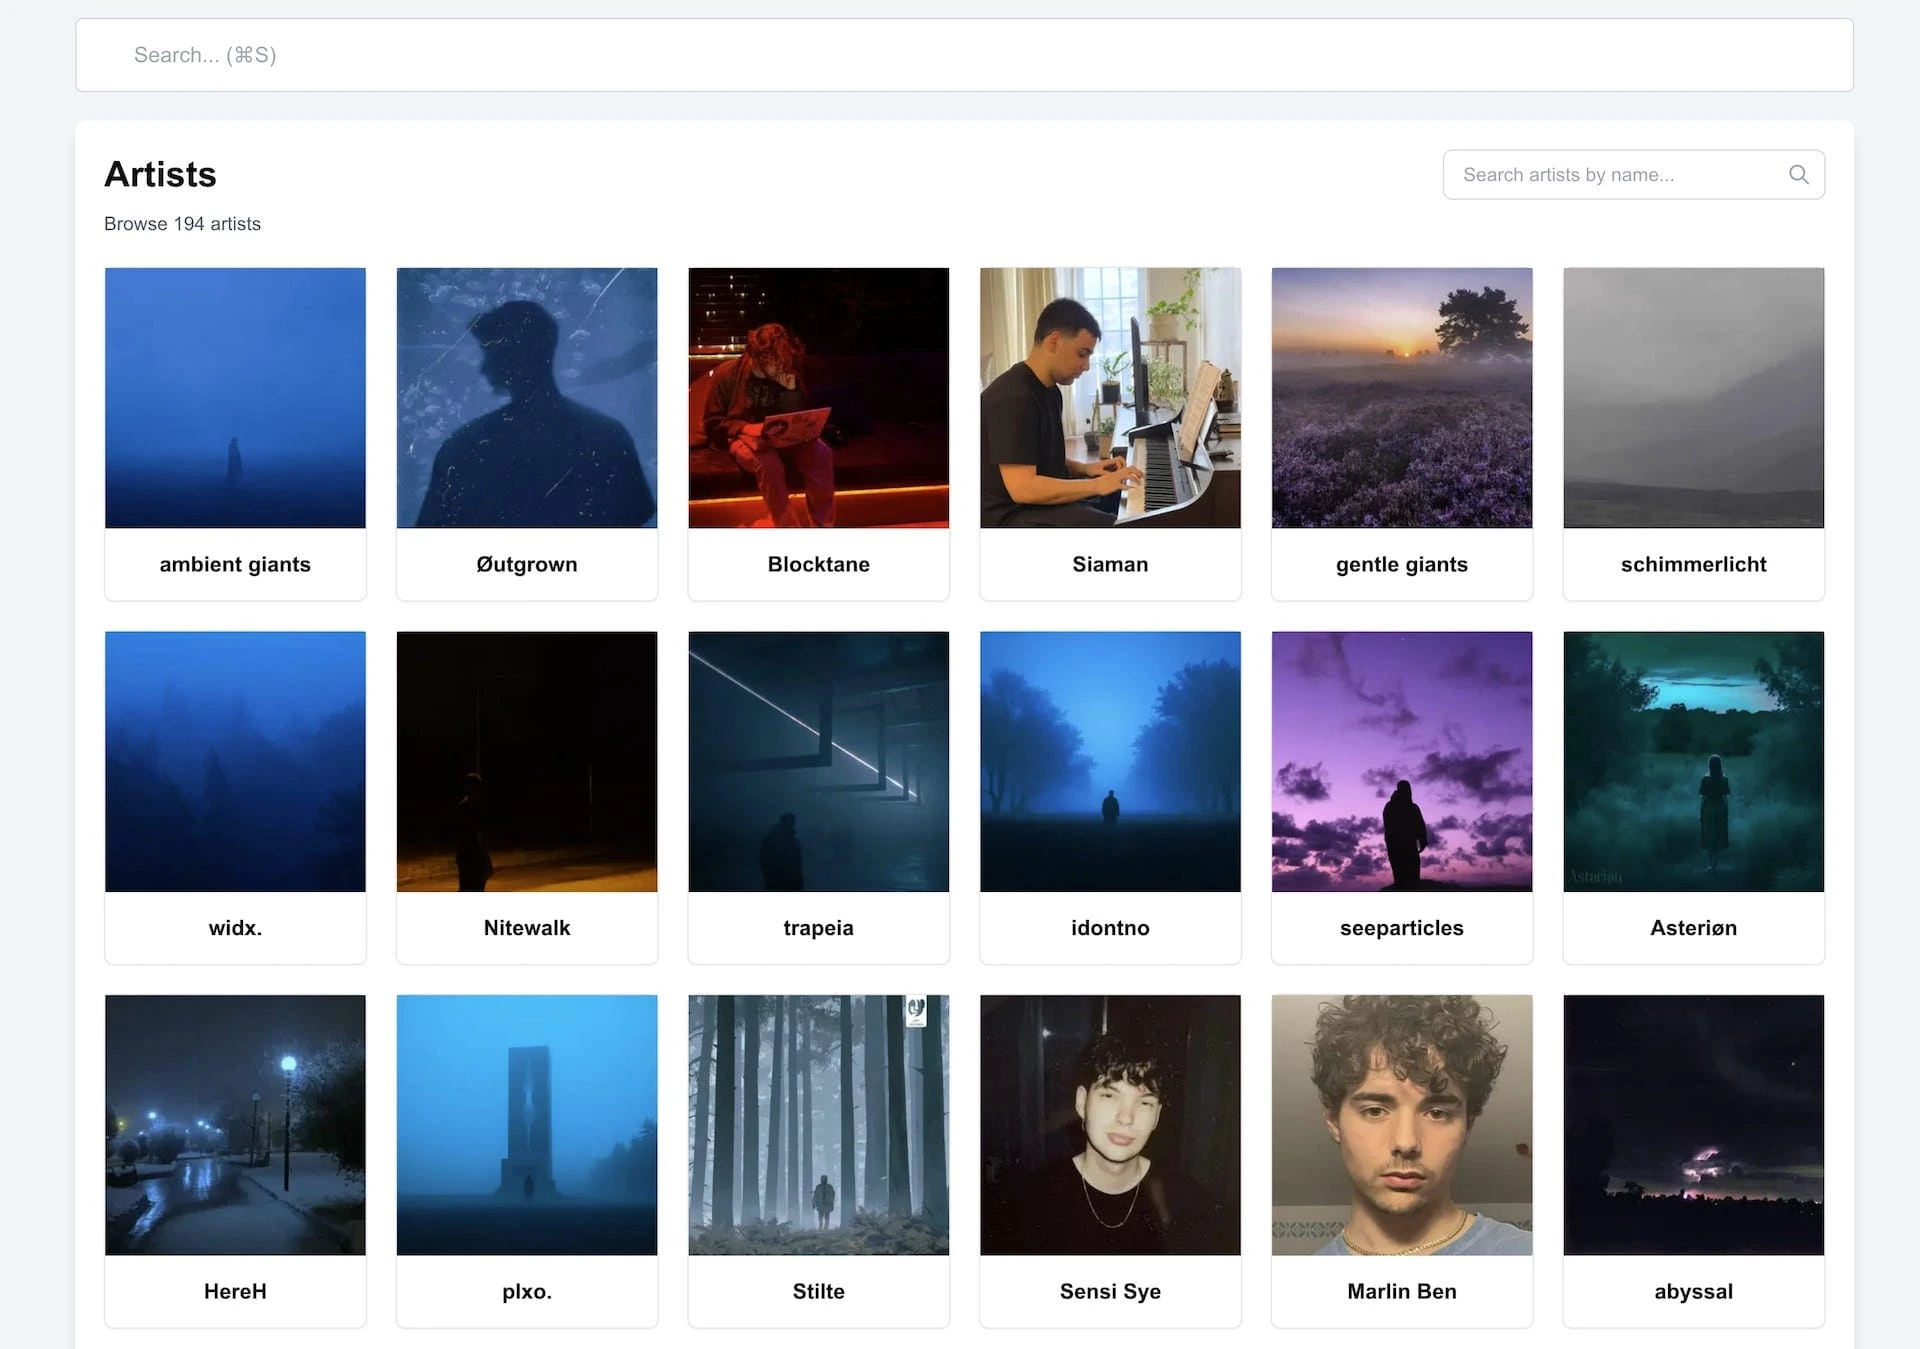
I developed 11:11 Admin Dashboard, a custom NextJS solution for managing the company’s extensive music promotion operations. The project involved creating a comprehensive administrative interface that streamlined playlist management, artist data tracking, and performance analytics.
Client: 11:11 (1111.io)
Project Duration: 6 Months
Role: Lead Dashboard Developer
Team Size: 20 team members
Technologies Used: NextJS, React, TypeScript, JavaScript, Tailwind CSS, ShadCN UI, ReCharts, API Integrations, SASS
Client Request
Objective: Create a powerful, centralized admin dashboard to manage 11:11’s growing network of playlists and artist relationships, while providing comprehensive analytics and operational tools.
Key Requirements:
Develop a comprehensive analytics dashboard for tracking artist performance across streaming platforms
Create data visualization components for streaming metrics, earnings, and playlist performance
Implement song-specific analytics with detailed breakdowns by country, platform, and time period
Build genre analysis tools to track performance across music categories
Design a flexible UI system with dark/light mode support and responsive layouts
Challenges:
Processing and visualizing complex streaming data from multiple sources and platforms
Building high-performance charts capable of rendering large datasets without impacting user experience
Creating a consistent component system that could scale to dozens of different analytics views
Implementing advanced filtering capabilities including date ranges, genres, and performance metrics
Balancing feature richness with intuitive UX for team members with different technical backgrounds
My Role & Solution
Role: Lead Dashboard Developer
Responsibilities:
Architected and developed a complete NextJS dashboard with over 40 specialized components
Implemented 15+ data visualization charts using ReCharts for metrics including streams, earnings, genre performance, and playlist growth
Created a comprehensive UI component library using ShadCN for rapid development and consistent styling
Built artist and song-specific analytics pages with detailed performance breakdowns
Developed advanced filtering systems including date range pickers, genre filters, and performance thresholds
Implemented theme switching functionality with dark and light mode support
Created a global search system for quickly finding artists, songs, and playlists
Created a comparison system to compare two songs
Technologies Used:
Frontend Framework: NextJS, React
Programming Languages: TypeScript, JavaScript
UI Components: ShadCN UI (including 20+ UI components such as accordion, avatar, badge, button, calendar, card, checkbox, dialog, dropdown menu, input, navigation menu, select, slider, table)
Data Visualization: ReCharts (implementing pie charts, line charts, bar charts for metrics visualization)
Styling: Tailwind CSS, SASS
State Management: React Context API, Custom Hooks
API Integration: REST APIs, Fetch API
Outcome
Successfully delivered a comprehensive analytics platform that centralized 11:11’s music performance data
Created over 40 specialized components including 15+ data visualization charts for tracking streams, earnings, and playlist growth
Enabled deep insights into artist performance with country-specific breakdowns, genre analysis, and earnings tracking
Implemented song-level analytics showing playlist counts, listener growth, saves, and streaming patterns
Developed a flexible, theme-switchable UI that improved team productivity and decision-making
Built a system capable of processing and visualizing data for 1,000+ tracks and nearly a billion streams
Lessons Learned
Component-based architecture is essential for building complex dashboards with multiple visualization types
TypeScript significantly improves development speed and code reliability in large-scale React applications
ShadCN UI components provide an excellent foundation for consistent, accessible interfaces
Chart optimization techniques are crucial when visualizing large datasets to maintain performance
Flexible filtering systems dramatically increase the value of analytics platforms by enabling custom insights
Like this project
Posted Apr 24, 2025
Developed a custom NextJS admin dashboard for 11:11's music promotion operations.
Likes
0
Views
5