LinkedIn Content Performance Analysis for DataGirls Tanzania

Plensia Lukosi

LinkedIn Content Performance Analysis
Business problem: For a growing organization's LinkedIn presence, which content actually earns attention, and which content converts that attention into engagement? Those aren't the same question — and the answer shapes what to post next.
This analyzes 59 organic posts published by DataGirls Tanzania between January and November 2024, using LinkedIn's own analytics export (impressions, clicks, likes, comments, reposts, engagement rate) enriched with manually-tagged content topics and post-length categories.
Guiding questions
The dashboard is organized around three views, each answering a distinct question:
Visibility — how has reach trended over the year, and which content topics get seen the most?
Engagement — which day of the week, and which content topics, actually convert views into engagement — not just impressions?
Post length — does post length affect performance, and is "shorter is better" actually true for this audience?
What the data showed
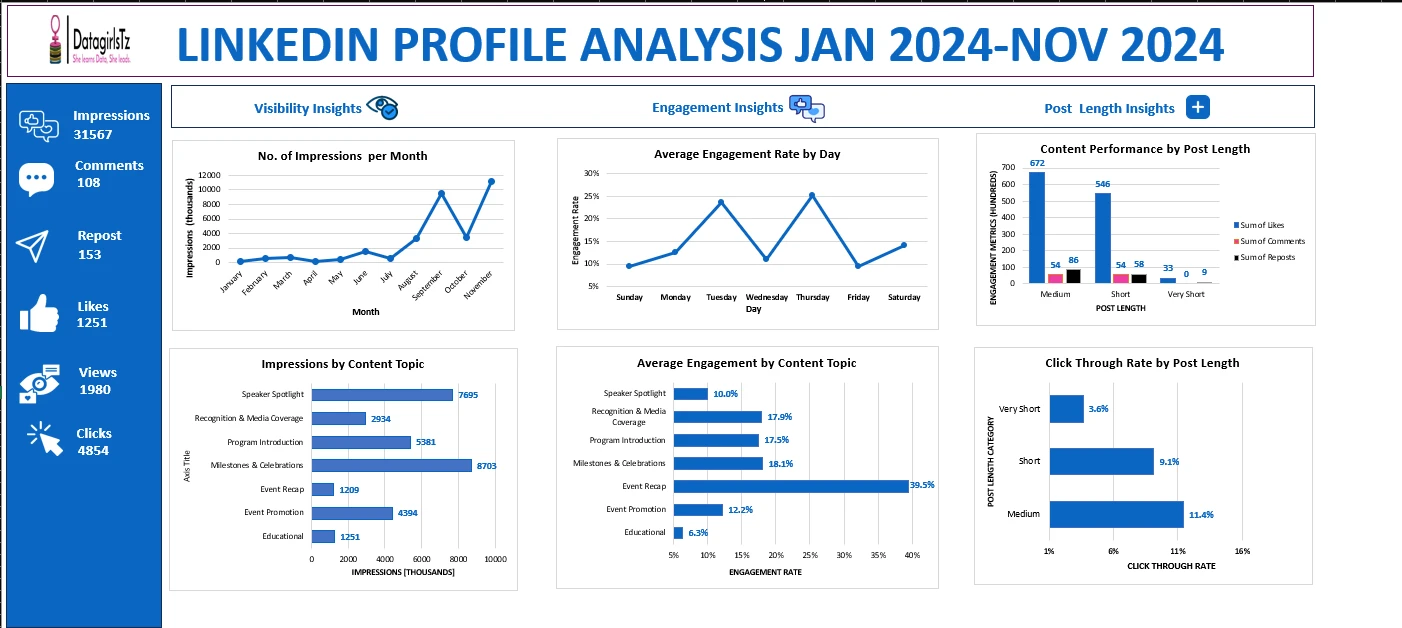
Reach grew sharply late in the year — monthly impressions climbed from ~1,000-2,000 early on to over 10,000 by November, tracking the organization's growing event/community activity.
Visibility and engagement don't reward the same content. "Milestones & Celebrations" and "Speaker Spotlight" post topics drive the most impressions (8,703 and 7,695), but "Event Recap" posts — with far fewer impressions (1,209) — have by far the highest engagement rate at 39.5%, more than double the next-best topic. Big-reach content isn't the content that gets people to actually engage.
Medium-length posts outperform short ones on every metric that matters. Medium-length posts drove the most combined engagement (672 likes/comments/reposts) and the highest click-through rate (11.4%, vs. 9.1% for short posts and 3.6% for very short ones) — the opposite of the common assumption that brevity wins on LinkedIn.
Engagement peaks mid-week. Tuesday and Thursday clearly outperform the rest of the week, with weekends the weakest.
Recommendation: prioritize medium-length, recap-style storytelling posts, scheduled around Tuesday/Thursday — and don't over-index on high-impression "celebration" posts alone, since they don't convert to engagement nearly as efficiently as recap content does.
A note on data quality
Reviewing the underlying workbook surfaced a few real data issues that were fixed before analysis:
Two content-topic labels had inconsistent spelling/casing (
Program Intoduction / Program Introduction, and a lowercase milestones & Celebrations), silently splitting single categories into two in the charts — consolidated.A leftover "Total" summary row was embedded directly inside the raw per-post data table, which was injecting a phantom
0 content-topic and a phantom Very Long post-length category into the breakdown charts — removed.Dashboard
Repo structure
Tools
Microsoft Excel — PivotTables, PivotCharts, and manual content/length tagging on top of LinkedIn's native analytics export.
Like this project
Posted Aug 25, 2026
Analyzed DataGirls Tanzania's LinkedIn post performance to optimize engagement strategies.
Likes
0
Views
0