Great American Coffee Taste Analysis

Plensia Lukosi

Great American Coffee Taste Analysis
A demographic and preference breakdown of 4,023 coffee drinkers, paired with a blind taste test comparing four coffees — built on Maven Analytics' public "Great American Coffee Taste Test" community challenge dataset.
Worth knowing upfront: this is a well-known community challenge dataset, so it's included here as a secondary portfolio piece rather than a flagship — the value in documenting it is the data-quality diligence and the specific findings below, not dataset originality.
What the data showed
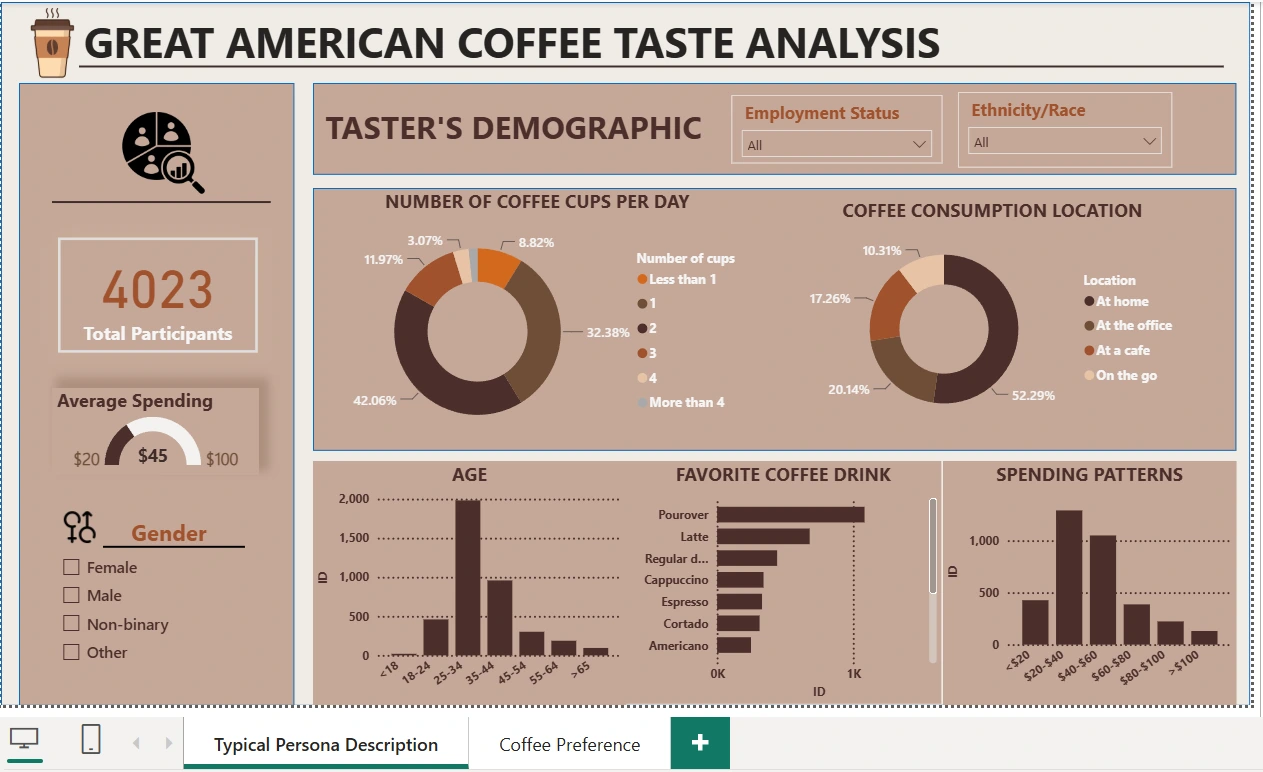
4,023 participants, averaging $45/month spent on coffee, drinking mostly 1-2 cups a day, primarily at home (52.3% of consumption).
Reported roast preference skews light, not dark — Light and Medium roast are named far more often than Dark, contrary to the common assumption that most drinkers prefer a "bold" roast.
Stated preference and blind performance agree. Coffee D is both the most popular self-reported coffee (36.7% picked it as their favorite) and the winner of the blind taste test (3.38 average preference score, the highest of the four) — people's stated taste actually held up when the branding was removed.
Pour-over is the most preferred home brewing method, ahead of drip, French press, and espresso-based drinks.
A note on data quality
The dashboard's category charts had a systemic ordering bug: Age, Cups-per-day, and Spending Patterns are all fixed-choice survey questions with a natural sequence (e.g., age brackets should read
<18 → 18-24 → ... → >65), but the charts were sorting by response count instead — scrambling the reading order. Fixed by adding custom sort-order columns in Power Query and applying Sort by Column against the visible field, for all three.Roast Preference, Favorite Coffee Drink, and Top Coffee Descriptions were deliberately left sorted by popularity (response count) rather than forced into a fixed order — those are open, nominal categories with no inherent sequence, so "most common first" is the more useful reading, not a bug to fix.
Dashboard
Typical Persona Description — demographics, consumption habits, and spending.
Coffee Preference — self-reported preference vs. blind taste test results.
Repo structure
Tools
Power BI Desktop — Power Query (M) for data-quality fixes and custom sort ordering, native visuals for the dashboard.
Source
Maven Analytics — Great American Coffee Taste Test Challenge (data originally collected via a public YouTube blind coffee taste test).
Like this project
Posted Aug 25, 2026
A comprehensive analysis of coffee preferences using public dataset.
Likes
0
Views
1