Data Visualization for Marketing Campaigns with Tableau
Reema S
This project focuses on creating dynamic and interactive data visualizations using Tableau to analyze and enhance the effectiveness of your marketing campaigns. By leveraging key metrics and performance indicators, we will provide actionable insights that drive decision-making and improve future marketing strategies.
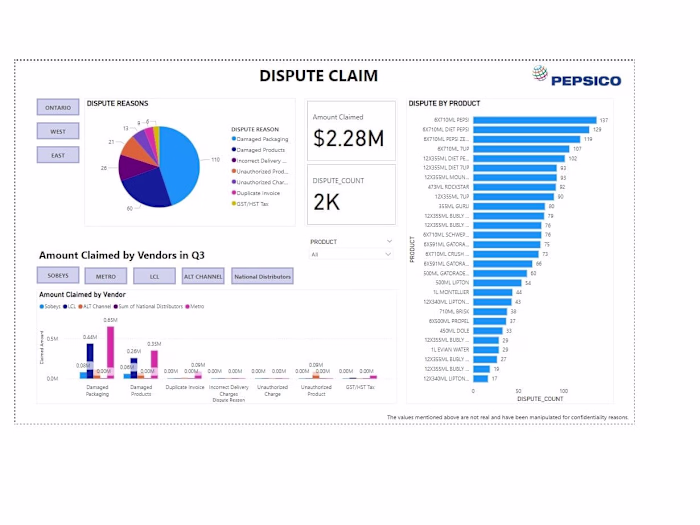
Project 1: Interactive Marketing Dashboard:
A comprehensive dashboard showcasing key performance indicators (KPIs) for all marketing campaigns, allowing for real-time data exploration.
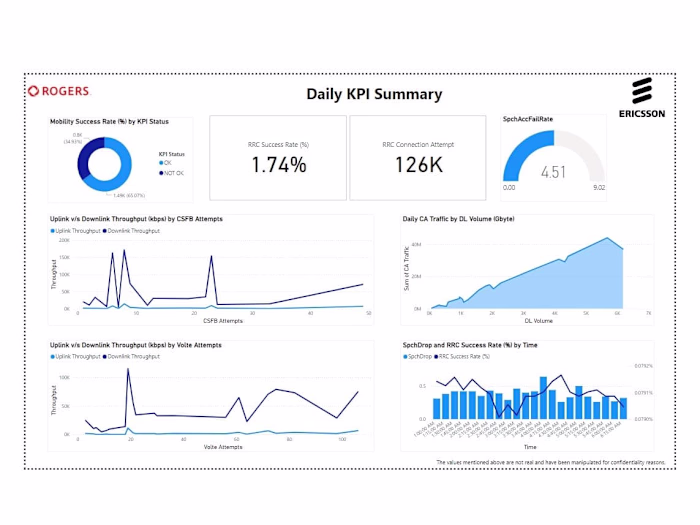
Project 2: Campaign Performance Reports:
Detailed reports summarizing the performance of individual campaigns, including comparisons and recommendations for future efforts.
Project 3: Final Presentation of Insights:
A presentation summarizing key findings, trends, and strategic recommendations based on the data visualizations.
Like this project
Posted Oct 23, 2024
Utilizing Tableau to create dynamic dashboards that will provide insights into the effectiveness of marketing campaigns providing impactful targeted strategy