COVID-19 Dashboard
Simon Buisson
The problem
At the start of the COVID-19 pandemic in 2019, it was difficult to get up to date numbers on the global progression of the pandemic.
Raw data were recorded and published freely in github - it only needed a visualisation system built on top the data to provide people with the insights they needed to keep an eye on the virus spread.
The implementation
I implemented several types of data visualisation to give users insights:
A world map highlighting countries with the highest count of active cases
Covid-19 world map
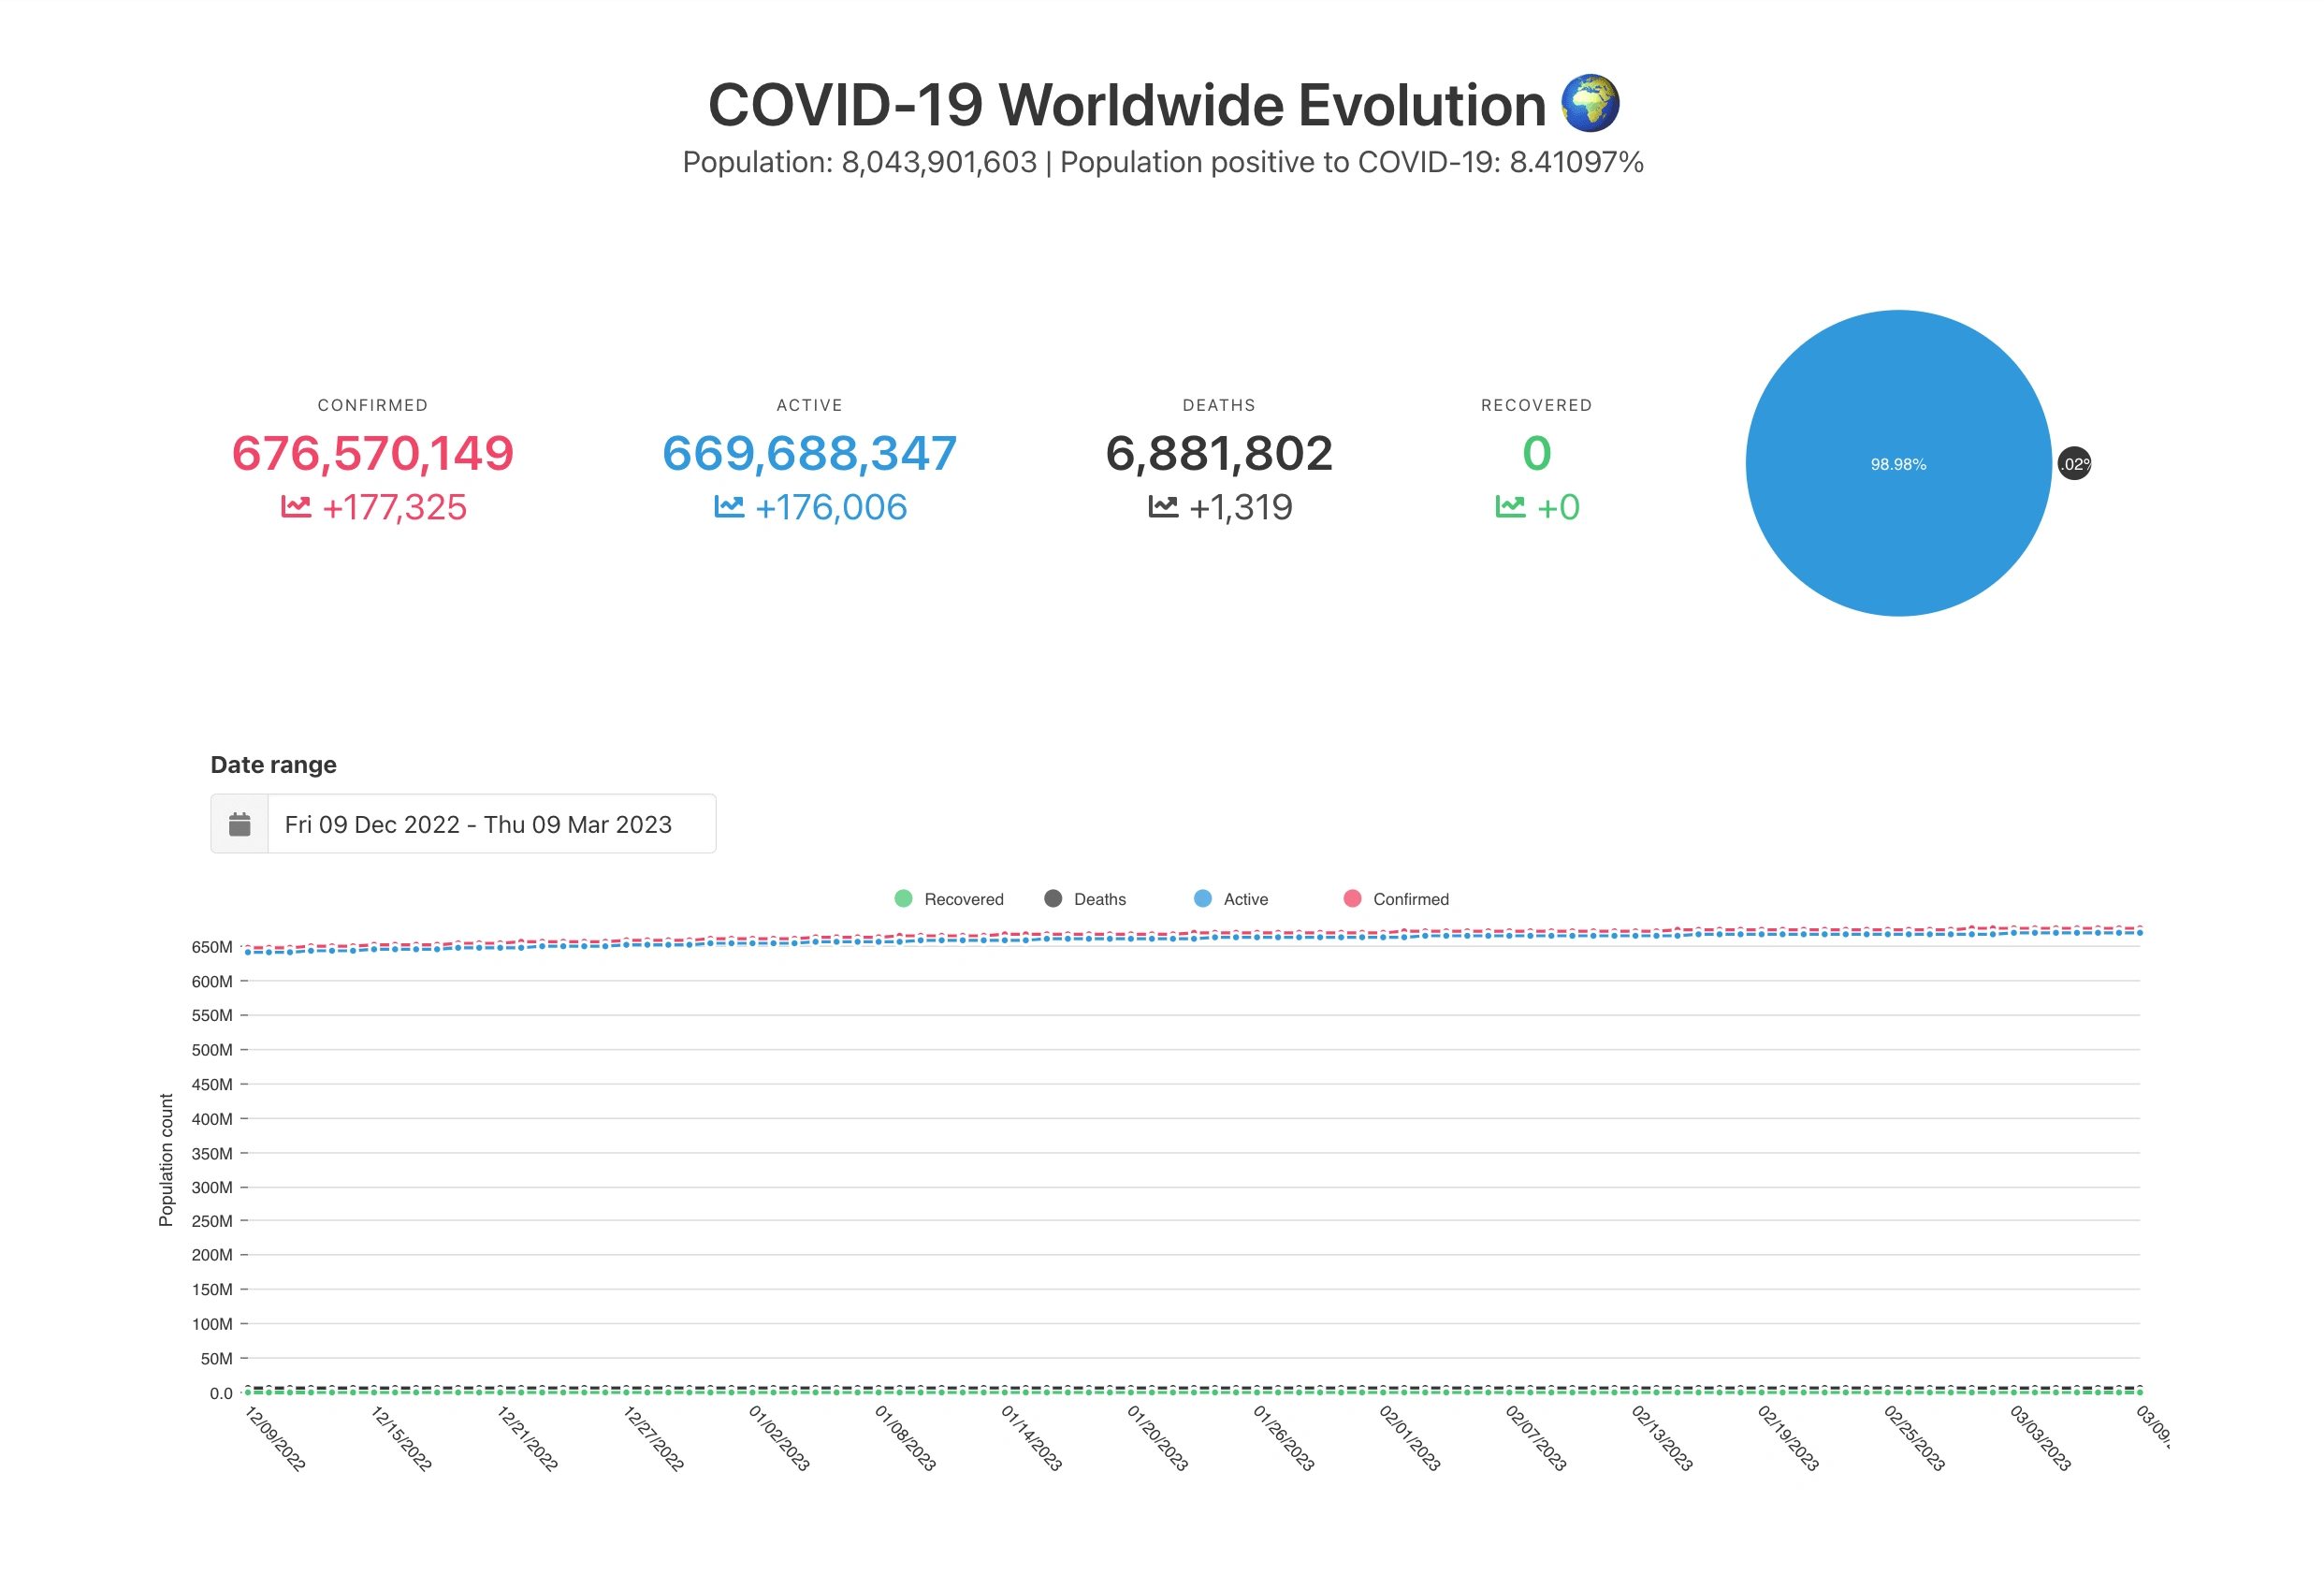
A landing page featuring the latest global number and their deltas from the previous day
A table listing data for each country as well a the delta from the previous day
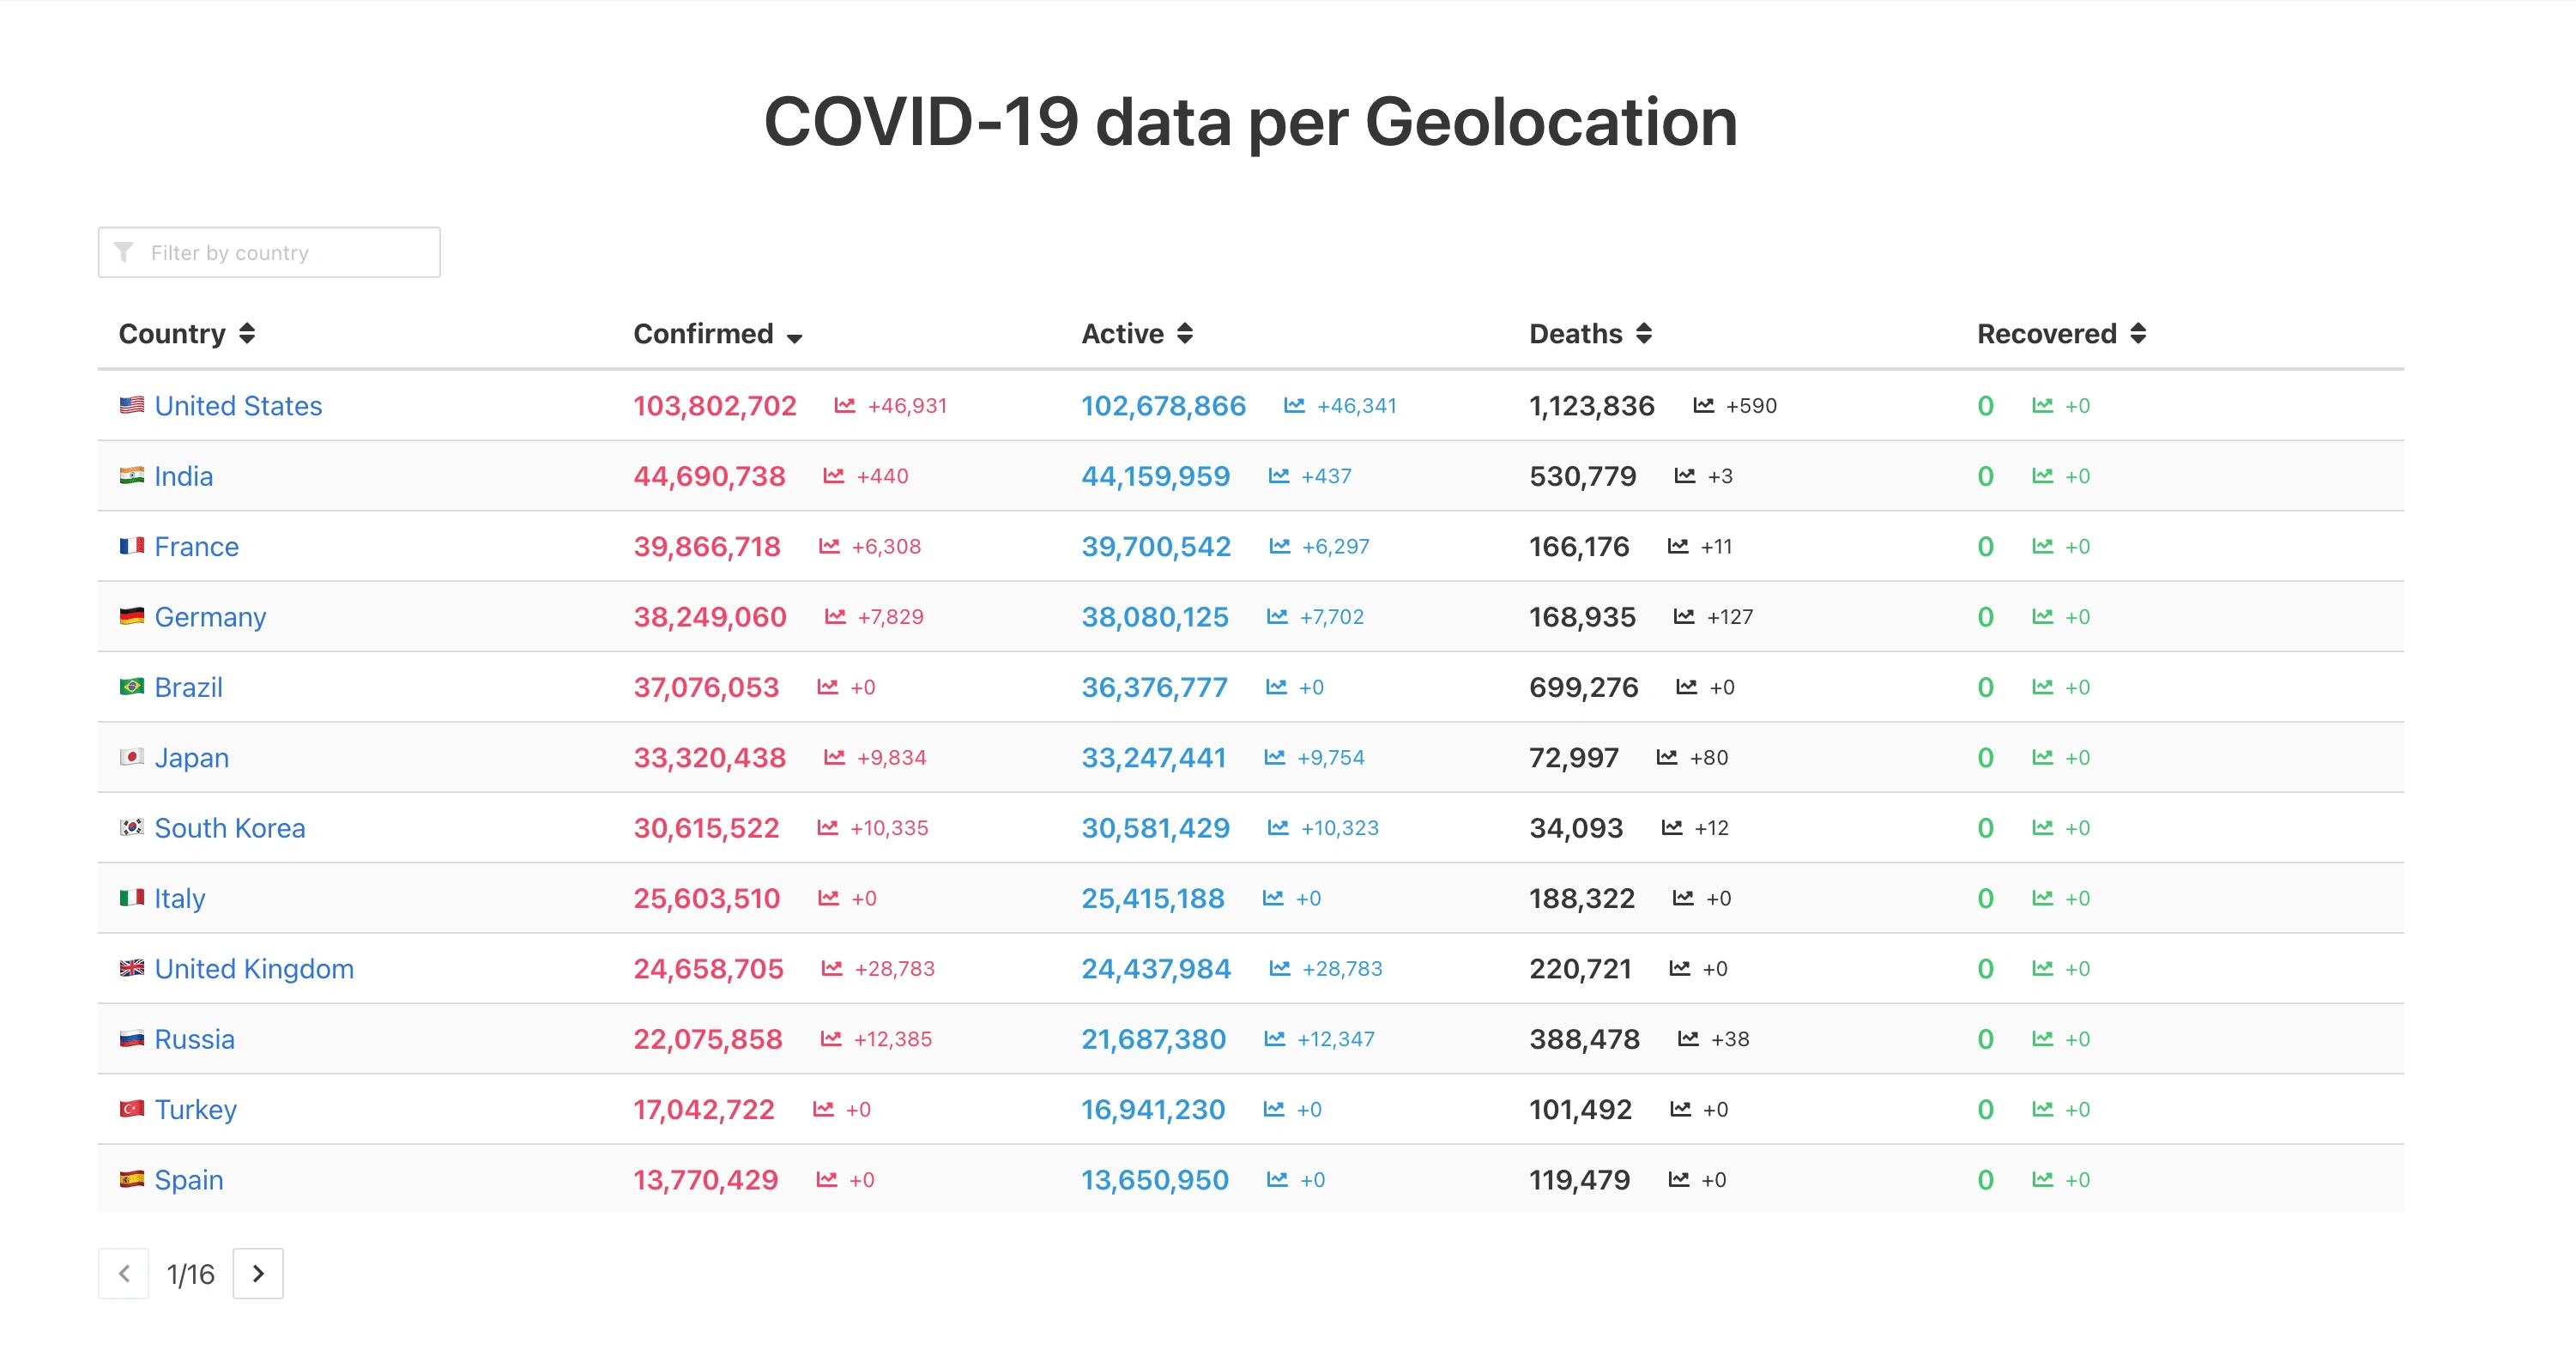
COVID-19 countries table with deltas
An animated chart showing the most affected countries over time
COVID-19 ranking over time
Like this project
Posted Nov 26, 2024
Interactive dashboard updated daily providing vital information on the spread of the COVID-19 virus during the pandemic.
Likes
0
Views
9