Financial Market Analysis: Stocks & Crypto Volatility
Ciro
Financial Market Analysis: Stocks & Crypto Volatility
An end-to-end data analysis project focusing on the risk-return profiles of traditional tech equities (AAPL, TSLA) and major cryptocurrencies (BTC, ETH). This project demonstrates a full pipeline from API extraction to interactive visualization.
Project Overview
The goal of this project is to quantify "market noise" and volatility across different asset classes. By calculating historical volatility and moving averages, we can identify which assets offer stability and which offer high-risk growth opportunities.
Key Findings:
The Volatility Paradox: Analysis reveals that Tesla (TSLA) often exhibits higher daily volatility than Bitcoin (BTC), challenging the "crypto is always riskier" narrative.
Anchor Assets: Apple (AAPL) consistently presents the lowest standard deviation, acting as the portfolio stabilizer.
Technical Stack
Language: Python 3.13
Libraries:
yfinance, pandas, SQLAlchemyDatabase: PostgreSQL (managed via DBeaver/pgAdmin)
Visualization: Tableau Public
ETL Logic: Automated Python script to fetch, clean, and load API data.
Data Architecture & ETL
The project follows a structured data engineering workflow:
Extraction (
stock.py):Connects to Yahoo Finance API.
Flattens MultiIndex DataFrames for relational compatibility.
Uses SQLAlchemy to
merge records into PostgreSQL, preventing duplicates.Transformation (SQL Views):
Window Functions: Used
AVG() OVER to calculate 20-day and 50-day Simple Moving Averages (SMA).Lag Functions: Used
LAG() to calculate Daily Returns, which serves as the basis for volatility math.Visualization:
Data exported via CSV to Tableau Public for high-fidelity analysis.
Analysis & Dashboards
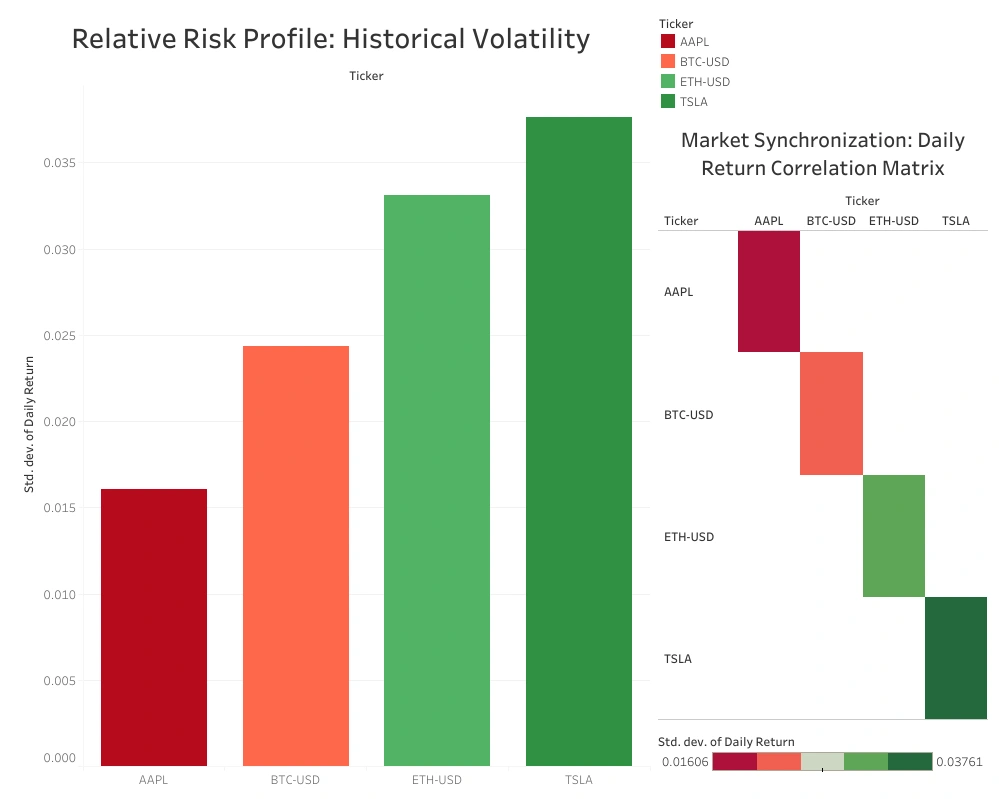
1. Risk Profile (Volatility Bar Chart)
This visualization ranks assets by their Standard Deviation of Daily Returns. It highlights the "Risk Hierarchy" of the selected portfolio.
2. Market Intensity (Heatmap)
A highlight table showing daily performance intensity. It allows for quick identification of market-wide "Green Days" vs. asset-specific "Red Days."

Like this project
Posted Jan 27, 2026
Analyzed stocks and crypto volatility for risk and stability.