Dashboard Description – Performance Tracker This
Arif Kanjirapuzha
Dashboard Description – Performance Tracker
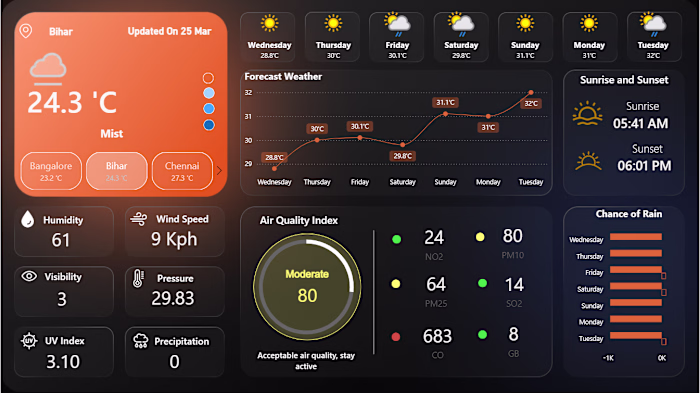
This Performance Tracker Dashboard presents a consolidated view of annual sales performance, growth indicators, and operational trends for a smartwatch product line.
At the top, key Year-to-Date (YTD) KPIs—including Sales 2023, Sales 2022, and Budget 2023—are highlighted with directional indicators to show progress and variance. The dashboard also visualizes category-level and segment-level growth rates through circular progress visuals, making year-over-year performance immediately understandable.
Sales by Segment is displayed through a monthly bar chart, showing how different periods contribute to total revenue.
Orders by Month uses a smooth line graph to track order volume trends, highlighting seasonal peaks and demand patterns.
Like this project
Posted Mar 26, 2026
Dashboard Description – Performance Tracker This Performance Tracker Dashboard presents a consolidated view of annual sales performance, growth indicators, a...