
Daily UI 018, Analytics Chart: a revenue dashboard for Orla, a fictional AI-powered iGaming platform. It shows daily gross gaming revenue by product, four KPIs with their change, the revenue split by vertical, and an Orla AI insight that explains the numbers and invites a follow-up. Mobile-first: stacked KPIs at 375, two-up at 768 and a full side nav at 1440, in dark and light themes. Designed in Figma, with Claude as my AI design partner.

Orla revenue analytics on a laptop and phone, wrapped in a glowing gold halo
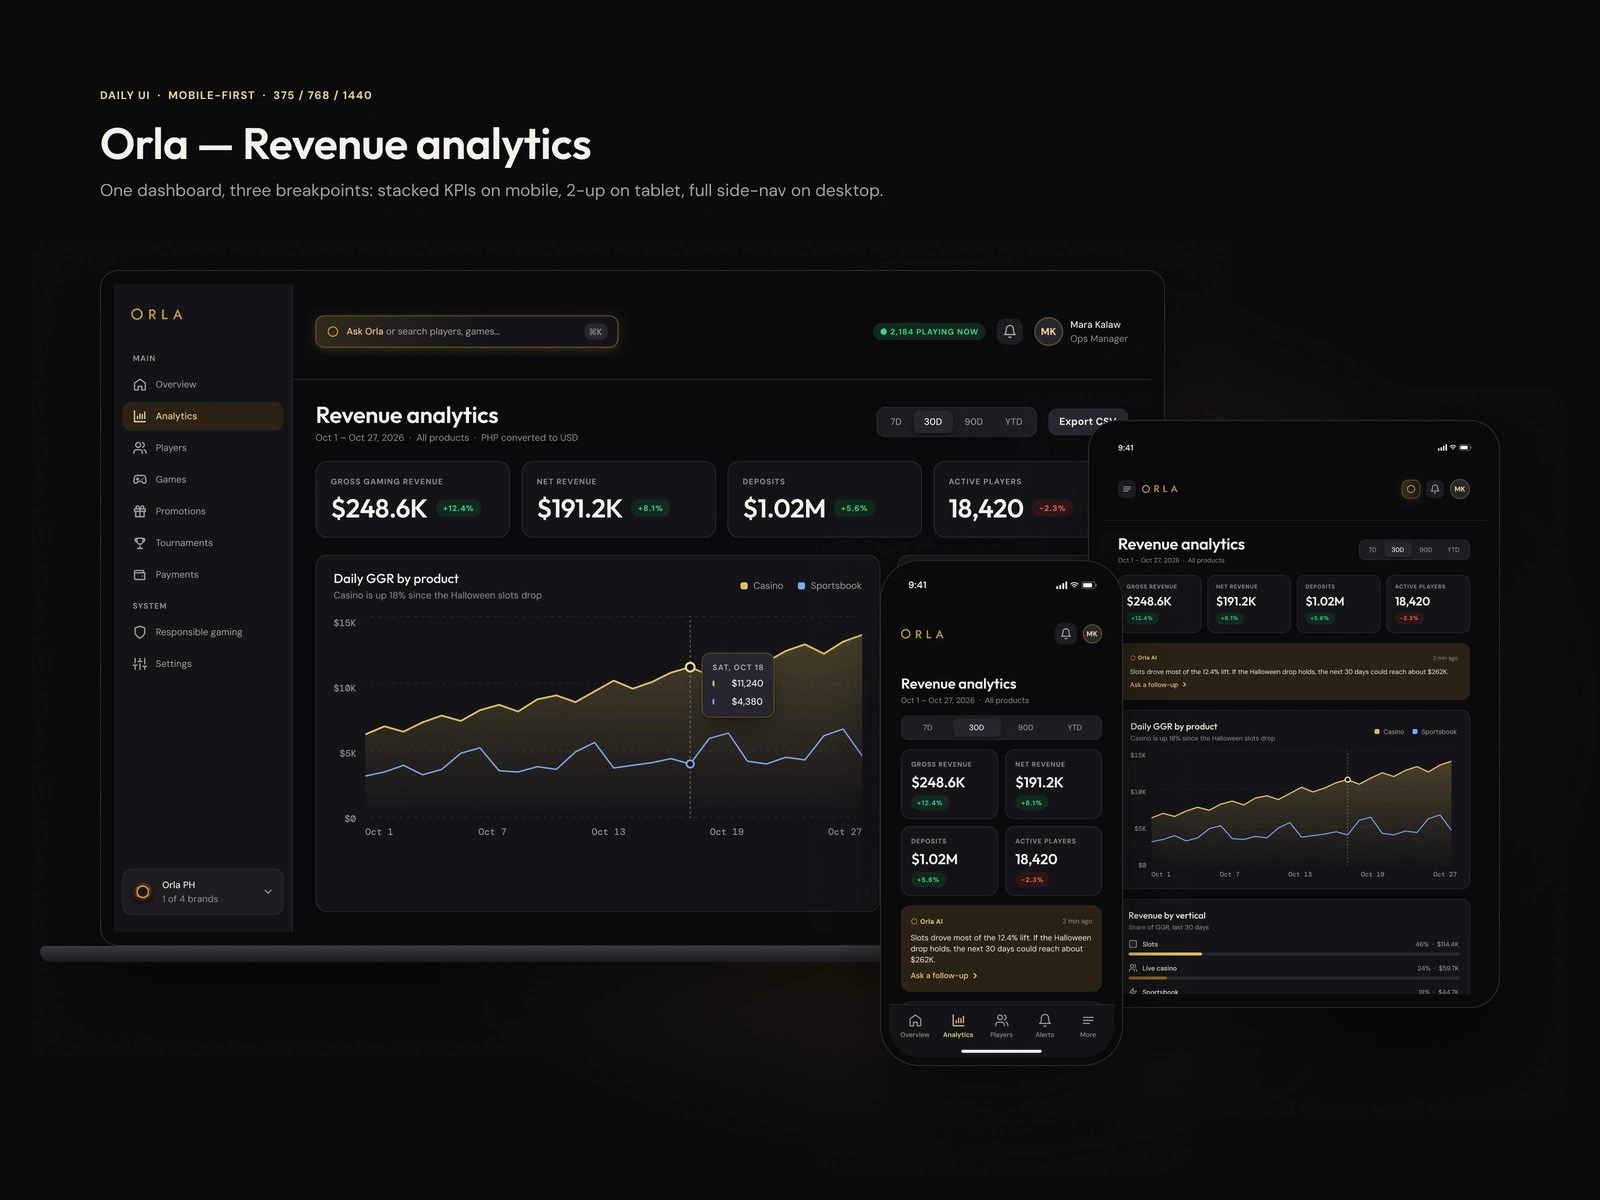
Orla revenue analytics shown on a laptop, tablet and phone in the dark theme
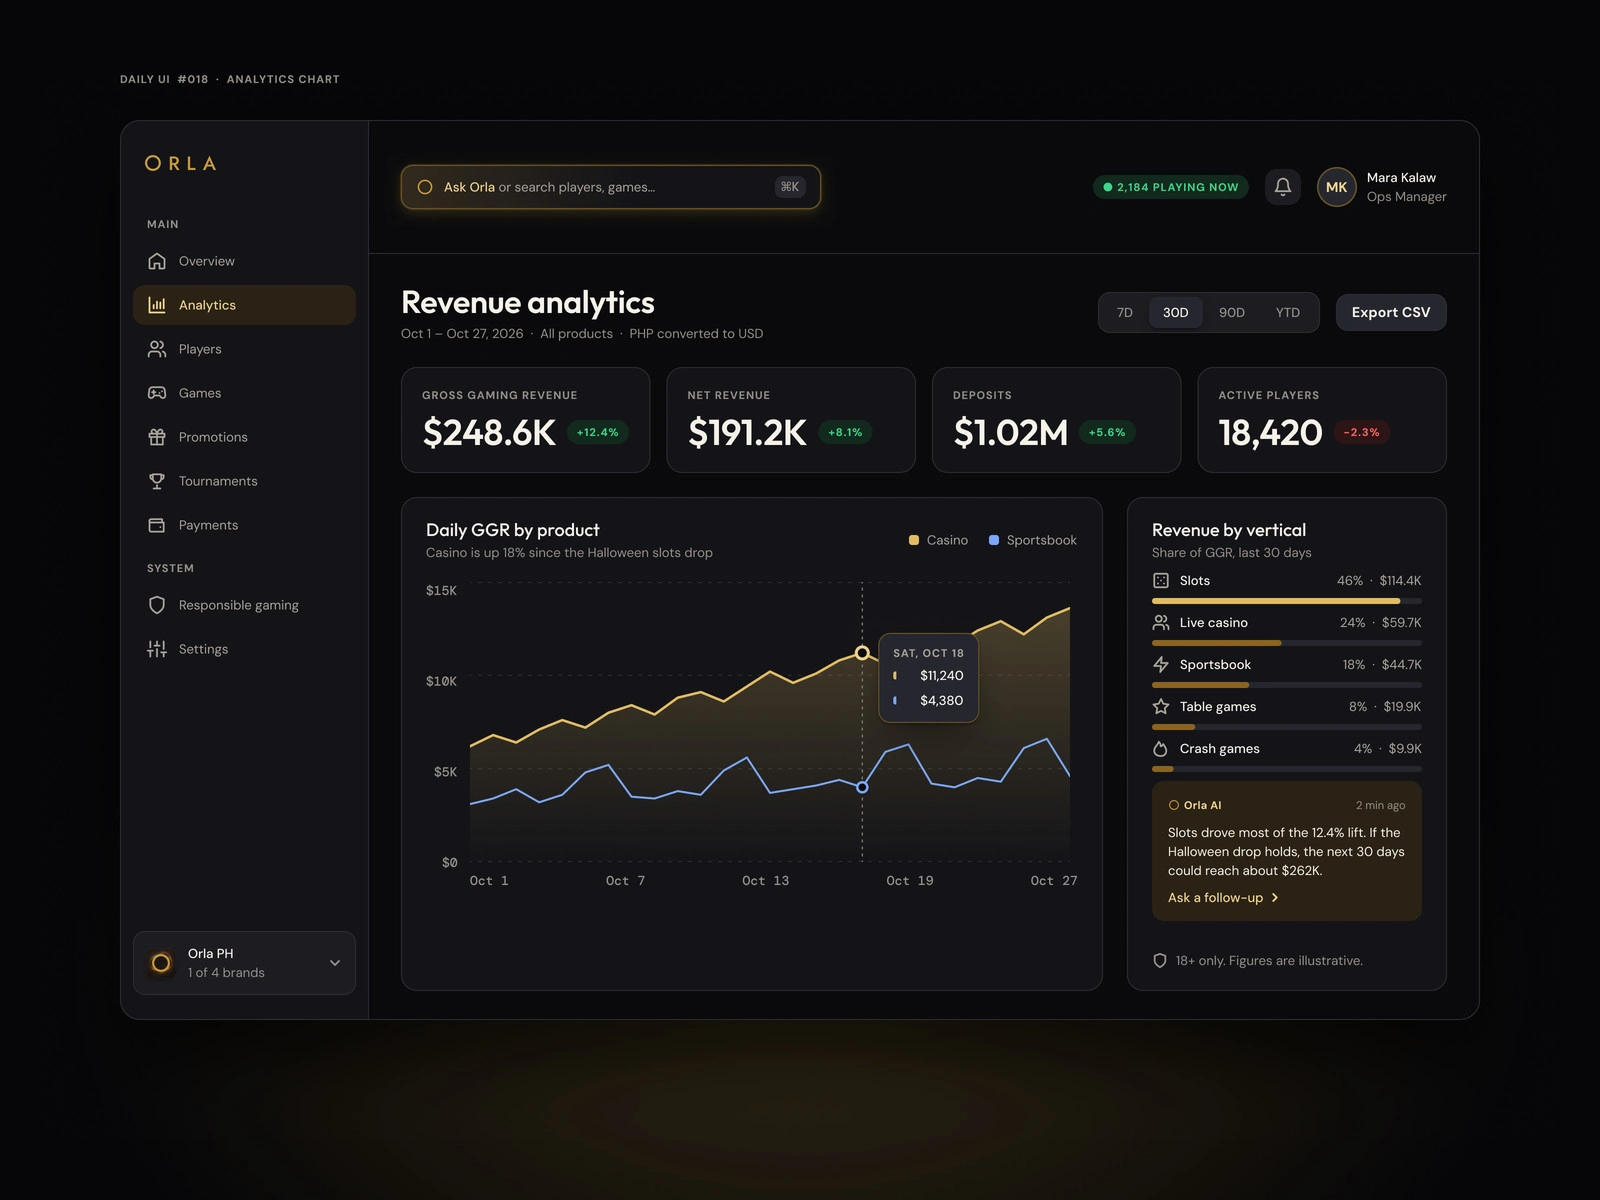
Dark revenue dashboard with KPI cards, a daily revenue chart with a tooltip, and an Orla AI insight
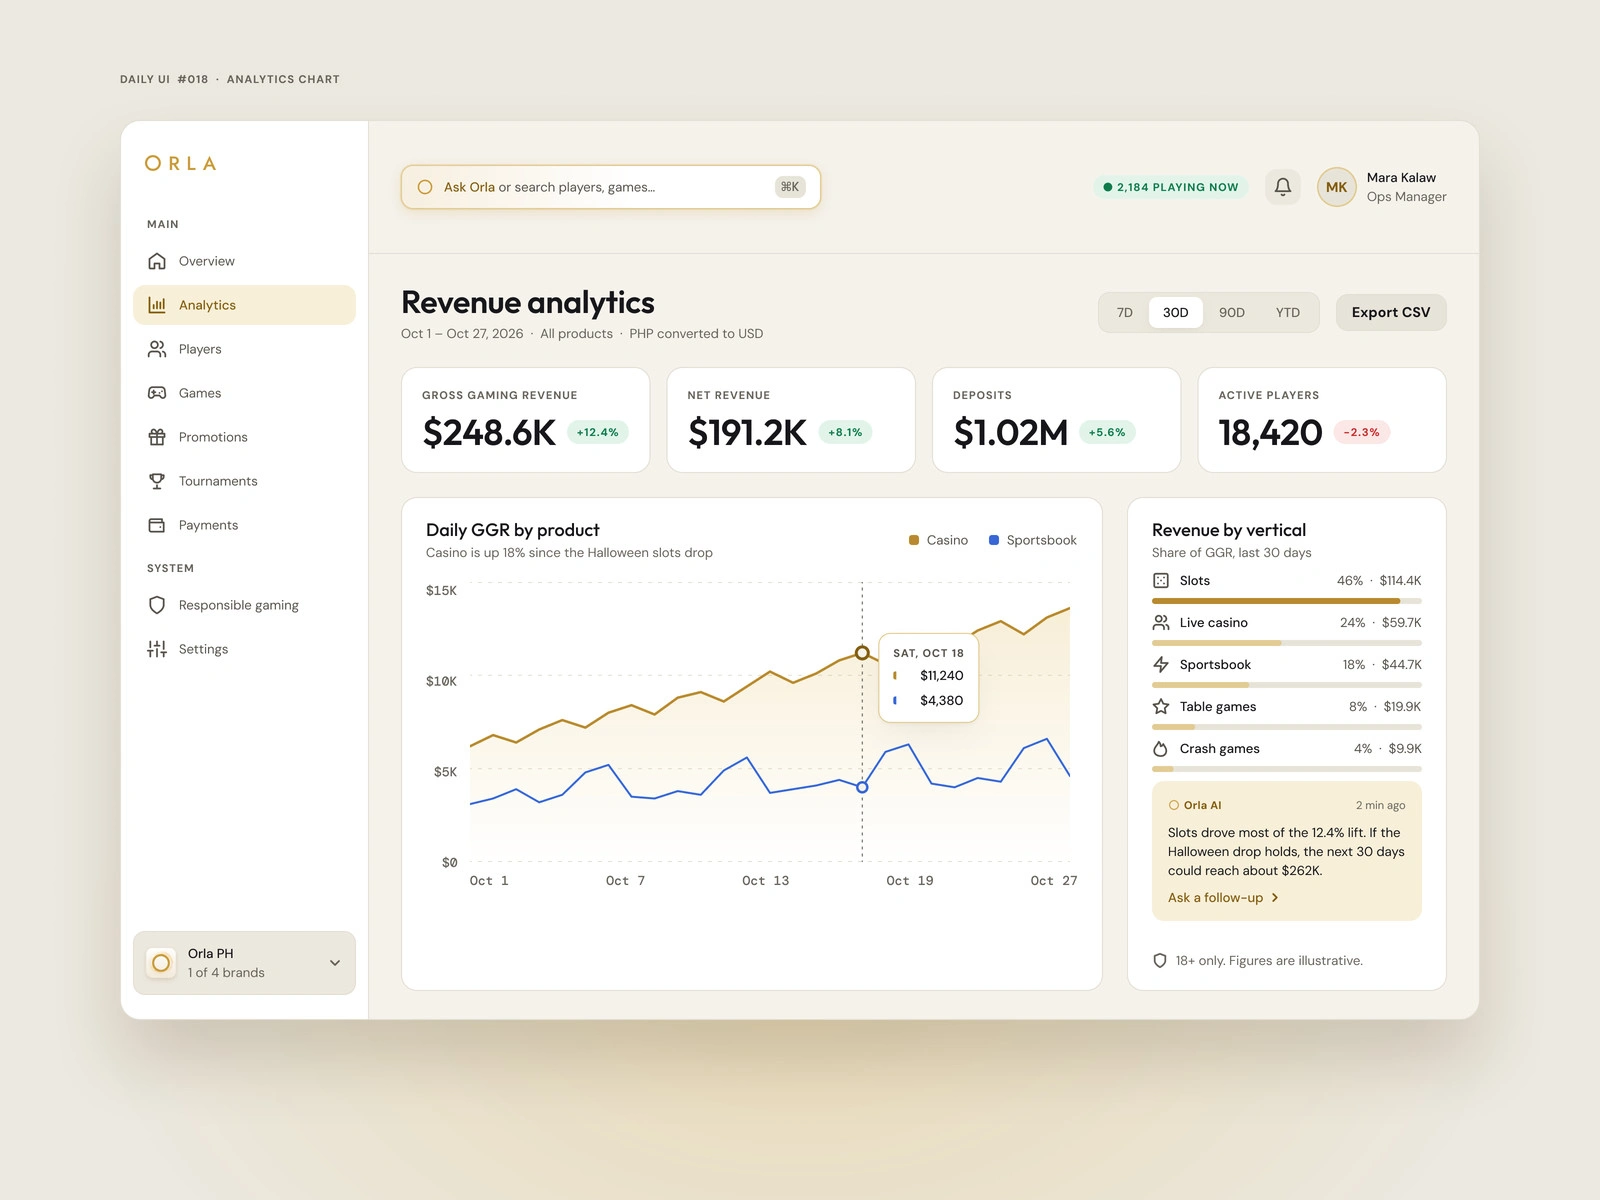
The same revenue dashboard in the light theme, with a white tooltip and gold Ask Orla search
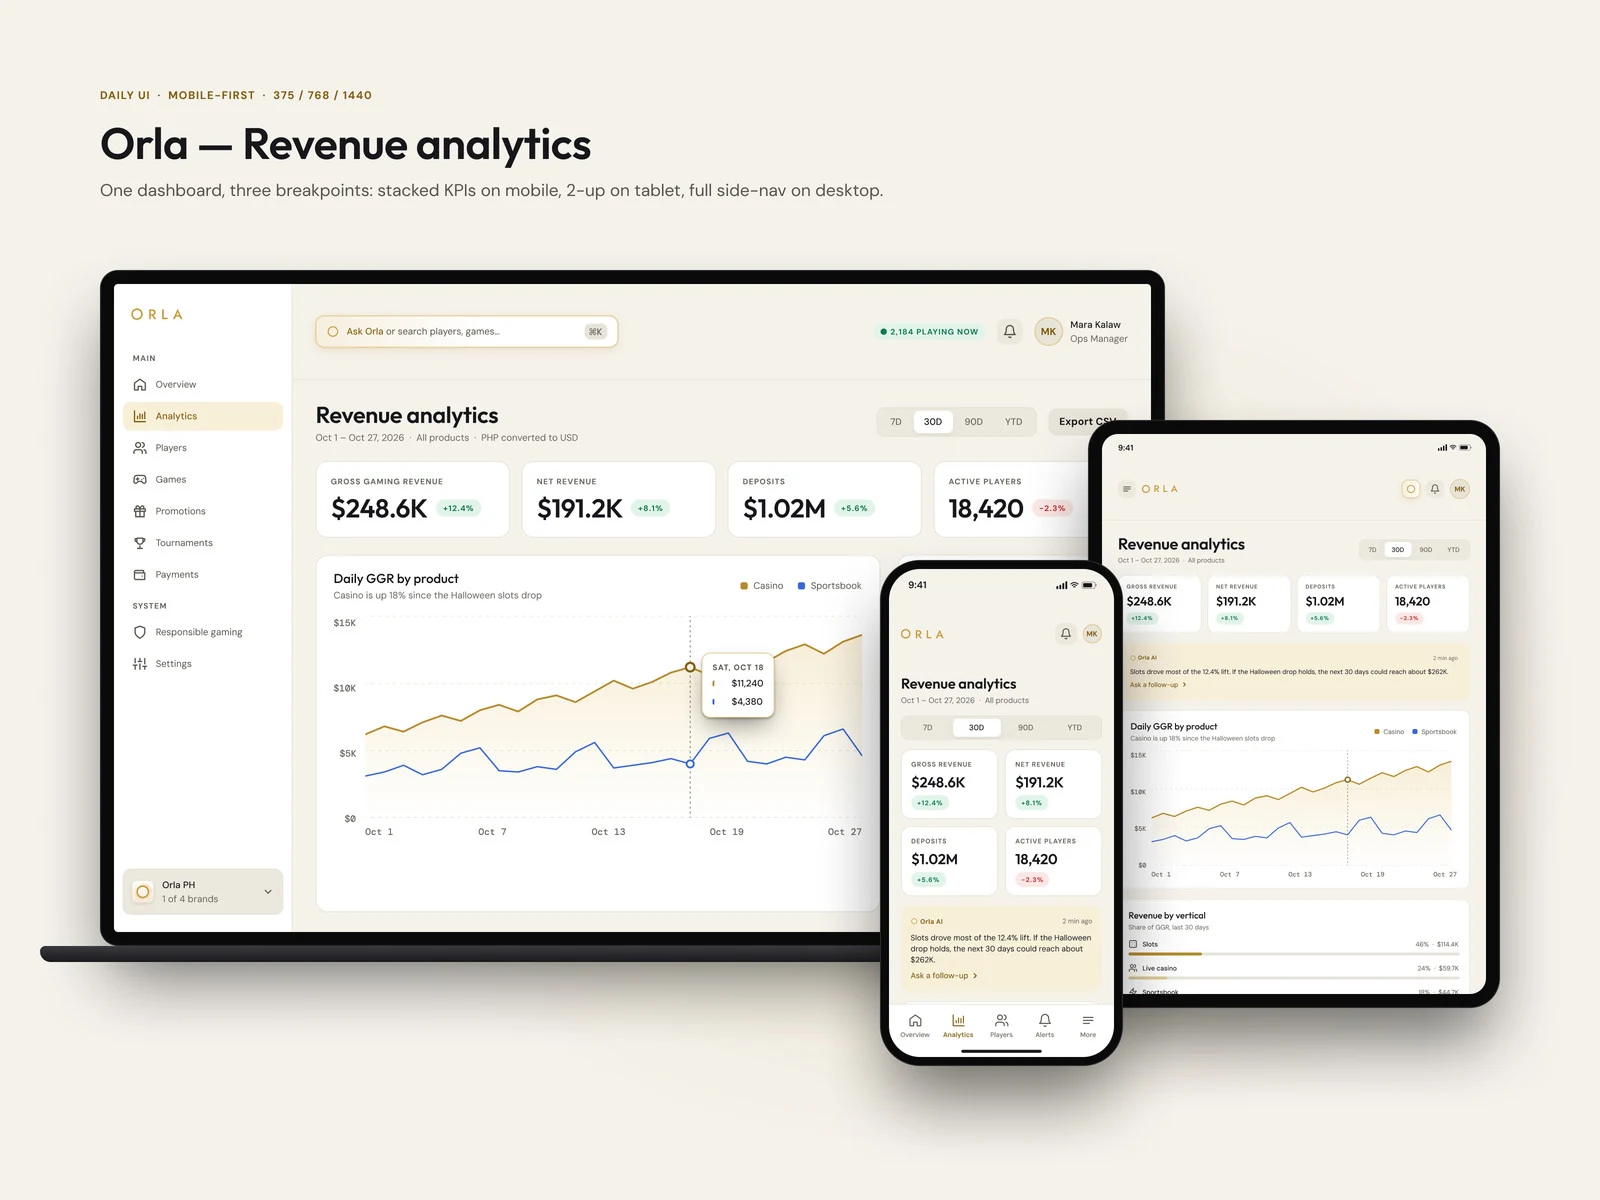
Orla revenue analytics shown on a laptop, tablet and phone in the light theme
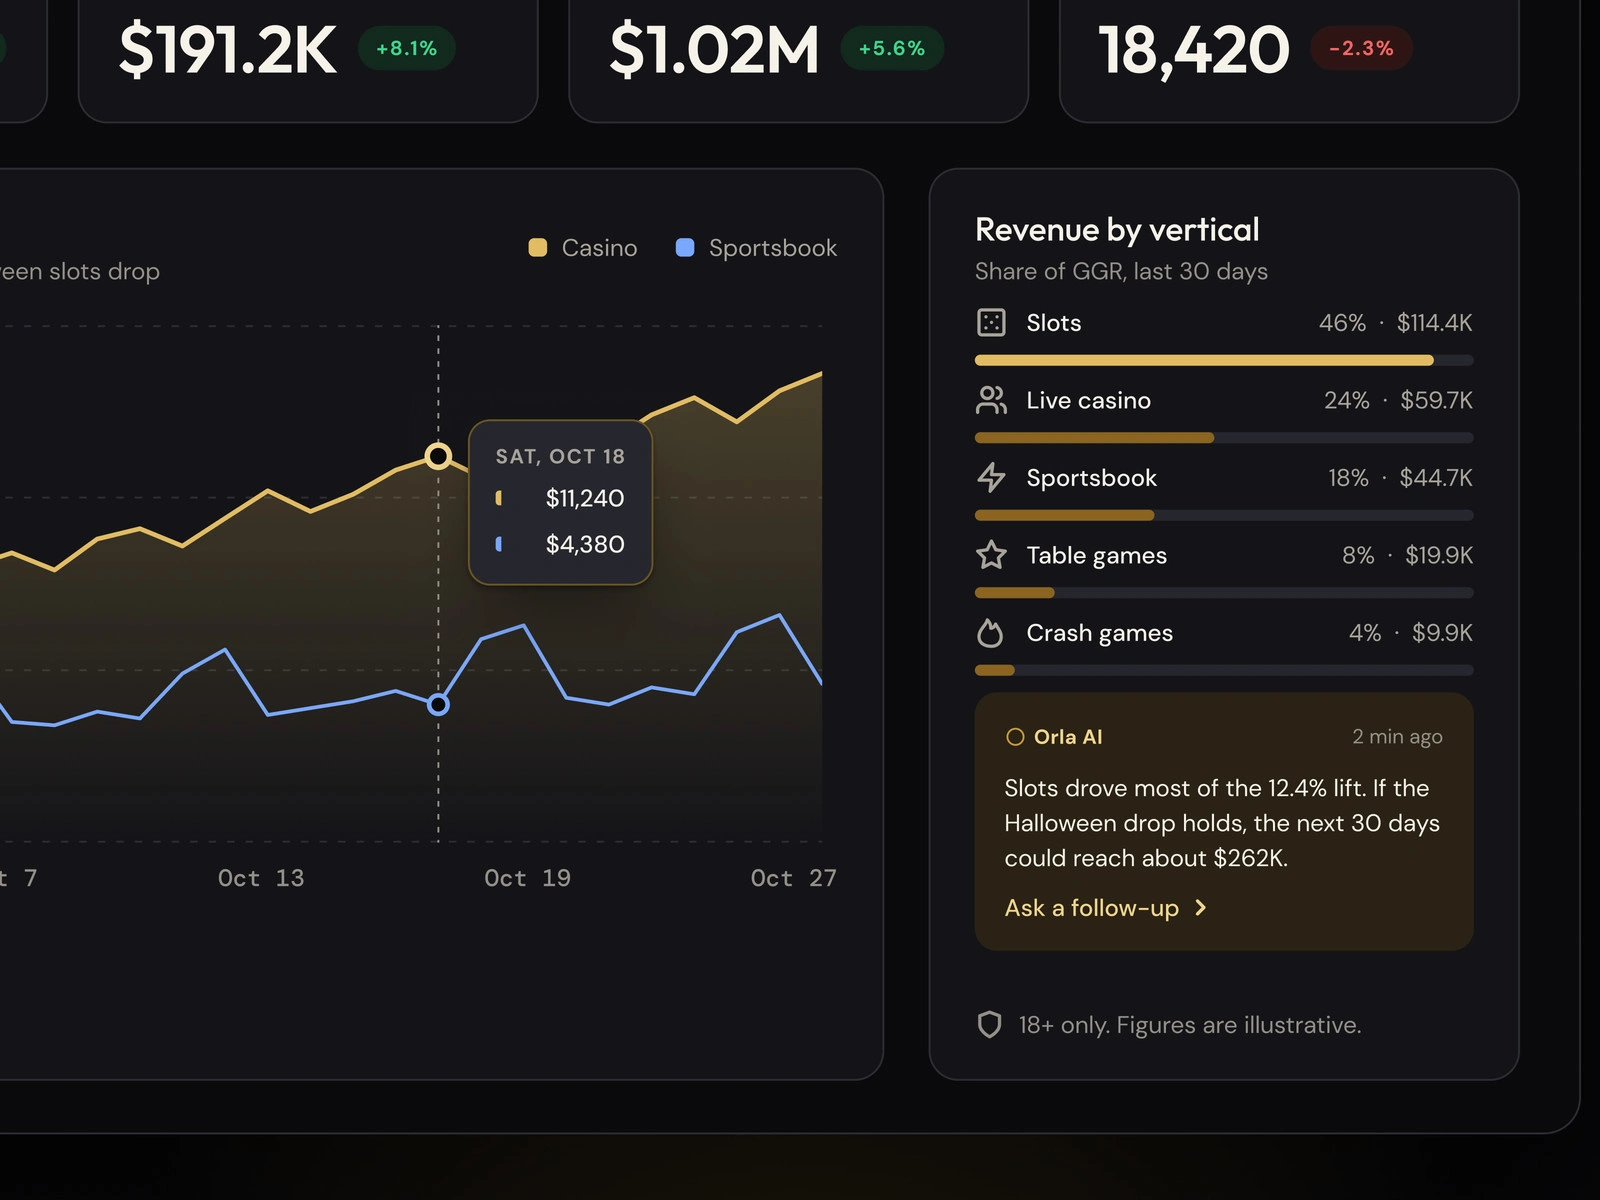
Close-up of the chart tooltip for Oct 18 and an Orla AI insight explaining the 12.4% lift
0 likes · 0 views · Nov 18, 2026
A mobile-first revenue analytics dashboard for Orla, a fictional AI-powered iGaming platform, in dark and light themes. Daily UI 018.

