usedminers - BI Dashboard Design
Like this project
Posted Nov 23, 2024
My team and I designed the brand, the website and the dashboard, helping usedminers to progress from the MVP to the final product in less than 6 months.
Likes
0
Views
9
Elevating The Brand
The first step was to elevate the redesigned brand. You take your brand with you wherever you go/appear, be it print or web. When you show up, you bring an element of personalization to your audience. By connecting with your users, your company’s brand connects with them. The content has to let people know who you are. We carefully designed all facets of usedminers, in order to evoke the brand in each and every one of them.

Landing Experience
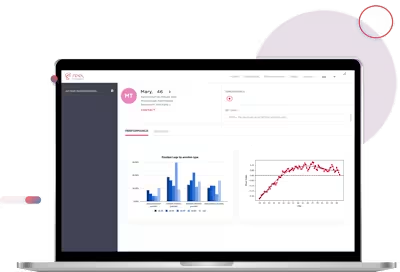
A dashboard is a multi-functional application. It’s not just a mere visualization of analytics and data. The purpose of designing a dashboard is to show users essential information while avoiding cognitive overload. The usedminers is a mix of operational and analytical dashboards. The goal is twofold: To present essential data quickly and easily and summarize and display best sense of information in compact view. We based our design on this mantra via card based design, clear typography, a robust grid structure and self-explanatory graphs.


Data Representation
We used a mixture of line charts with scroll and zoom, for measuring trends over time and tables for showing range of data and sorting of various variables. Additionally, we used a header card with the most important info-data that the user will want to check out.
Customization
Every person(a) is different and everyone should be able to customize the dashboard as they want. Users expect that the content they see will be relevant to their individual needs. So we designed a fully customizable one, having the ability to move around the widgets at will while the UI will never break up, giving you a stellar experience.


