Delivery Service Dashboard Design
Lazar J
My role. Product Designer
Project description. I designed a delivery service dashboard to optimize efficiency and user experience. The layout is clean and intuitive, featuring real-time tracking, order management, and driver assignments at a glance. Key metrics are displayed through easily digestible charts and summaries, ensuring quick decision-making. The design emphasizes clarity with a minimal color scheme and clear icons, making navigation seamless. Responsiveness was a priority, ensuring the dashboard works smoothly across devices, enhancing overall operational efficiency.
Delivery Service Dashboard Design Case Study
Project Overview
The Delivery Service Dashboard project aimed to enhance operational efficiency and user experience within a logistics and delivery service context. By designing an intuitive, responsive dashboard, the goal was to provide key stakeholders with an easy-to-use interface that offers real-time tracking, order management, and driver assignments. The result was a design that focuses on clarity, speed, and usability across all devices, improving decision-making processes and optimizing overall performance.
Problem Statement
Delivery service operations can often be complex, with multiple moving parts such as real-time tracking, order management, and driver coordination. The existing system lacked an efficient user interface, resulting in a clunky workflow, slow decision-making, and potential human errors. A dashboard that provides an organized, intuitive overview with key insights was needed to streamline the delivery process, manage orders in real time, and monitor drivers’ performance at a glance.
Objectives
The primary objectives of the dashboard design were:
Optimize Efficiency: Design a dashboard that enhances operational speed by providing real-time data and easy access to critical information.
Improve User Experience: Ensure the interface is intuitive and easy to navigate, even for non-technical users.
Streamline Decision-Making: Incorporate clear, digestible visualizations of key metrics to support fast, informed decision-making.
Ensure Responsiveness: Create a design that works seamlessly across devices, from desktops to tablets, for use in any operational environment.
Research and Insights
User Research:
Conducted interviews with delivery service managers, drivers, and customer support teams to understand their daily workflow and pain points.
Key feedback indicated that existing systems were cluttered, making it difficult to quickly access relevant data. Users wanted a more streamlined system with fewer clicks to key functions like tracking and order updates.
Competitive Analysis:
Analyzed several popular delivery management systems to identify what worked well and where improvements could be made.
Found that while many systems offered robust functionality, they often sacrificed usability, overwhelming users with too much information on a single screen.
Design Process
1. Wireframing & Prototyping:
Created low-fidelity wireframes to map out the basic structure of the dashboard. Focused on a minimal, clean layout that would allow users to focus on the most critical tasks, such as tracking orders and managing drivers.
Iterated through several design prototypes, gradually adding details and refining the layout based on user feedback and usability testing.
2. Key Design Elements:
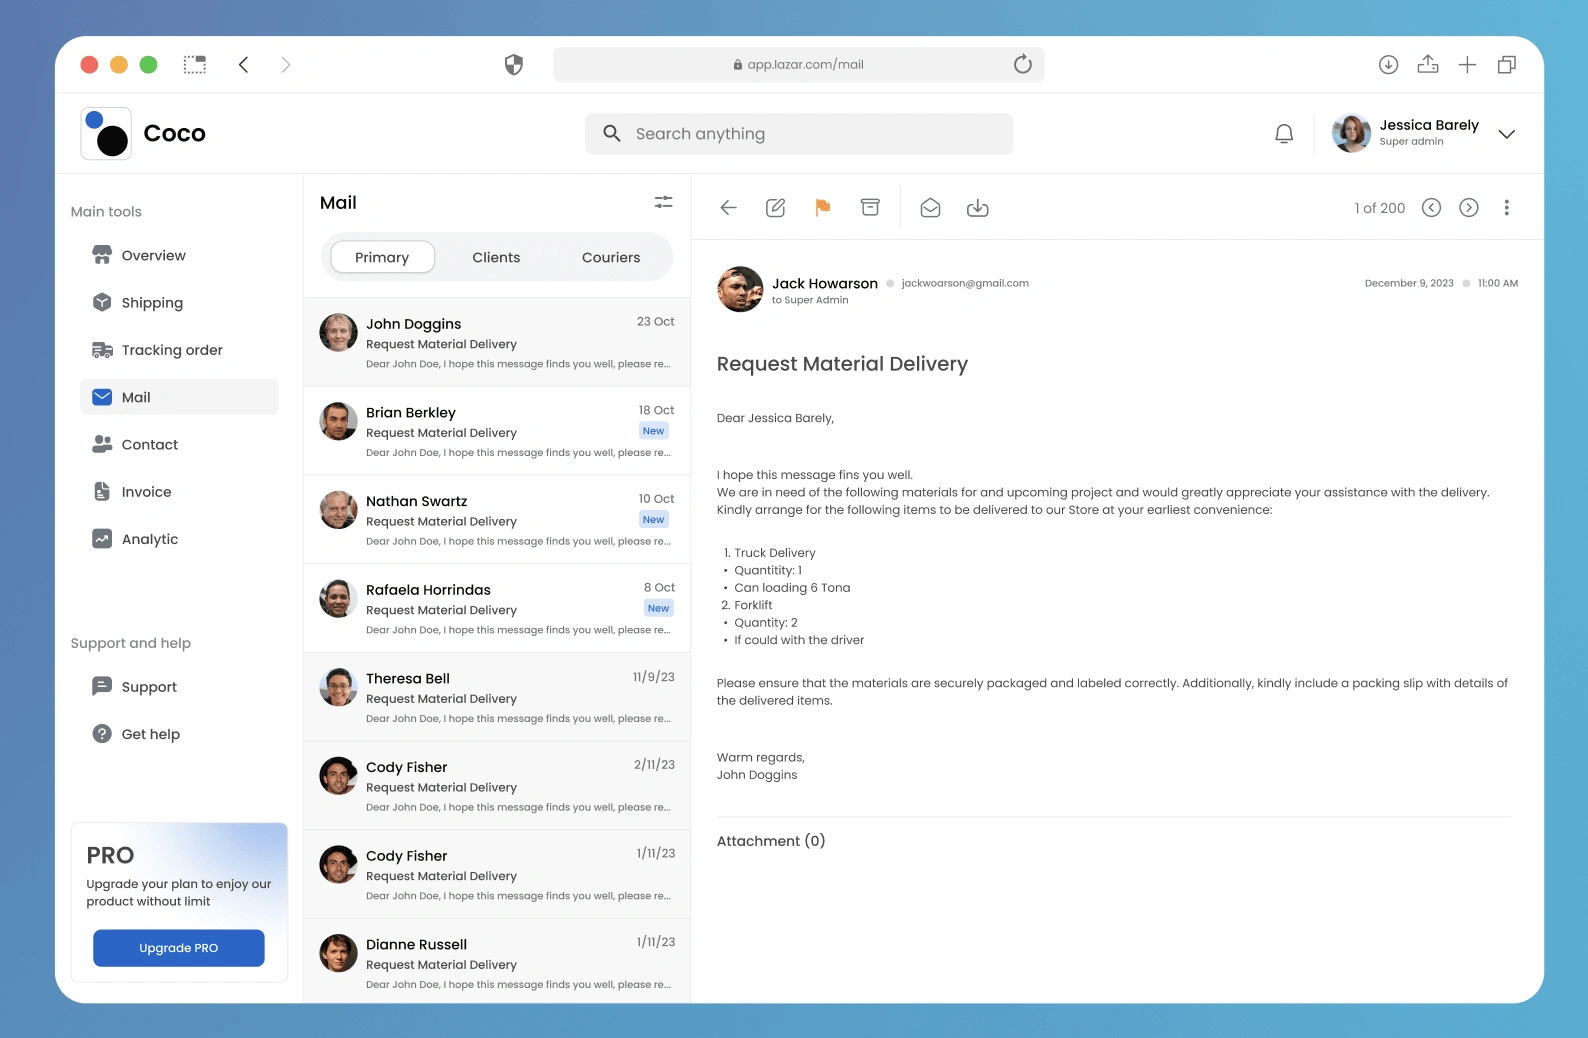
Real-Time Tracking: Implemented a section for live tracking of deliveries, using clear, bold visuals like a map view to display driver locations and delivery statuses.
Order Management: Designed an organized order list with filtering options that allow users to quickly sort by status (e.g., delivered, in progress, delayed).
Driver Assignments: Incorporated an easy-to-use interface for assigning and re-assigning drivers to orders, reducing manual work and errors.
Key Metrics and Visualizations: Added easy-to-read charts and summaries to visualize performance metrics, such as on-time deliveries and driver efficiency.
3. Usability Testing:
Conducted multiple rounds of usability testing with real users from the logistics sector.
Feedback led to adjustments in the dashboard's layout, such as repositioning key buttons, improving the color contrast for better readability, and refining the flow of the driver assignment process.
Final Design
1. Clean, Intuitive Layout:
The final design features a minimal interface with a focus on simplicity and ease of use. Users can access the most important information, like current deliveries, pending orders, and key performance metrics, with minimal navigation.
2. Real-Time Tracking:
A live map on the dashboard provides a real-time view of where deliveries are, allowing managers to monitor progress and address issues immediately.
3. Key Metrics at a Glance:
Critical data, such as delivery performance, driver efficiency, and order status, is displayed in the form of clear charts and summaries, ensuring that users can make quick, data-driven decisions.
4. Responsive Design:
The dashboard is fully responsive, ensuring that it works seamlessly across desktops, tablets, and smartphones. This flexibility allows users to access the system from any device, whether in the office or on the go.
5. Visual Clarity:
A minimal color scheme with clear icons and typography ensures that the dashboard remains clutter-free. Important data is highlighted, while less critical elements are subdued to avoid overwhelming the user.
Outcome
The redesigned Delivery Service Dashboard significantly improved operational efficiency and user satisfaction. Key benefits included:
Faster Decision-Making: Users reported a significant reduction in the time needed to manage and track orders due to the dashboard’s clear, digestible interface.
Increased Efficiency: The streamlined driver assignment and real-time tracking features reduced manual processes, minimizing human error.
Improved Responsiveness: The dashboard’s ability to function smoothly across devices allowed teams to access and manage operations from anywhere, enhancing overall workflow flexibility.
Like this project
Posted Aug 24, 2024
Designed a responsive delivery dashboard with real-time tracking, intuitive management, and clear metrics."
Likes
1
Views
27