Optimizing CI Deployment Efficiency by Terraform Parallelism

Muhammad Indrawan

Finding it meant ignoring the median — and controlling for the thing that made my first comparison lie.
Our worst infrastructure deploy took 71 minutes. One that got cancelled had already been running for 104.
The fix was a single flag. Finding it was the interesting part — and the first thing I had to do was stop looking at the average.
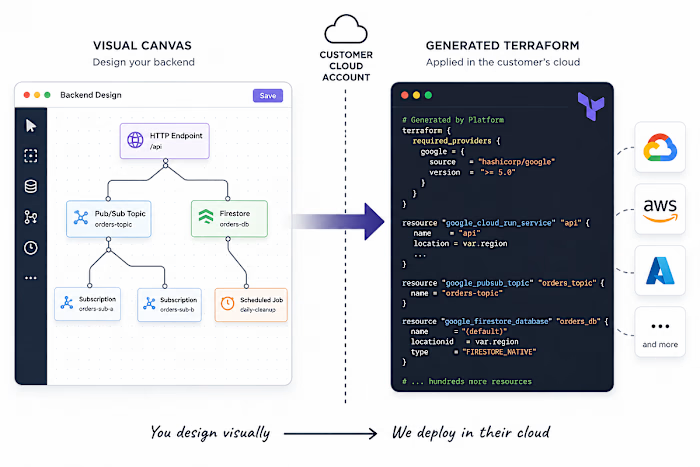
This is the second post in a series. The first covers the platform’s architecture — an internal developer platform that generates Terraform and applies it into the customer’s own cloud account. You don’t need it to follow this one.
The workload is not the Terraform you’re used to
I work on a platform that generates infrastructure from a visual designer. A user models their services on a canvas; the platform emits Terraform and applies it to the customer’s own cloud project. Every deploy runs as a CI job against a generated
main.tf.The important detail is that nobody writes this Terraform by hand. The largest tenant’s file is 10,000+ lines and 613 resources, all in one root module and one state file:
Hold that shape in mind. It matters more than the count does.
The symptom
Deploys had been getting slower for months, but “slower” was doing a lot of work in that sentence. Nobody had a number — just a shared sense that the big tenants were painful.
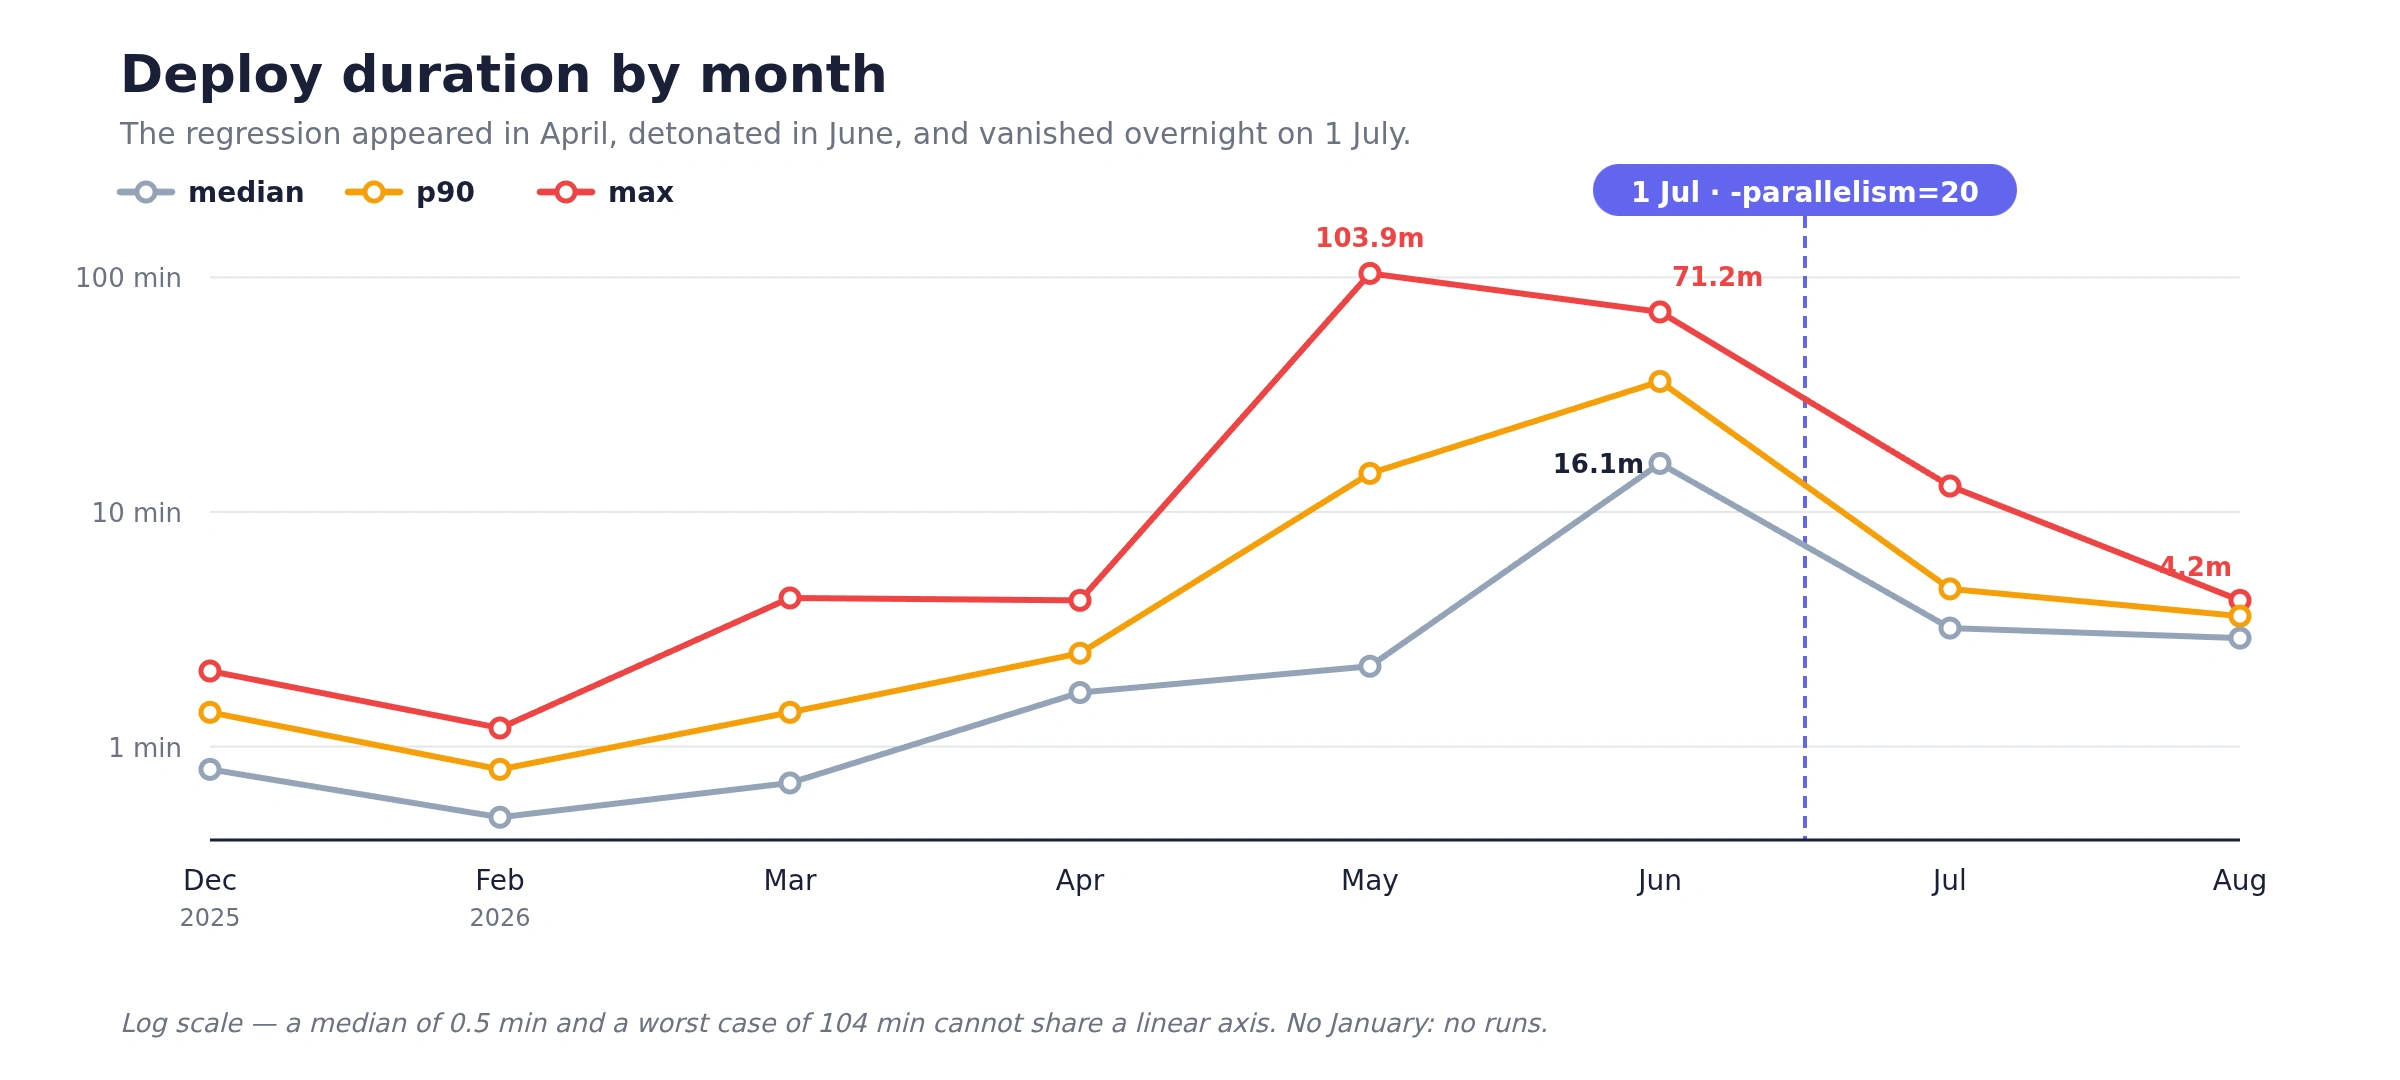
So I pulled every run from the CI history — 885 runs since December — and computed each one’s duration from its start and completion timestamps.
Two things jump out, and the second one is the lesson.
First: this was a regression, not a chronic condition. From December to March, deploys ran in well under a minute. The degradation appeared in April and detonated in June. Any story that starts “deploys have always been slow” would have been wrong — and would have sent me looking in entirely the wrong place.
Second: the median never told the truth. Even at the worst of it, plenty of deploys finished in a couple of minutes — small tenants, small graphs. The pain was concentrated in the tail, on exactly the customers who mattered most. 10.3% of all runs exceeded five minutes, and nearly all of them landed inside a two-month window.
If you monitor mean or median build time, this regression is close to invisible until someone complains.
The investigation
The month view told me when, not why — and it was confounded. Different tenants have wildly different graph sizes, and June happened to be heavy on the largest one. A month-over-month comparison could easily be measuring tenant mix rather than performance.
So I did three things, in order.
1. Found the transition boundary. Bucketing by day instead of month narrowed it to a single overnight change:
That is not a trend. That is a switch being flipped.
2. Read the commits in that window. Almost all of them were machine-generated — the platform commits its own Terraform, so the history is mostly “Update terraform script by …”. Exactly one was written by a human:
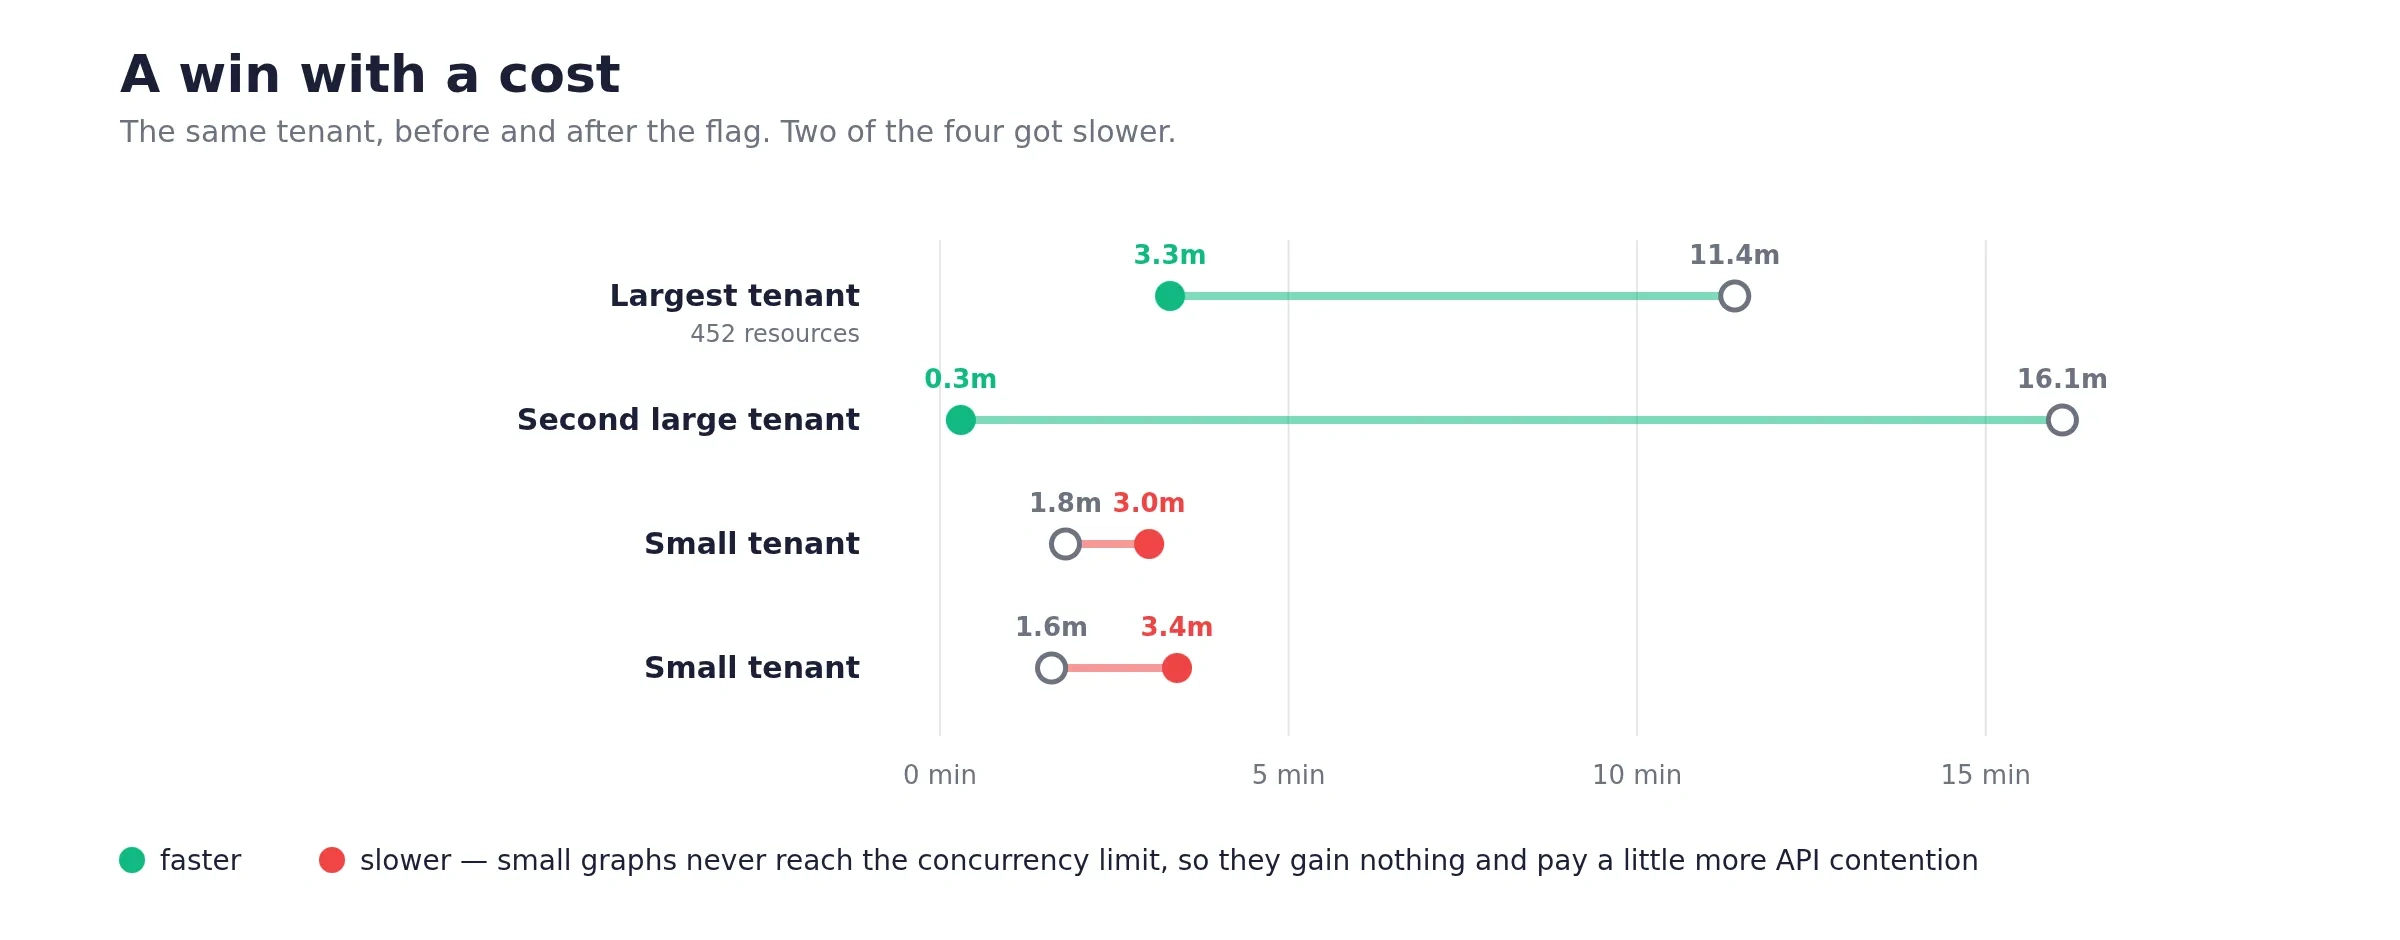
3. Controlled for tenant. This is the step that turns a correlation into an argument. Rather than comparing months, I compared the same tenant before and after the commit:
And the 40 runs immediately either side of the commit, in time order:
There it is. The median barely moved — 3.3 to 3.0 minutes. The p90 fell from 49 minutes to 5.
If I had reported the median, I would have concluded the change did nothing.
The fix
Terraform defaults to
-parallelism=10: it walks the dependency graph ten nodes at a time. The change doubled it. That's the whole fix.Why it worked so well here
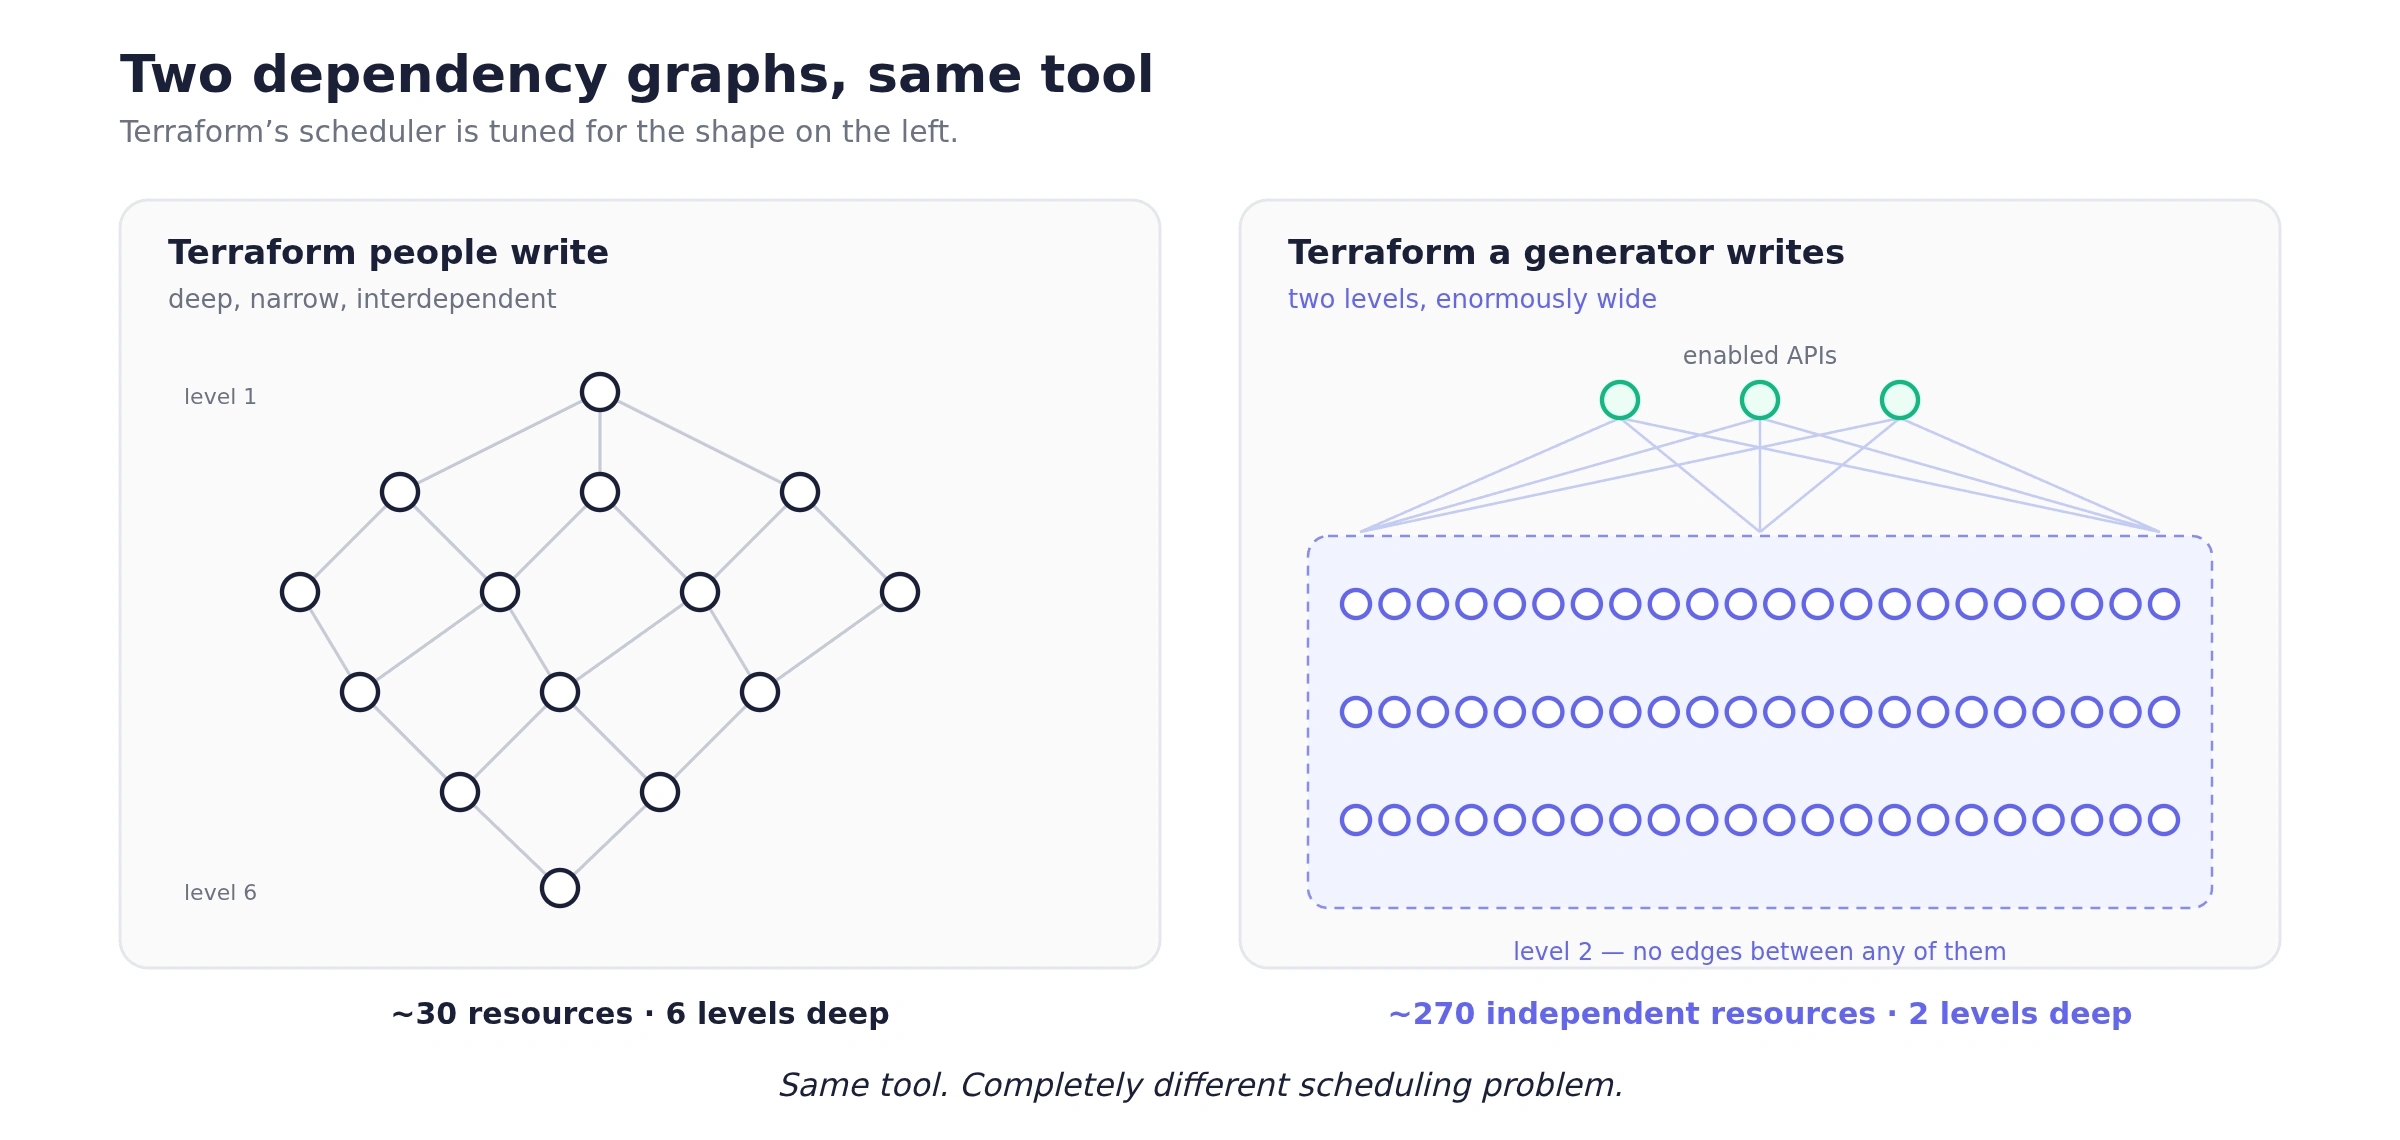
Go back to that resource table. This graph is wide and shallow:
131 Cloud Run services depend on nothing but the enabled APIs — and nothing depends on them.
77 Pub/Sub topics and 60 schemas are likewise independent.
The 216 IAM members each depend on exactly one topic or subscription.
The true critical path is about two levels deep. Nearly 270 resources could in principle be created simultaneously. The only thing serialising them was the concurrency limit.
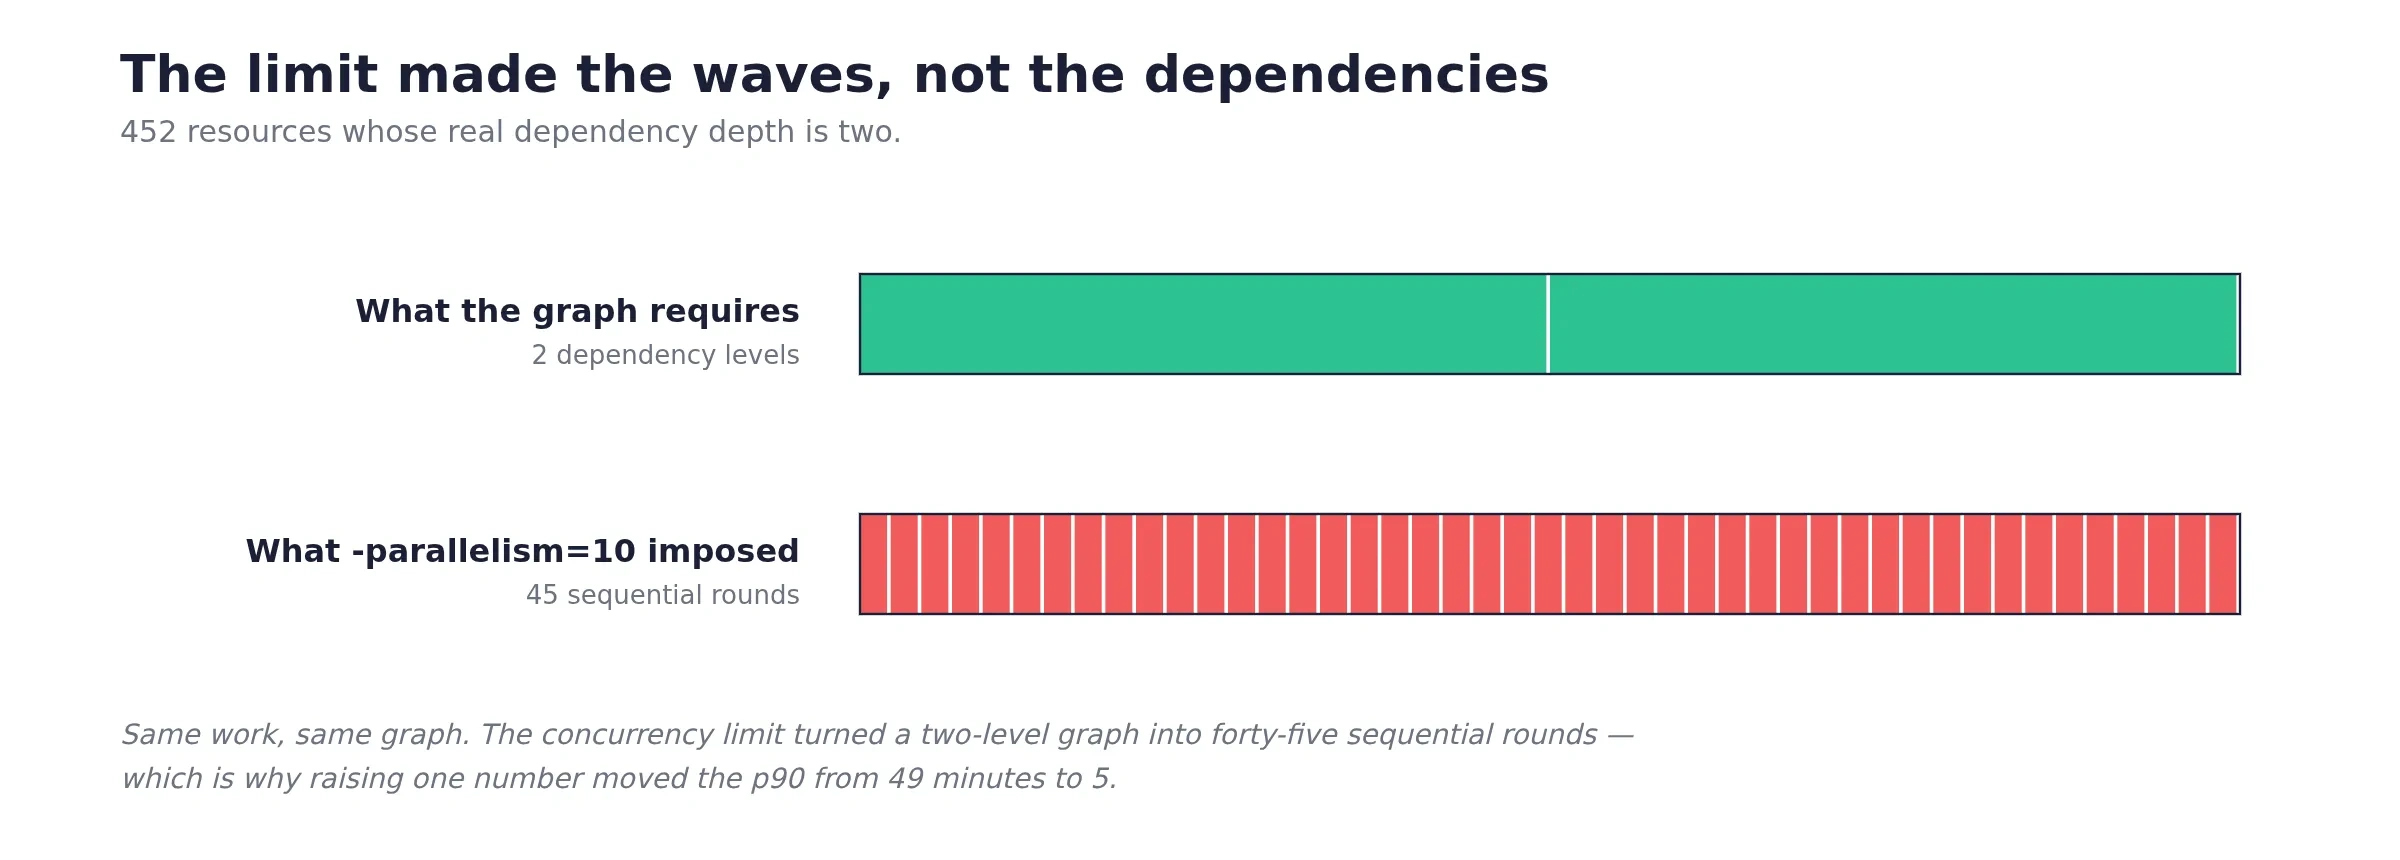
The arithmetic is blunt. At 452 resources and 71 minutes, that’s ~9.4 seconds per resource — about what a Cloud Run service creation costs while you poll for the new revision to become ready. With a concurrency limit of 10, you are pushing roughly 45 sequential waves through a graph whose real depth is 2.
Terraform’s default of 10 is a sensible choice for the Terraform most people write: a few dozen resources with meaningful interdependencies, run from a laptop, against provider APIs you would rather not hammer. It is not tuned for a machine-generated 600-resource graph of independent microservices.
Nobody chose it badly. The workload simply moved out from under the default — which is the failure mode worth internalising here, because defaults don’t announce that they’ve stopped fitting you.
What I’d take from this
Instrument the percentile that matches the complaint. Nobody files a ticket about the median. This was a p90 problem, and the p90 sat at 10x the median for two months before anyone chased it.
Control for workload before claiming a win. My first before/after comparison mixed tenants together and made the improvement look like noise. Same-tenant comparison is what made the case defensible — and it was also what surfaced the awkward result below.
Faster on average is not faster for everyone. Two small tenants got measurably slower — 1.6 to 3.4 minutes. Small graphs never touch the concurrency limit, so extra parallelism buys them nothing and costs a little more API contention. That is an acceptable trade when the alternative is a 71-minute worst case. But it belongs in the write-up, not swept under it.
Beware numbers that sound like measurements. While digging, I found a code-review thread proposing a timeout on the Terraform command — thirty minutes, picked as a provisional ceiling. That is almost certainly where the “deploys take 30 minutes” figure that circulated in conversation originally came from. It was a guardrail somebody chose, not a duration anybody had observed. The real number happened to land in the same range, which is the worst possible outcome: it made the folklore look confirmed.
Where it stands
The largest tenant has since grown from 452 to 613 resources — up 36% — and still applies in about three minutes.
There is headroom left. At
-parallelism=20, 613 resources is still roughly 31 sequential waves through a two-deep graph. But the binding constraint moves once you go further, and it moves in two directions at once:Provider API quotas and rate limits, rather than Terraform’s scheduler.
Read-modify-write on shared policy objects. Most of the IAM in this graph is scoped to one topic or one subscription, so those 216 resources do not contend with each other at all. Project-level bindings are the exception: they mutate a single policy object, and that is a read-modify-write at the API layer however cleanly Terraform models them as separate resources. There are only a handful in this graph today, which is very likely the only reason raising parallelism has not bitten yet.
Which makes the next step a measure-don’t-guess situation — and the 613-resource graph is the right thing to measure it against.
Reproducing this analysis
Nothing here needed special tooling. The CI API exposes
run_started_at and updated_at on every run; duration is the difference. The steps:Page through the full run history via the CI API and compute per-run durations.
Bucket by month, and report median, p90 and max — not the mean.
Bucket by day around any step change to find the boundary.
List the commits in that window, and separate the human ones from the automated ones.
Recompute the before/after split grouped by workload, not by calendar.
Confirm the mechanism by reading the diff — and by checking that the graph’s shape actually explains the size of the gain.
Step 5 is the one people skip, and it is the one that decides whether you have found a cause or a coincidence.
Next in this series: making Terraform state loss survivable, and what happened when a bulk inventory API quietly refused to admit that two resource types existed.
Like this project
Posted Aug 6, 2026
Optimized CI deployments by doubling Terraform parallelism, reducing maximum deploy times.
Likes
0
Views
3