GoodCabs Data Analysis and Dashboard

Amit Chejara


Data-Driven Success: Enhancing GoodCabs Operations with Insights and Innovation

In today’s competitive ride-hailing market, data is not just an asset — it’s a driving force for strategic decision-making. This is particularly true for GoodCabs, a cab service company committed to empowering local drivers and delivering exceptional customer experiences. With support from data provided by Code Basics, I embarked on a comprehensive analysis and visualization project, transforming raw data into actionable insights.
Project Overview
This project aimed to analyze GoodCabs operational and customer data to identify patterns and opportunities that enhance efficiency, customer satisfaction, and revenue. The analysis leveraged advanced tools like Power BI and SQL to create an interactive dashboard that highlights key metrics and trends, providing stakeholders with a clear path forward.
The project was guided by several business questions, focusing on optimizing trip patterns, understanding passenger behavior, and aligning strategies with revenue goals. Additionally, ad-hoc business requests were addressed using SQL queries, further enriching the insights.
Key Metrics and Findings
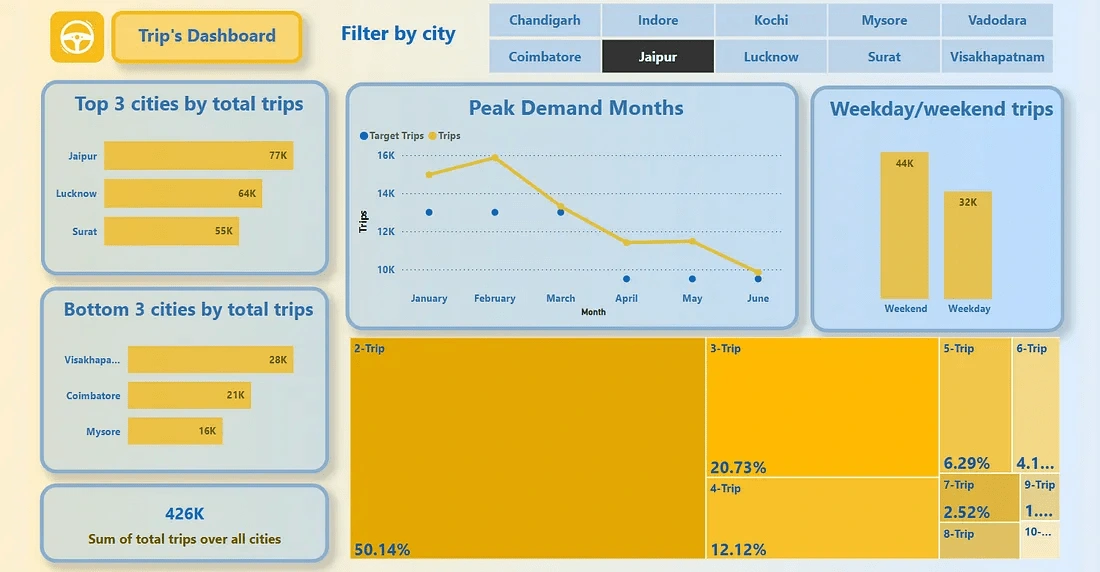
1. Trip Analysis
Business-focused cities, such as Surat and Vadodara, see peak demand from March to May, driven by corporate activities. These cities experience higher weekday trip volumes, with a notable increase in repeat trips. Tourism-focused cities like Jaipur and Chandigarh thrive in February, aligning with festivals and cooler weather. Weekends dominate trip volumes in these regions, underscoring the leisure-driven nature of the demand.
Key Metrics:
Total annual trips: 426K
Peak demand months by city: Business (March-May), Tourism (February)
Total Distance: 8M Km
Average trip distance: 19.13 Km
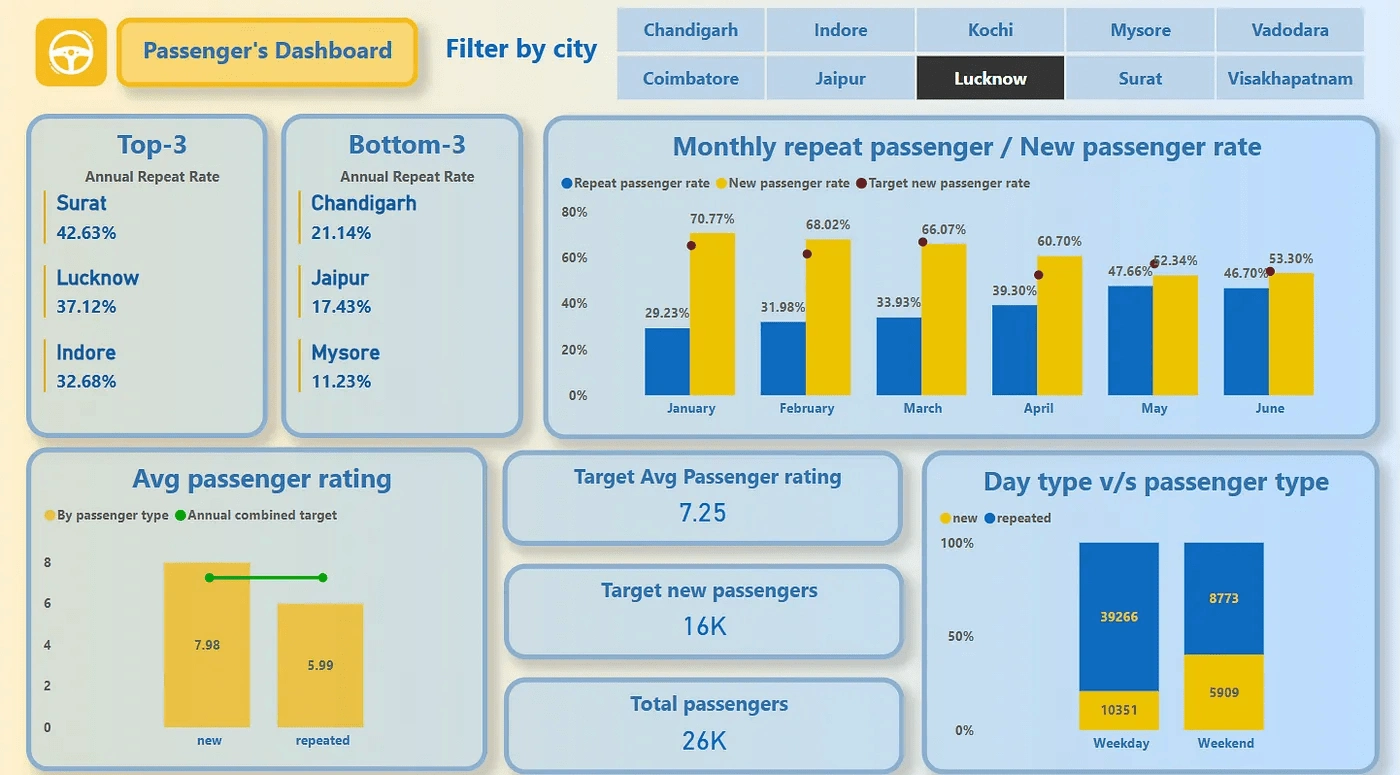
2. Passenger Behavior
Passenger behavior varies significantly between business and tourism cities. In Vadodara, 19% of repeat trips come from six-trip passengers, demonstrating strong customer loyalty. Conversely, tourism cities report a 50% repeat rate for two-trip passengers, reflecting short-term engagement linked to tourist activities.
Key Metrics:
Repeat passenger rate: 25.73%
New passenger rate: 74.27%
Avg passenger rating: 7.66
Total passengers: 238K
Total new passengers: 177K
Total repeat passengers: 61K
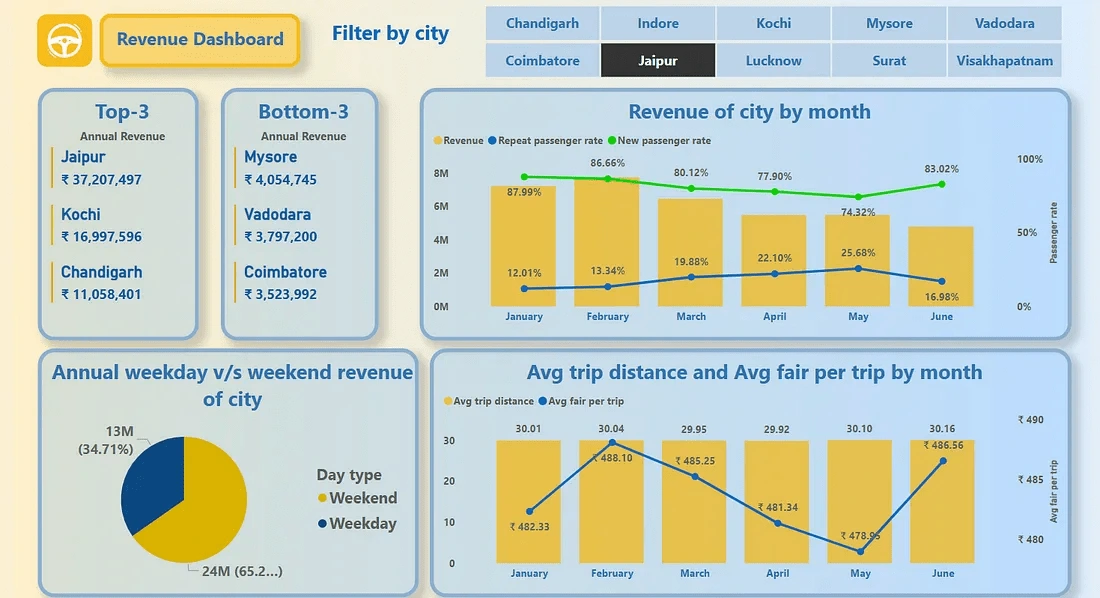
3. Revenue Insights
Revenue trends show that business-focused cities achieve peak performance during weekdays, while weekends dominate in tourism hubs. Dynamic pricing strategies during high-demand periods resulted in an 18% increase in revenue.
Key Metrics:
Total revenue: 108M
Average trip cost: 254.02
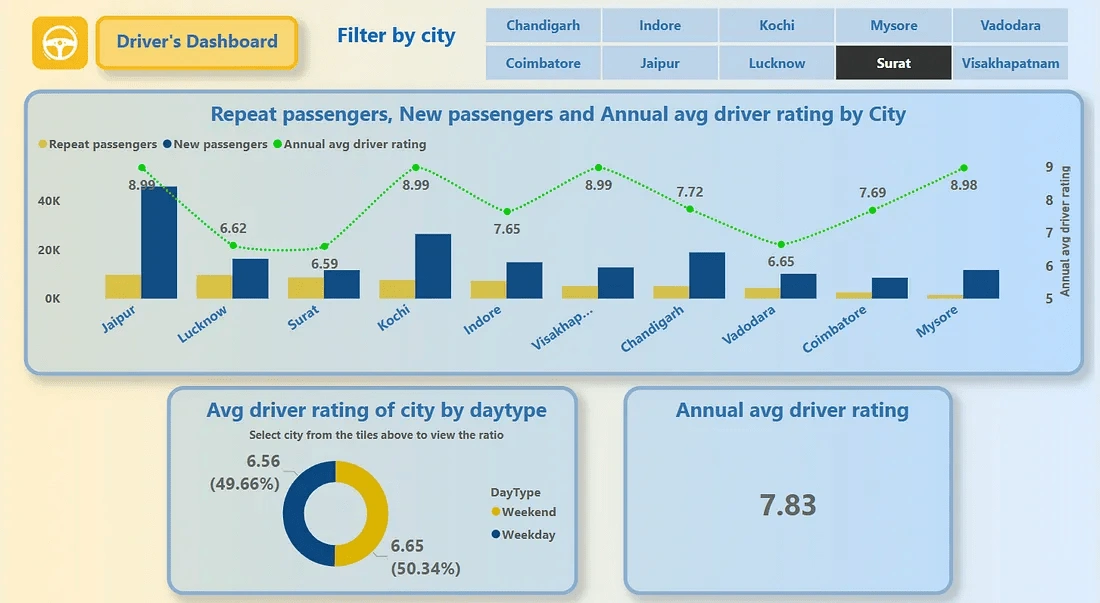
4. Driver Performance
Driver ratings in tourism cities are higher compared to business hubs, reflecting better service quality in leisure-driven markets.
Key Metrics:
Average driver rating: 7.83
Business Requests
The project also addressed several ad-hoc business requests using SQL queries, delivering targeted insights:
Request 1: Identify top and bottom cities by total trips monthly.
Solution: A SQL query aggregated trip counts by city and month, sorting results to highlight top and bottom performers.
Request 2: Find peak and low-demand months by city.
Solution: SQL was used to group data by city and month, revealing seasonal demand patterns.
Request 3: Determine the highest revenue month for each city.
Solution: SQL identified monthly revenue peaks by grouping city and month, followed by a max aggregation for each city.
Request 4: Analyze passenger types and categorize cities.
Solution: SQL was used to calculate percentages of new and repeat passengers by city, categorizing cities into “top” and “bottom” based on performance.
Request 5: Evaluate monthly performance against targets.
Solution: SQL joined trip data with monthly targets to calculate variances and identify overperforming and underperforming cities.
These targeted analyses provided quick, data-backed answers to specific business questions, demonstrating the versatility of SQL in complementing visualization tools.
Strategic Recommendations
To address these findings, we proposed several targeted strategies:
Strategic Pricing Adjustments: Implement slight price hikes in business hubs to leverage repeat-trip loyalty and introduce discounts during peak tourism months to attract new customers.
Targeted Partnerships: Collaborate with hotels and restaurants in tourism-heavy cities and form corporate partnerships in business hubs to enhance both customer experience and demand.
Driver Training and Incentives: Focus on improving service quality in business hubs through training programs and incentivize high-performing drivers in tourism cities.
EV Transition: Leverage Gujarat’s EV policies to integrate electric vehicles into GoodCabs’ fleet and deploy charging stations near high-demand zones.
Interactive Dashboard and Future Outlook
The interactive dashboard, developed in Power BI, serves as a central tool for visualizing these insights. Stakeholders can explore trends dynamically, such as seasonal demand shifts, revenue patterns, and passenger behaviors.
Looking ahead, GoodCabs can enhance its data collection to include real-time feedback and AI-driven demand forecasts. These measures will enable the company to adapt quickly to market changes and improve operational efficiency. Moreover, tapping into eco-tourism and corporate sustainability trends will open new growth opportunities, ensuring that GoodCabs remains a competitive and innovative leader in the mobility sector.
Acknowledgment
This project was made possible through the rich dataset provided by Code Basics. Their commitment to fostering data literacy and real-world problem-solving has been instrumental in shaping this analysis.
Contact
For questions or suggestions, reach out to:
[Amit Subhash Chejara]: [amitsubhashchejara@gmail.com]
LinkedIn: [https://www.linkedin.com/in/amitsubhashchejara/]
My Website: [https://amitsubhashchejara.github.io/mywebsite/]
Like this project
Posted Jan 6, 2025
Delivered actionable insights to GoodCabs, including strategies tied to an 18% revenue surge and EV adoption plans, showcased through an interactive dashboard.