Data Modelling and Visualization
Man Ip
My client is highly proficient in analyzing business data and providing insights on trends and actions. However, the management team often feels overwhelmed by large tables and extensive numerical data. To address this, the client aims to develop a meaningful dashboard that effectively visualizes key findings and recommendations. In this project, I assisted in optimizing data sources and applying data modeling techniques to serve as the foundation for a well-structured, insightful dashboard.
Data Modeling
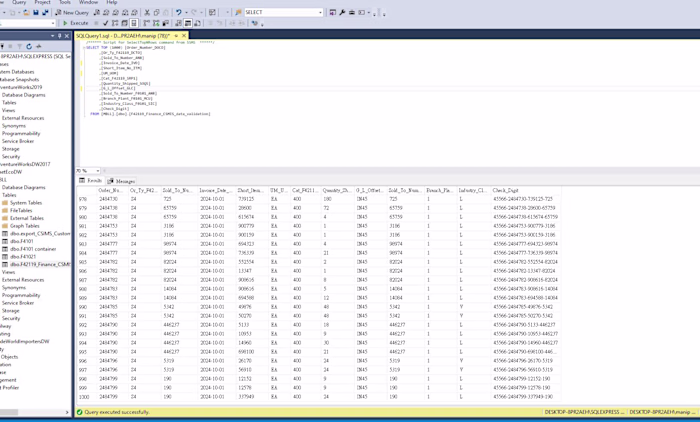
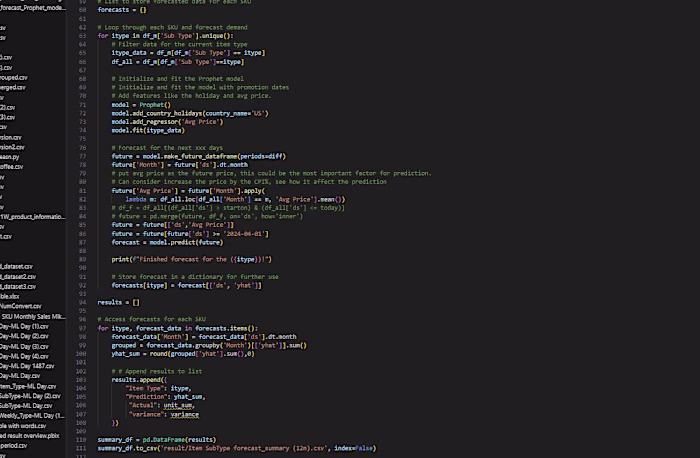
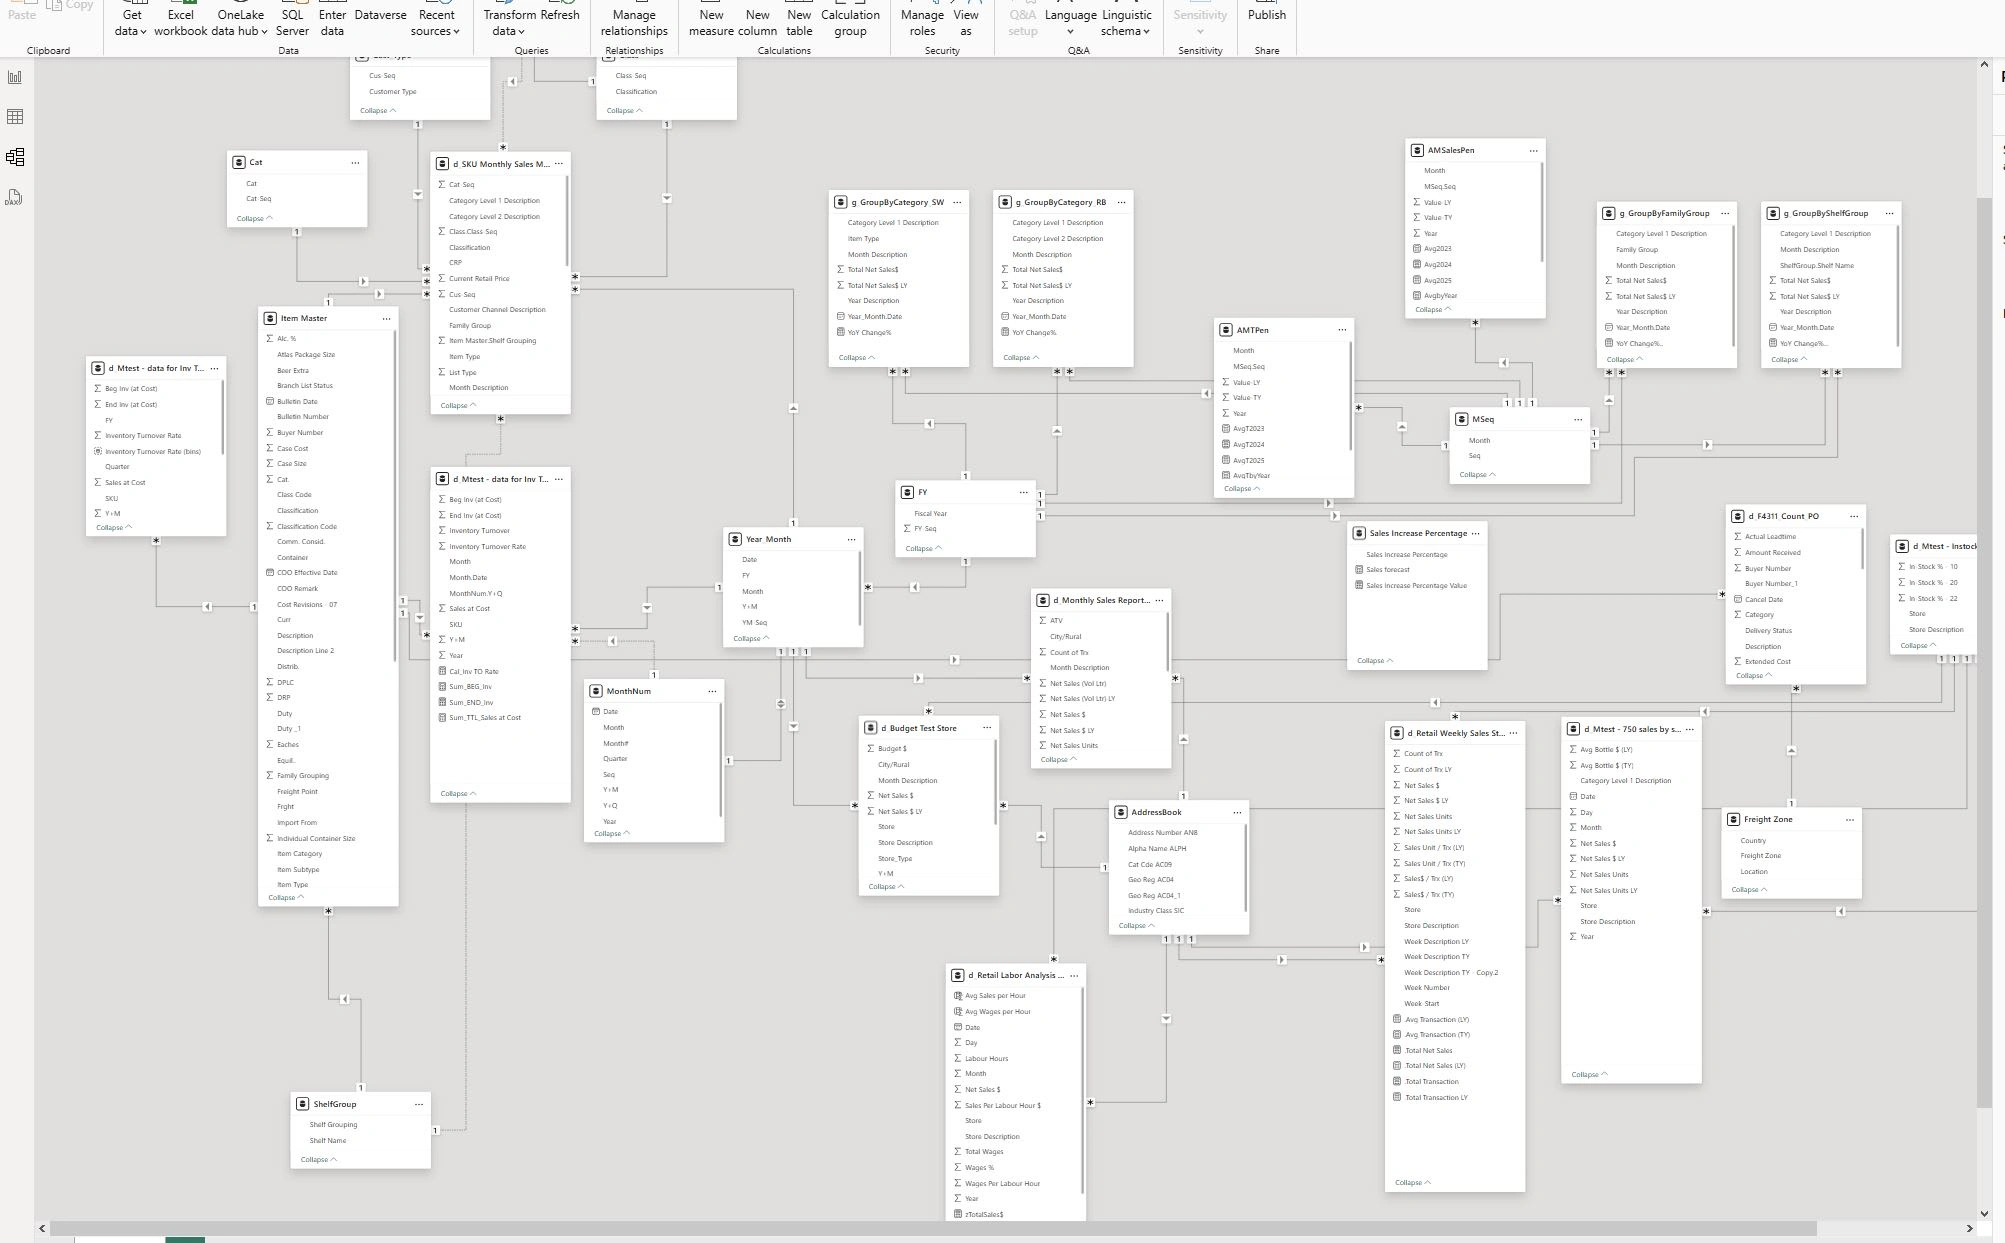
Data modeling is the process of organizing raw data from multiple sources into a structured format that supports efficient analysis and reporting. It involves defining relationships between data sets, ensuring data integrity, and optimizing performance. Techniques like normalization, aggregation, and indexing are applied to transform complex data into a more accessible form.
In Power BI, data modeling is a core function that serves as the foundation for interactive dashboards. A well-designed data model ensures that data is accurate, consistent, and easily query-able. It helps eliminate redundancy, improves performance, and allows for seamless integration of various data sources. By defining key metrics, hierarchies, and calculations, data modeling enables the creation of dynamic dashboards that present trends and insights clearly. This allows management to make informed decisions without being overwhelmed by raw data, offering a visual and intuitive understanding of key business factors.
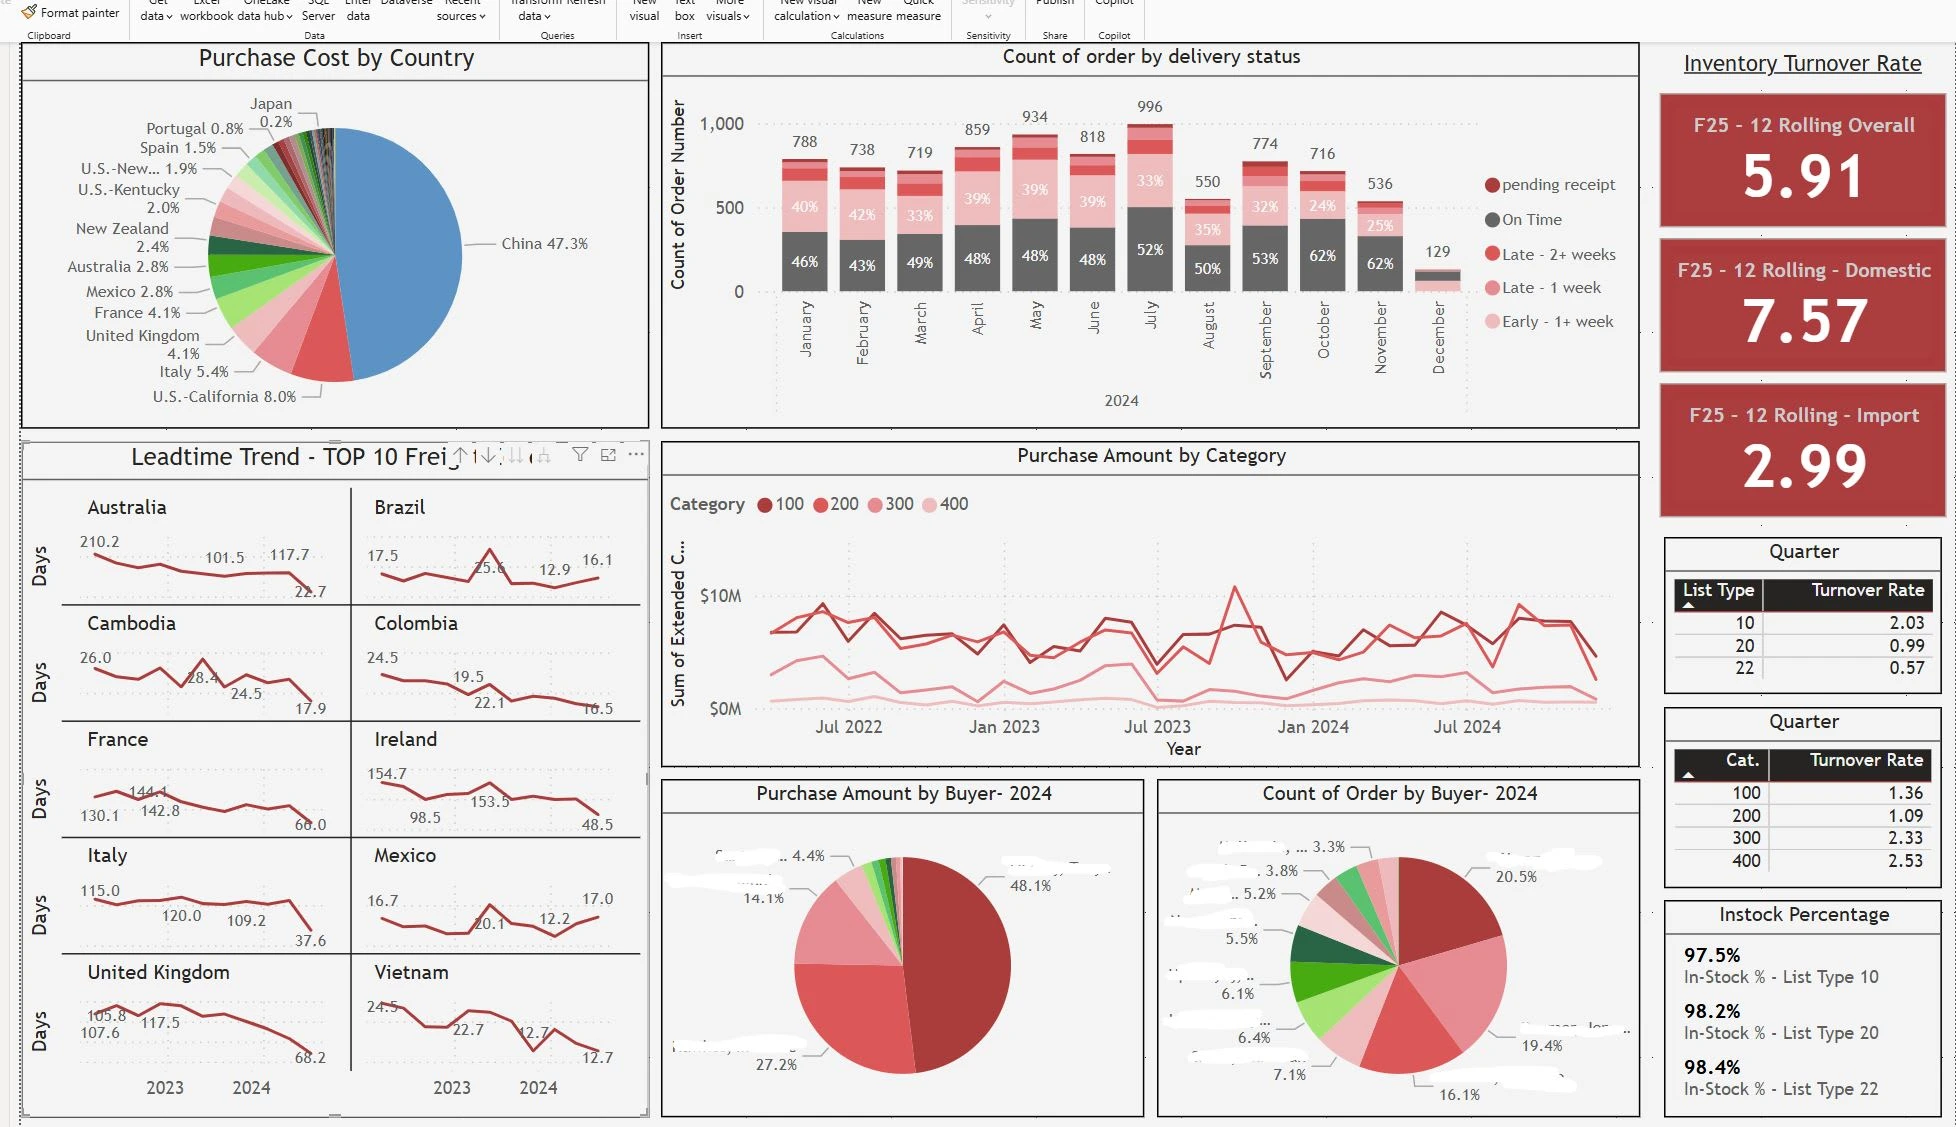
Dashboard Development
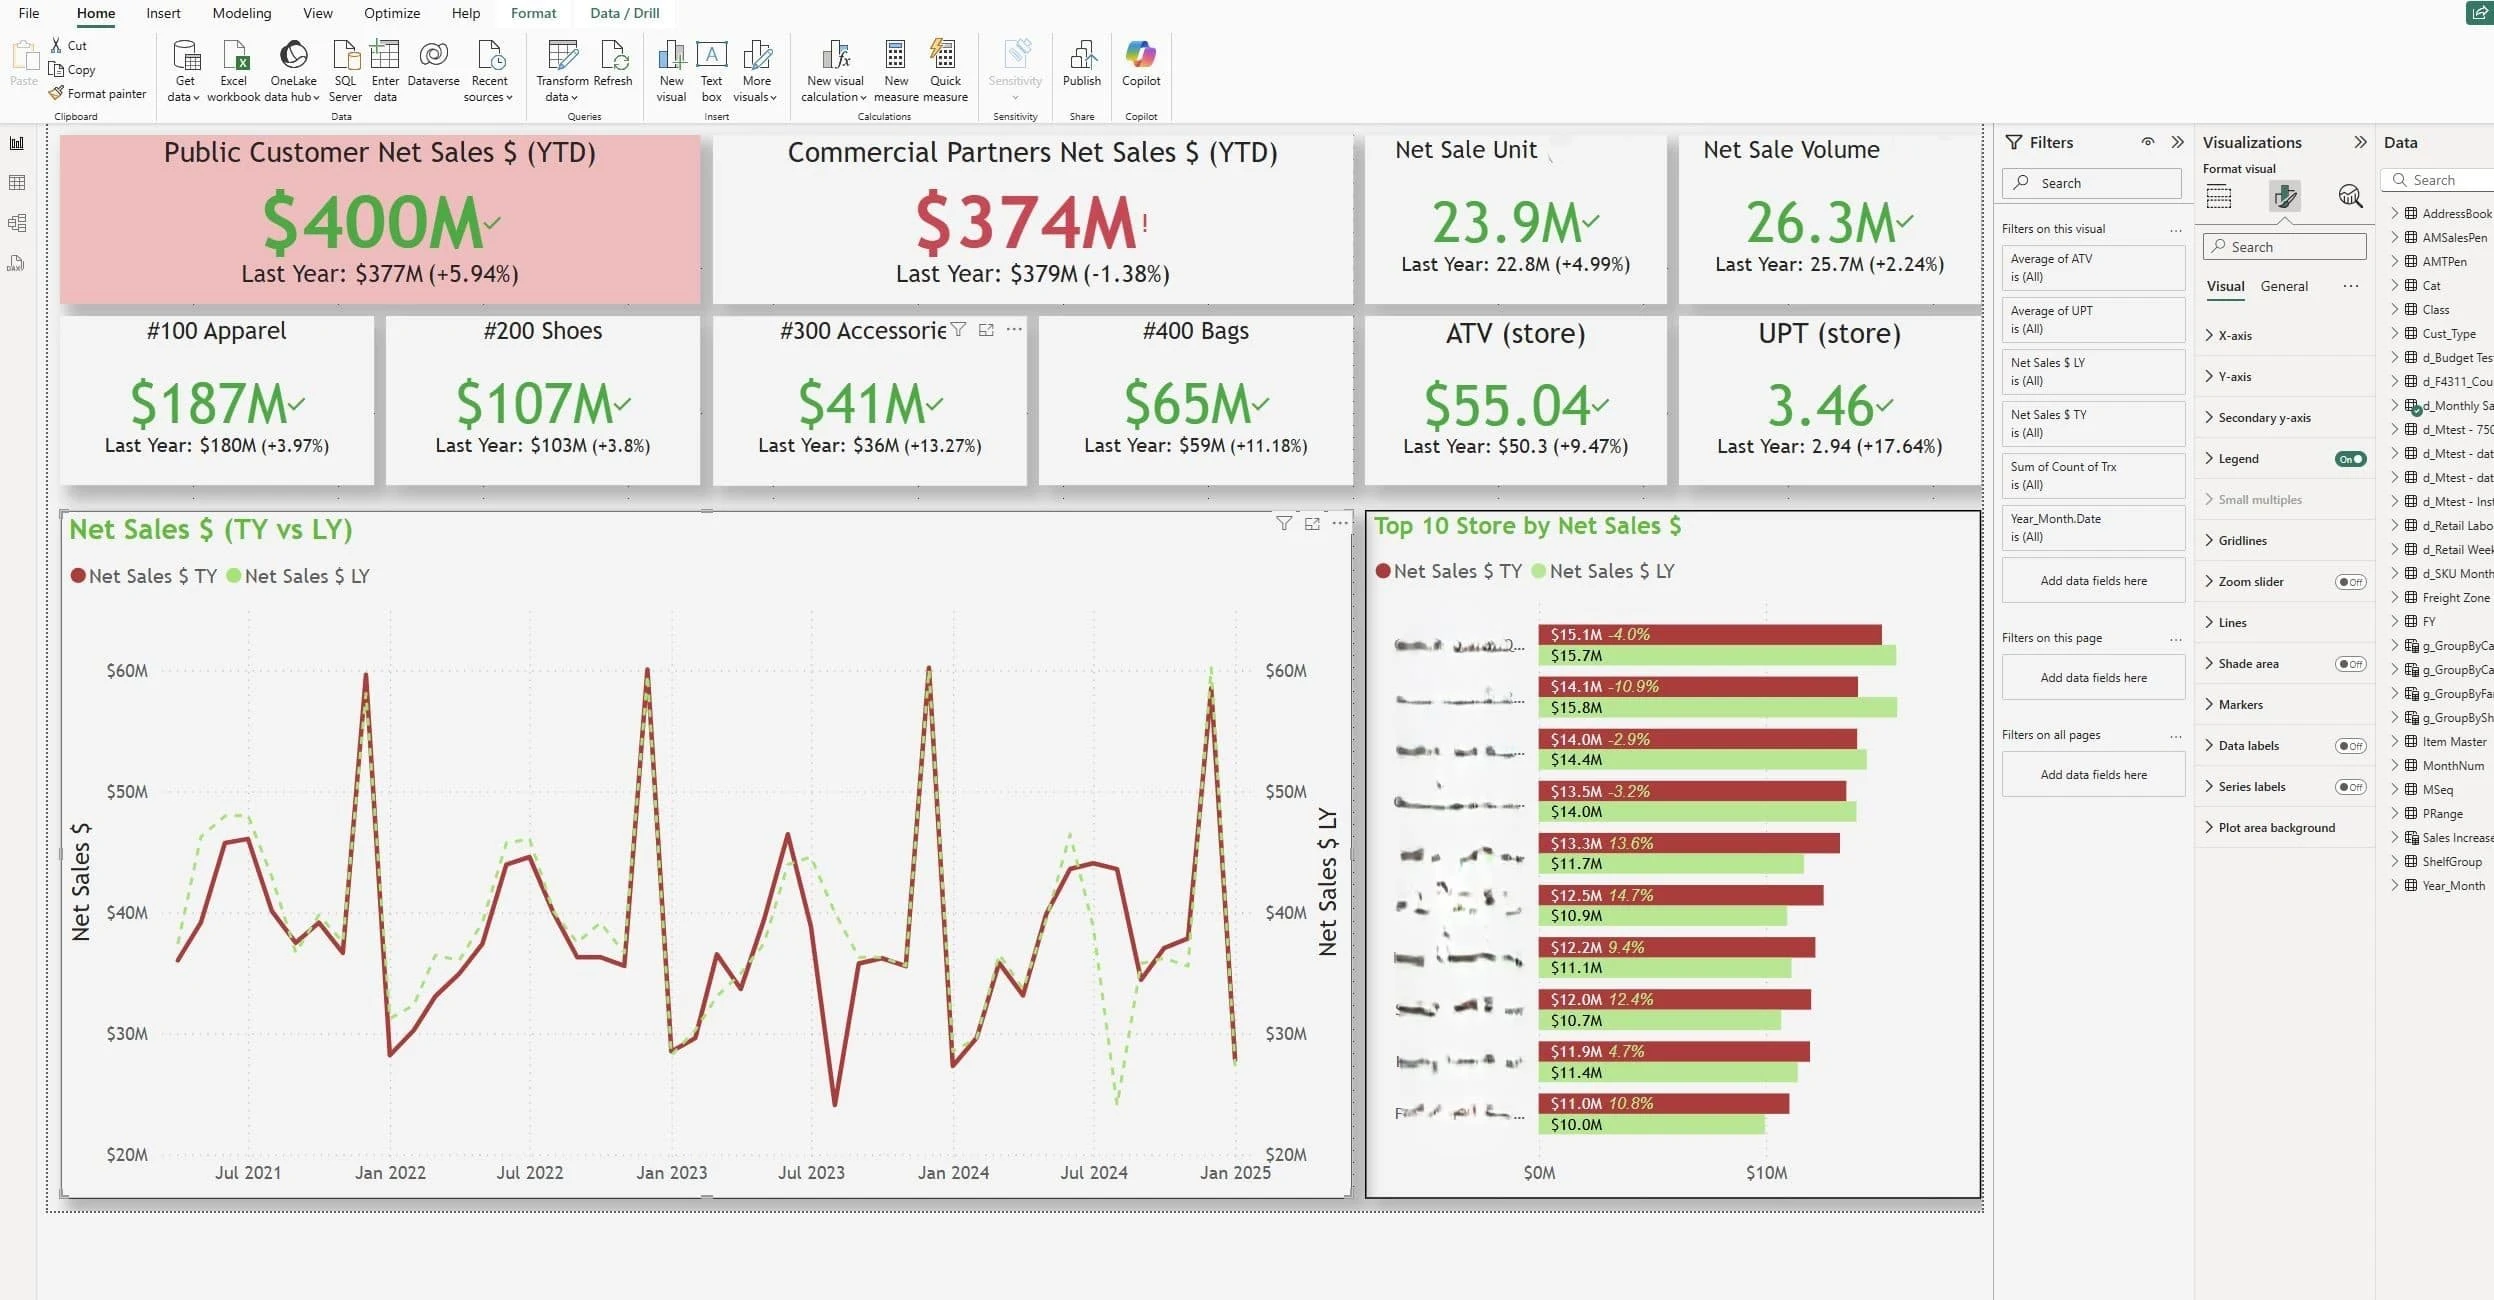
The process of dashboard development begins by identifying the key metrics and KPIs that matter most to the management team. This involves understanding their strategic goals and aligning the dashboard to highlight critical business drivers, such as revenue, profit margins, transaction volume, or operational efficiency. Defining these metrics ensures the dashboard provides actionable insights and helps management make informed decisions.
Next, the data that influences these KPIs, such as sourcing channel, plays a pivotal role in shaping the dashboard. Understanding how different cost factors impact overall performance allows for the creation of visualizations that reflect these relationships clearly. For example, comparing costs across different business units or tracking source performance against revenue can help identify opportunities for cost optimization and resource allocation.
By focusing on these vital data points and ensuring they are easily accessible, the dashboard becomes a powerful tool for decision-making, presenting complex data in a way that is intuitive and impactful for management.
Key Takeaway
Enhanced Decision-Making: The dashboard provides management with a clear, visual representation of key metrics, allowing for faster, more informed decision-making without being overwhelmed by complex data sets.
Real-Time Insights: With data directly connect to database, client can easily refresh the data and get updated data.
Improved Efficiency: By centralizing data into an interactive dashboard, manual reporting processes are streamlined, saving time and reducing the risk of errors, allowing the team to focus on analysis and strategy rather than data collection.
Like this project
Posted Feb 17, 2025
A data integration and visualization project that streamlines reporting and enhances decision-making through interactive dashboards.