OLA July 2024 Data Analytics Dashboard

Dharmjeet Kumar


🚖 OLA Data Analytics Dashboard
📊 Overview
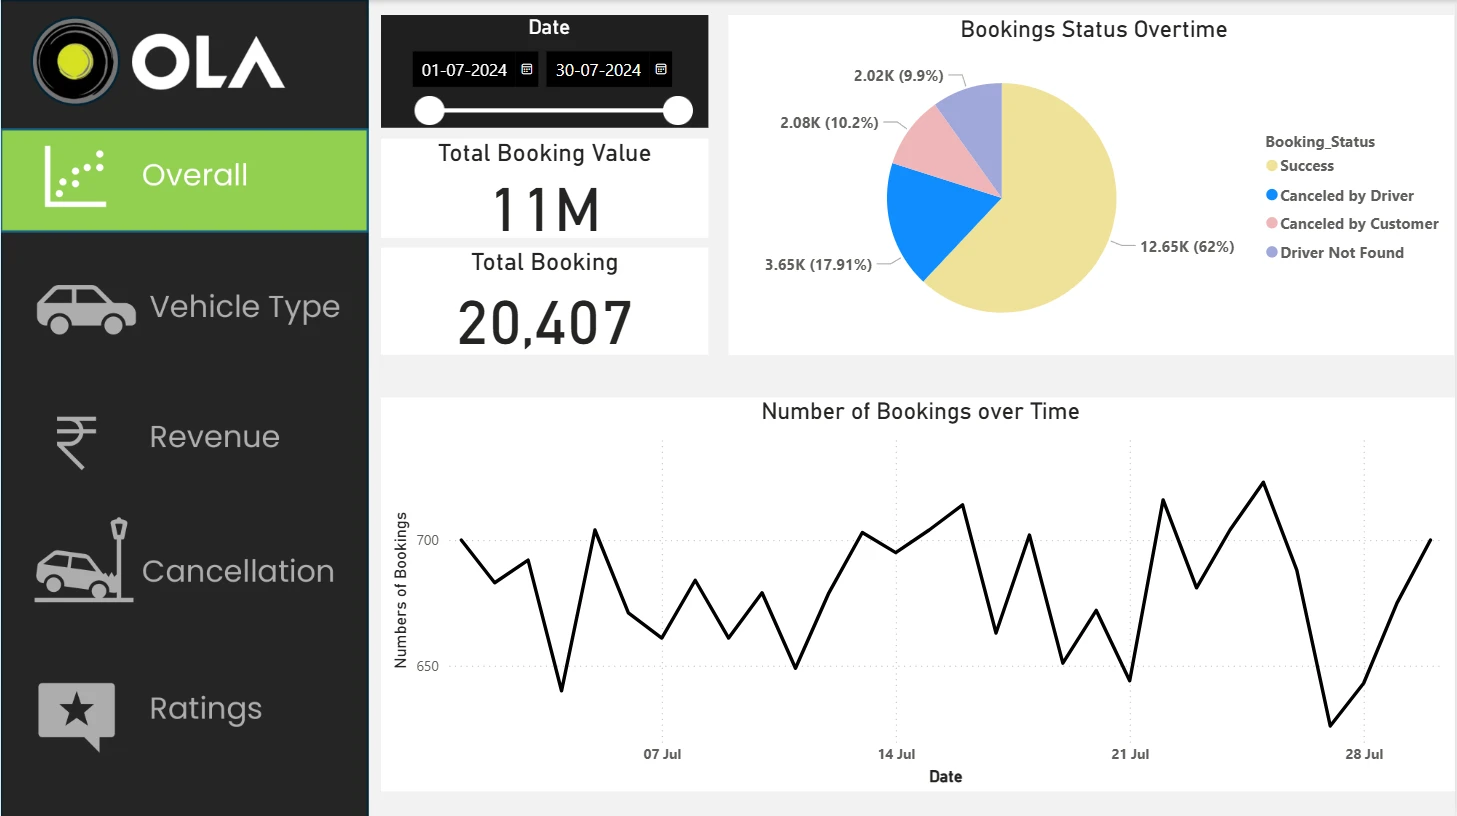
This project presents an interactive Power BI dashboard for OLA’s July 2024 data analysis. The dashboard provides insights into overall bookings, revenue trends, vehicle performance, customer behavior, and cancellation analysis. It helps business stakeholders and operations teams make data-driven decisions for improving ride efficiency and customer satisfaction.
🧠 Key Insights
🟢 Overall Summary
Total Booking Value: ₹11 Million.
Total Bookings: 20,407.
Booking Success Rate: 62% successful rides.
Cancellations: 17.9% by drivers, 10.2% by customers, 9.9% due to driver not found.
Booking trend: Fluctuating but stable throughout July with spikes in mid and end of the month.
🚗 Vehicle Type Performance

Top Performers:
Highest total booking value: Prime Sedan
Longest total distance: Bike
Most successful bookings: E-Bike
💰 Revenue Insights
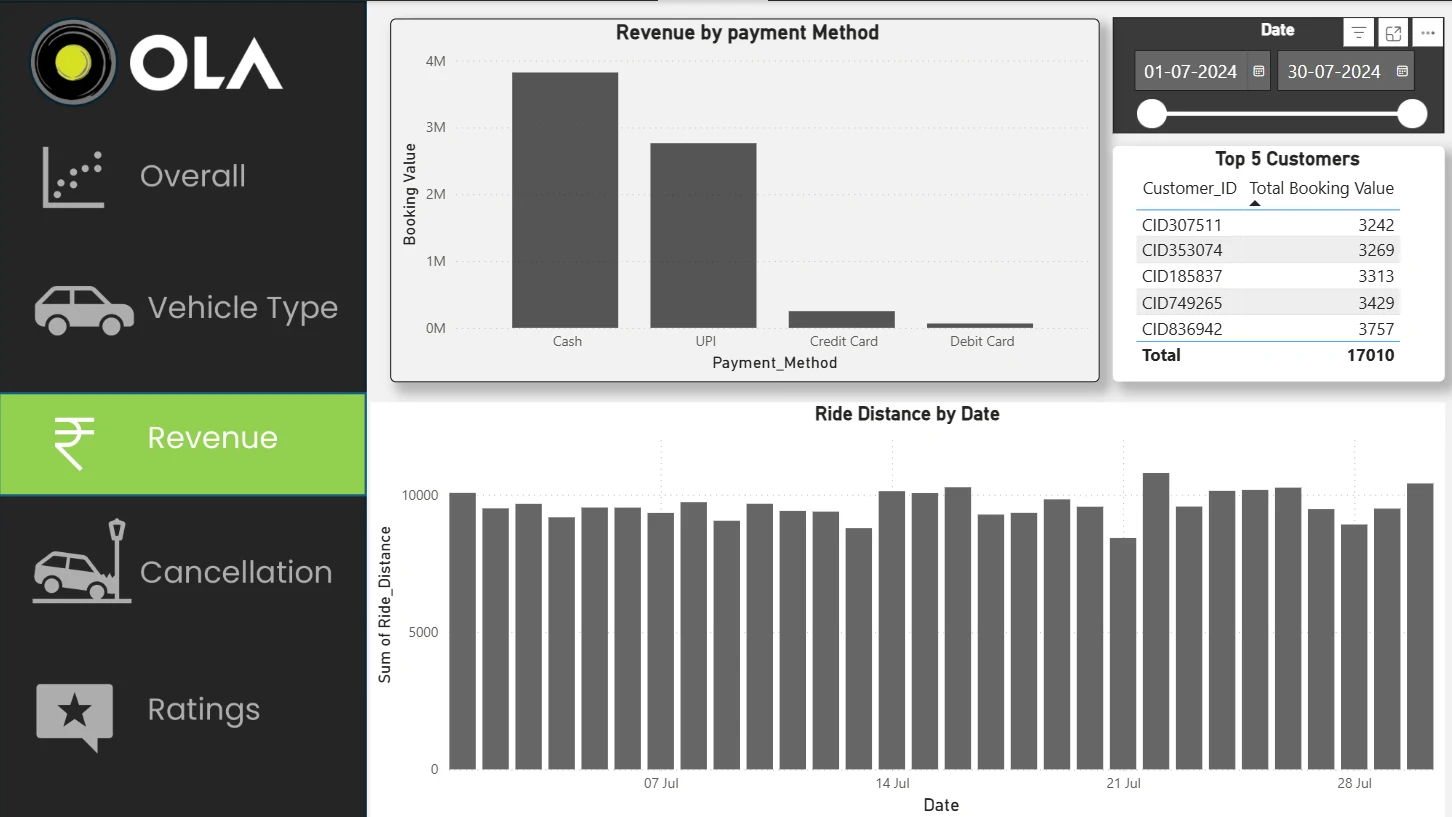
Payment Methods:
Cash: Highest revenue source (≈ ₹4M)
UPI: Second most preferred (≈ ₹3M)
Credit/Debit Cards: Minimal contribution
Ride Distance Trend: Fairly consistent daily distance, averaging around 10,000 km per day.
❌ Cancellation Analysis
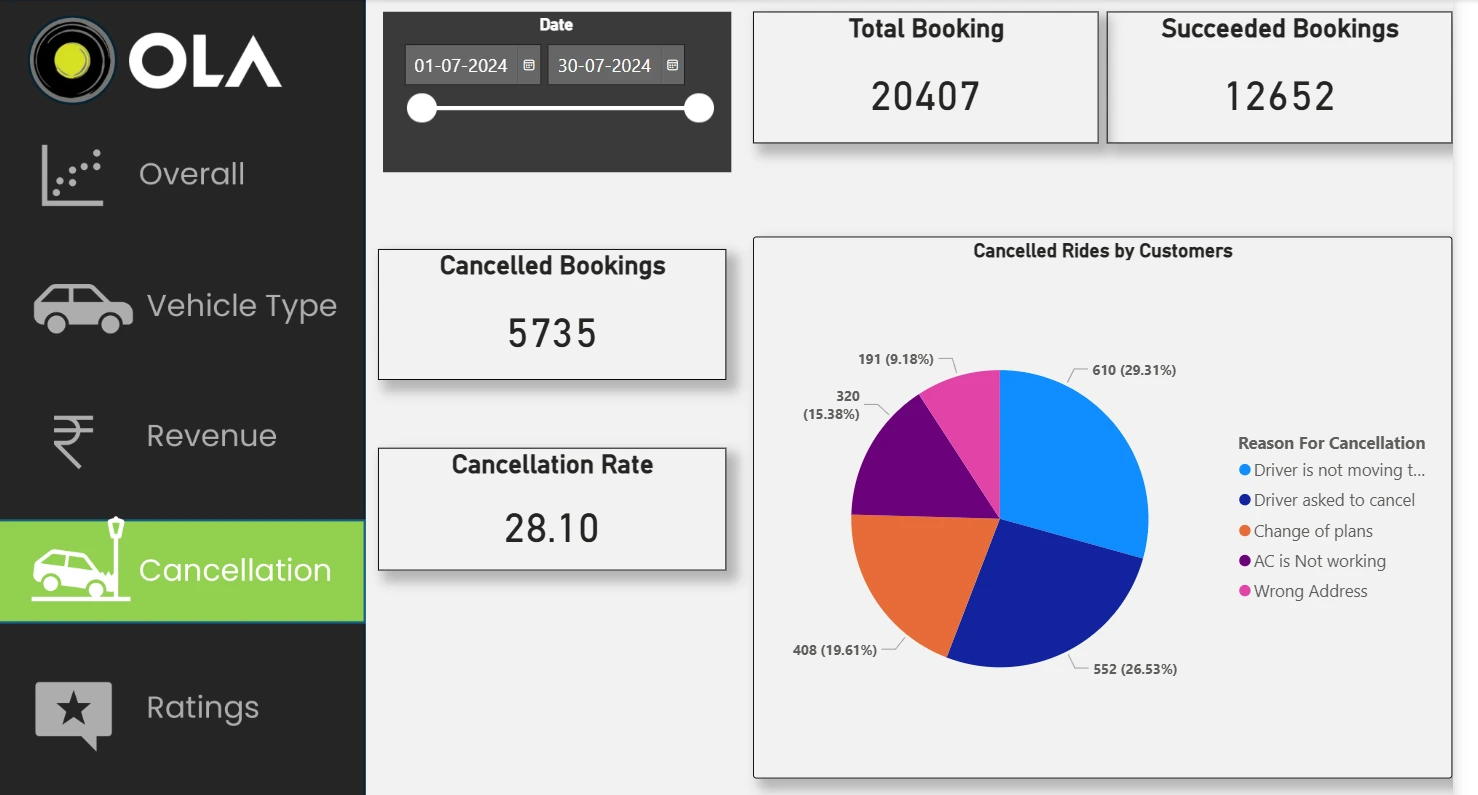
Overall Cancellations: 38% (Driver, Customer & Driver Not Found combined)
Top Reasons:
Driver cancellations remain the most frequent cause.
Customer cancellations typically occur during peak hours.
“Driver Not Found” cases are clustered around weekends.
Business Insight: Reducing driver cancellations can directly increase success rates by 15–20%.
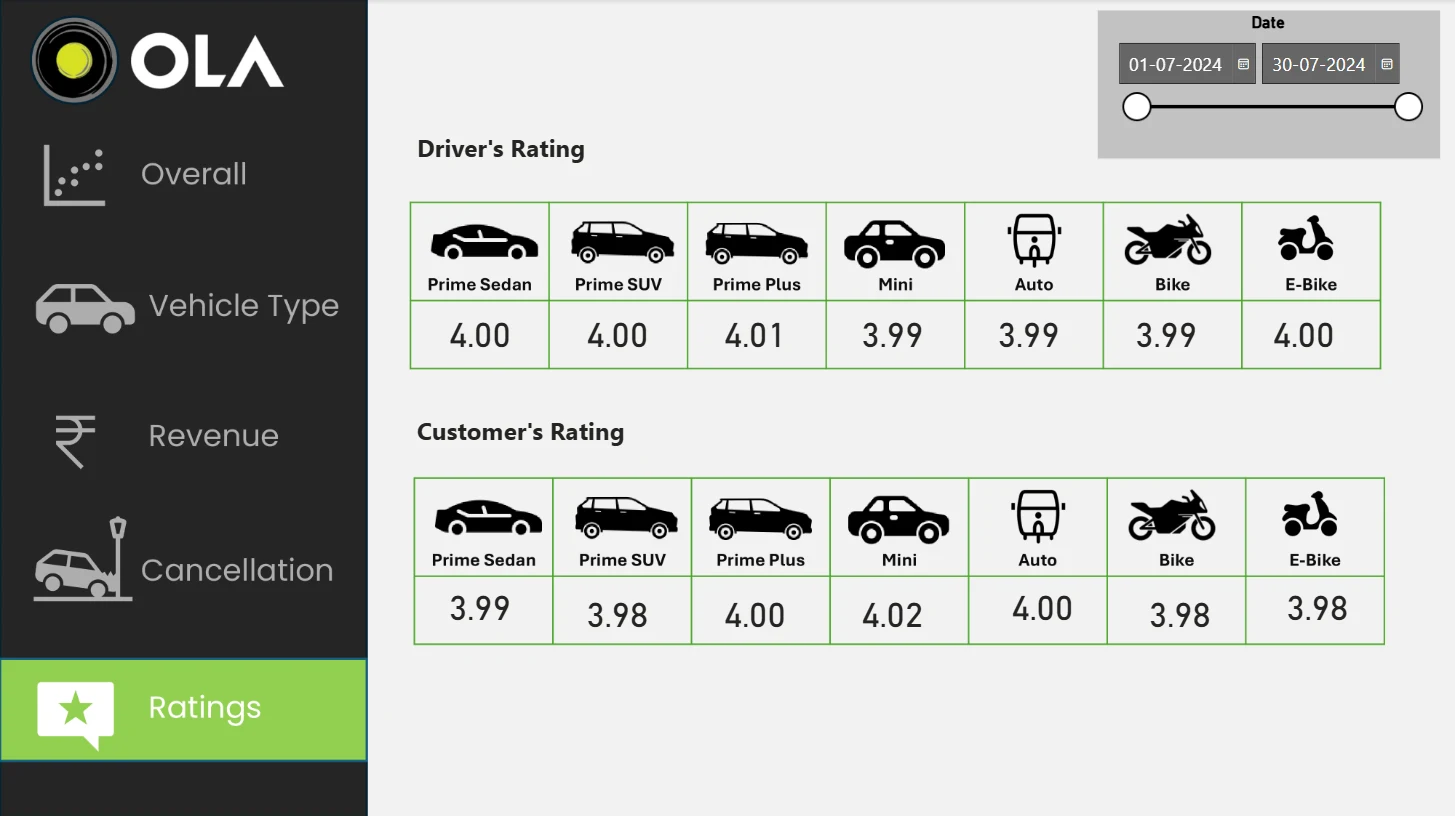
⭐ Ratings Overview
Average Rating: ~4.2 / 5
Highest-Rated Vehicle Types: Prime Sedan & E-Bike
Lowest-Rated Category: Auto (likely due to comfort/distance factors)
Observation: Rides with successful completion and shorter waiting times receive significantly higher ratings.
⚙️ Tools and Technologies
Power BI – Data modeling, visualization, DAX measures
Excel / CSV – Raw data preparation and cleaning
Power Query – Transformation and data shaping
DAX – Custom KPIs and calculated metrics
🗂️ Dashboard Sections
Overall Overview – Bookings summary, trends, and status breakdown
Vehicle Type – Vehicle-wise performance, success rate, and distance insights
Revenue – Revenue by payment method, top customers, and ride distance
Cancellation – Analysis of driver and customer cancellations
Ratings – Customer rating trends and vehicle-type comparison
📷 Dashboard Snapshots
🟢 Overall
🚗 Vehicle Type
💰 Revenue
❌ Cancellation
⭐ Ratings
🏁 Conclusion
The OLA Data Analytics Dashboard provides an end-to-end view of operational efficiency, customer behavior, and revenue performance. It helps business teams:
Optimize fleet allocation,
Identify top-performing vehicle types,
Address cancellation causes, and
Enhance customer satisfaction through better service quality.
My Learnings:
This project has significantly enhanced my analytical skills, particularly in using Power BI for data visualization and analysis. I am now more confident in my ability to transform raw data into meaningful insights that can drive strategic business decisions. This experience has prepared me well for future data analysis projects, and I look forward to applying these skills in more complex and challenging scenarios.
Like this project
Posted Oct 7, 2026
Created an interactive Power BI dashboard analyzing OLA's July 2024 data.
Likes
0
Views
0
Timeline
Jul 1, 2024 - Jul 31, 2024
Clients
OLA