Thomson’s Hospitality Leads Flow Dashboard

Dharmjeet Kumar


🏥 Thomson’s Hospitality : Leads Flow Dashboard
📊 Project Overview
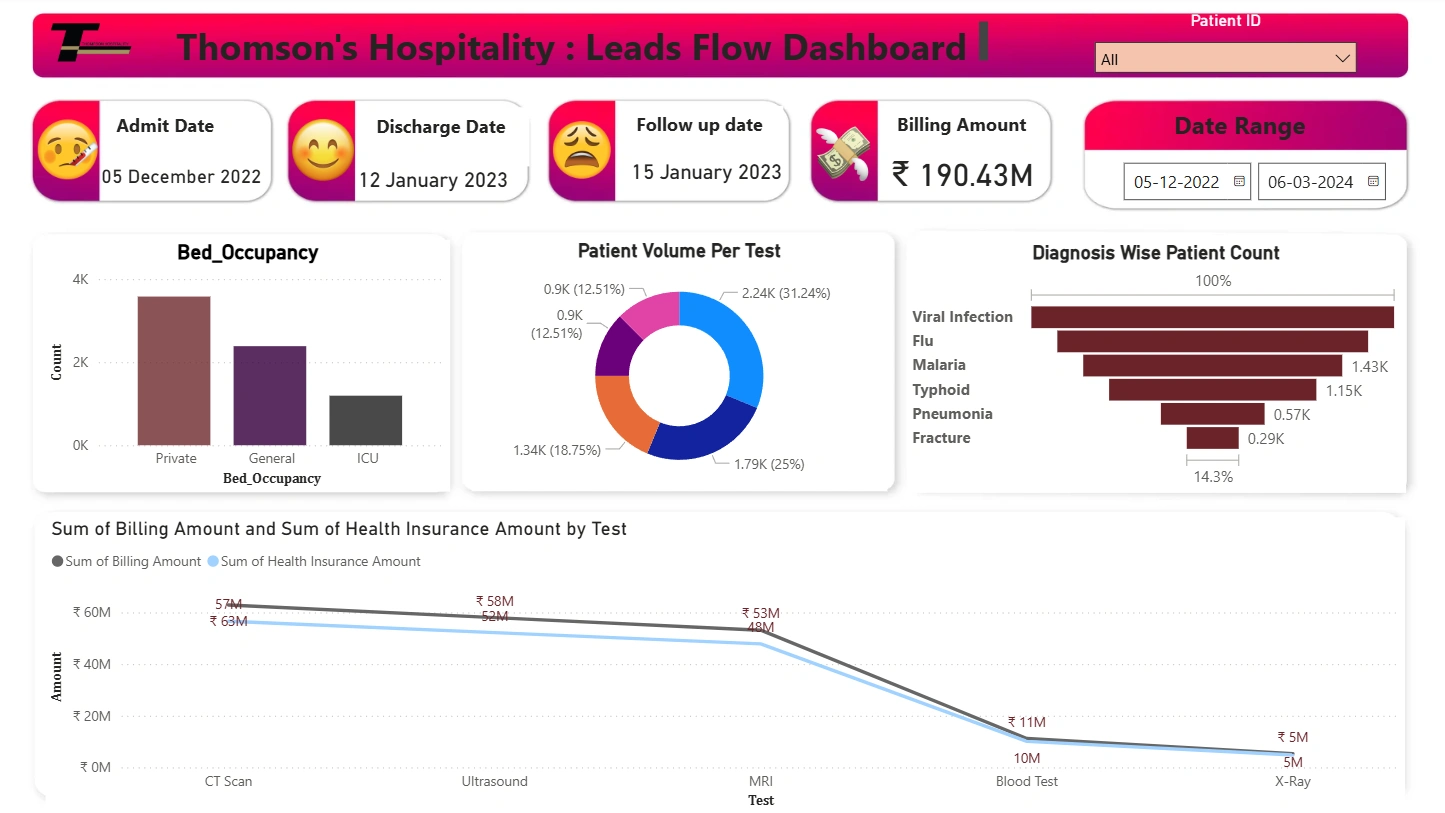
The Thomson’s Hospitality Leads Flow Dashboard is an interactive Power BI dashboard designed to visualize and analyze hospital lead flow, patient management, diagnosis distribution, and financial data. It helps hospital management track patient admission, discharge, diagnosis trends, and billing details in a visually insightful way.
🎯 Objectives
Monitor patient flow from admission to discharge.
Analyze bed occupancy across hospital categories.
Understand patient volume per test.
Track diagnosis-wise patient count.
Compare billing amount vs. health insurance claim amount.
Provide actionable insights for hospital administration.
🧾 Key Dashboard Metrics
1️⃣ Patient Details
Admit Date: 05 December 2022
Discharge Date: 12 January 2023
Follow-up Date: 15 January 2023
Billing Amount: ₹190.43 Million
Includes dynamic filters for Patient ID and Date Range selection.
2️⃣ Bed Occupancy
Displays patient count across different hospital bed categories:
Private
General
ICU
📈 Observation: Private wards show the highest occupancy among all categories.
3️⃣ Patient Volume Per Test
Visualized using a donut chart, showing distribution of patients by test type:
CT Scan – 31.24% (2.24K)
MRI – 25% (1.79K)
Ultrasound – 18.75% (1.34K)
Blood Test – 12.51% (0.9K)
X-Ray – 12.51% (0.9K)
📊 Insight: CT Scans have the highest patient volume.
4️⃣ Diagnosis Wise Patient Count
Bar chart showing number of patients by diagnosis type:
Viral Infection – Highest count (≈100%)
Flu
Malaria – 1.43K
Typhoid – 1.15K
Pneumonia – 0.57K
Fracture – 0.29K
💡 Insight: Viral infections are the most common diagnosis among patients.
5️⃣ Billing vs. Health Insurance Comparison
Line chart showing billing and insurance claim amounts across tests:
Test Type Billing Amount Health Insurance Amount CT Scan ₹57M ₹63M Ultrasound ₹58M ₹52M MRI ₹53M ₹48M Blood Test ₹11M ₹10M X-Ray ₹5M ₹5M
📈 Insight: CT Scans and MRIs contribute the most to total billing.
🧠 Insights & Findings
Majority of patients were admitted in private wards, indicating preference or higher revenue generation.
CT Scan tests contribute the highest patient volume and billing revenue.
Viral infections are the most frequent diagnoses.
Health insurance claims generally align closely with billed amounts, showing balanced financial flow.
⚙️ Tools & Technologies Used:
Power BI – Dashboard creation and data visualization.
Excel / SQL – Data preparation and cleaning.
DAX Functions – For calculated columns and measures.
Data Modeling – Relationship management between hospital data tables.
📂 Dashboard Components
📊 Reports Included:
Bed Occupancy Analysis.
Diagnosis Distribution.
Test-wise Billing Comparison.
Patient Admission & Discharge Trends.
🧠 Learnings:
Working on the Thomson’s Hospitality Leads Flow Dashboard helped me develop strong skills in Power BI, data analysis, and visualization. I learned to clean and model hospital data, create DAX measures, and design interactive dashboards with slicers and dynamic visuals. The project improved my understanding of patient flow, diagnosis patterns, and financial performance through data-driven insights. I also enhanced my ability to choose effective charts for clear storytelling and professional presentation. This experience strengthened my analytical thinking, problem-solving, and reporting skills, showing how data visualization supports better decision-making in the healthcare sector.
Like this project
Posted Oct 7, 2026
Created a Power BI dashboard for hospital data visualization and analysis.
Likes
0
Views
0
Timeline
Dec 5, 2022 - Jan 12, 2023