
CropVise Monthly Ad Performance Report Presentation
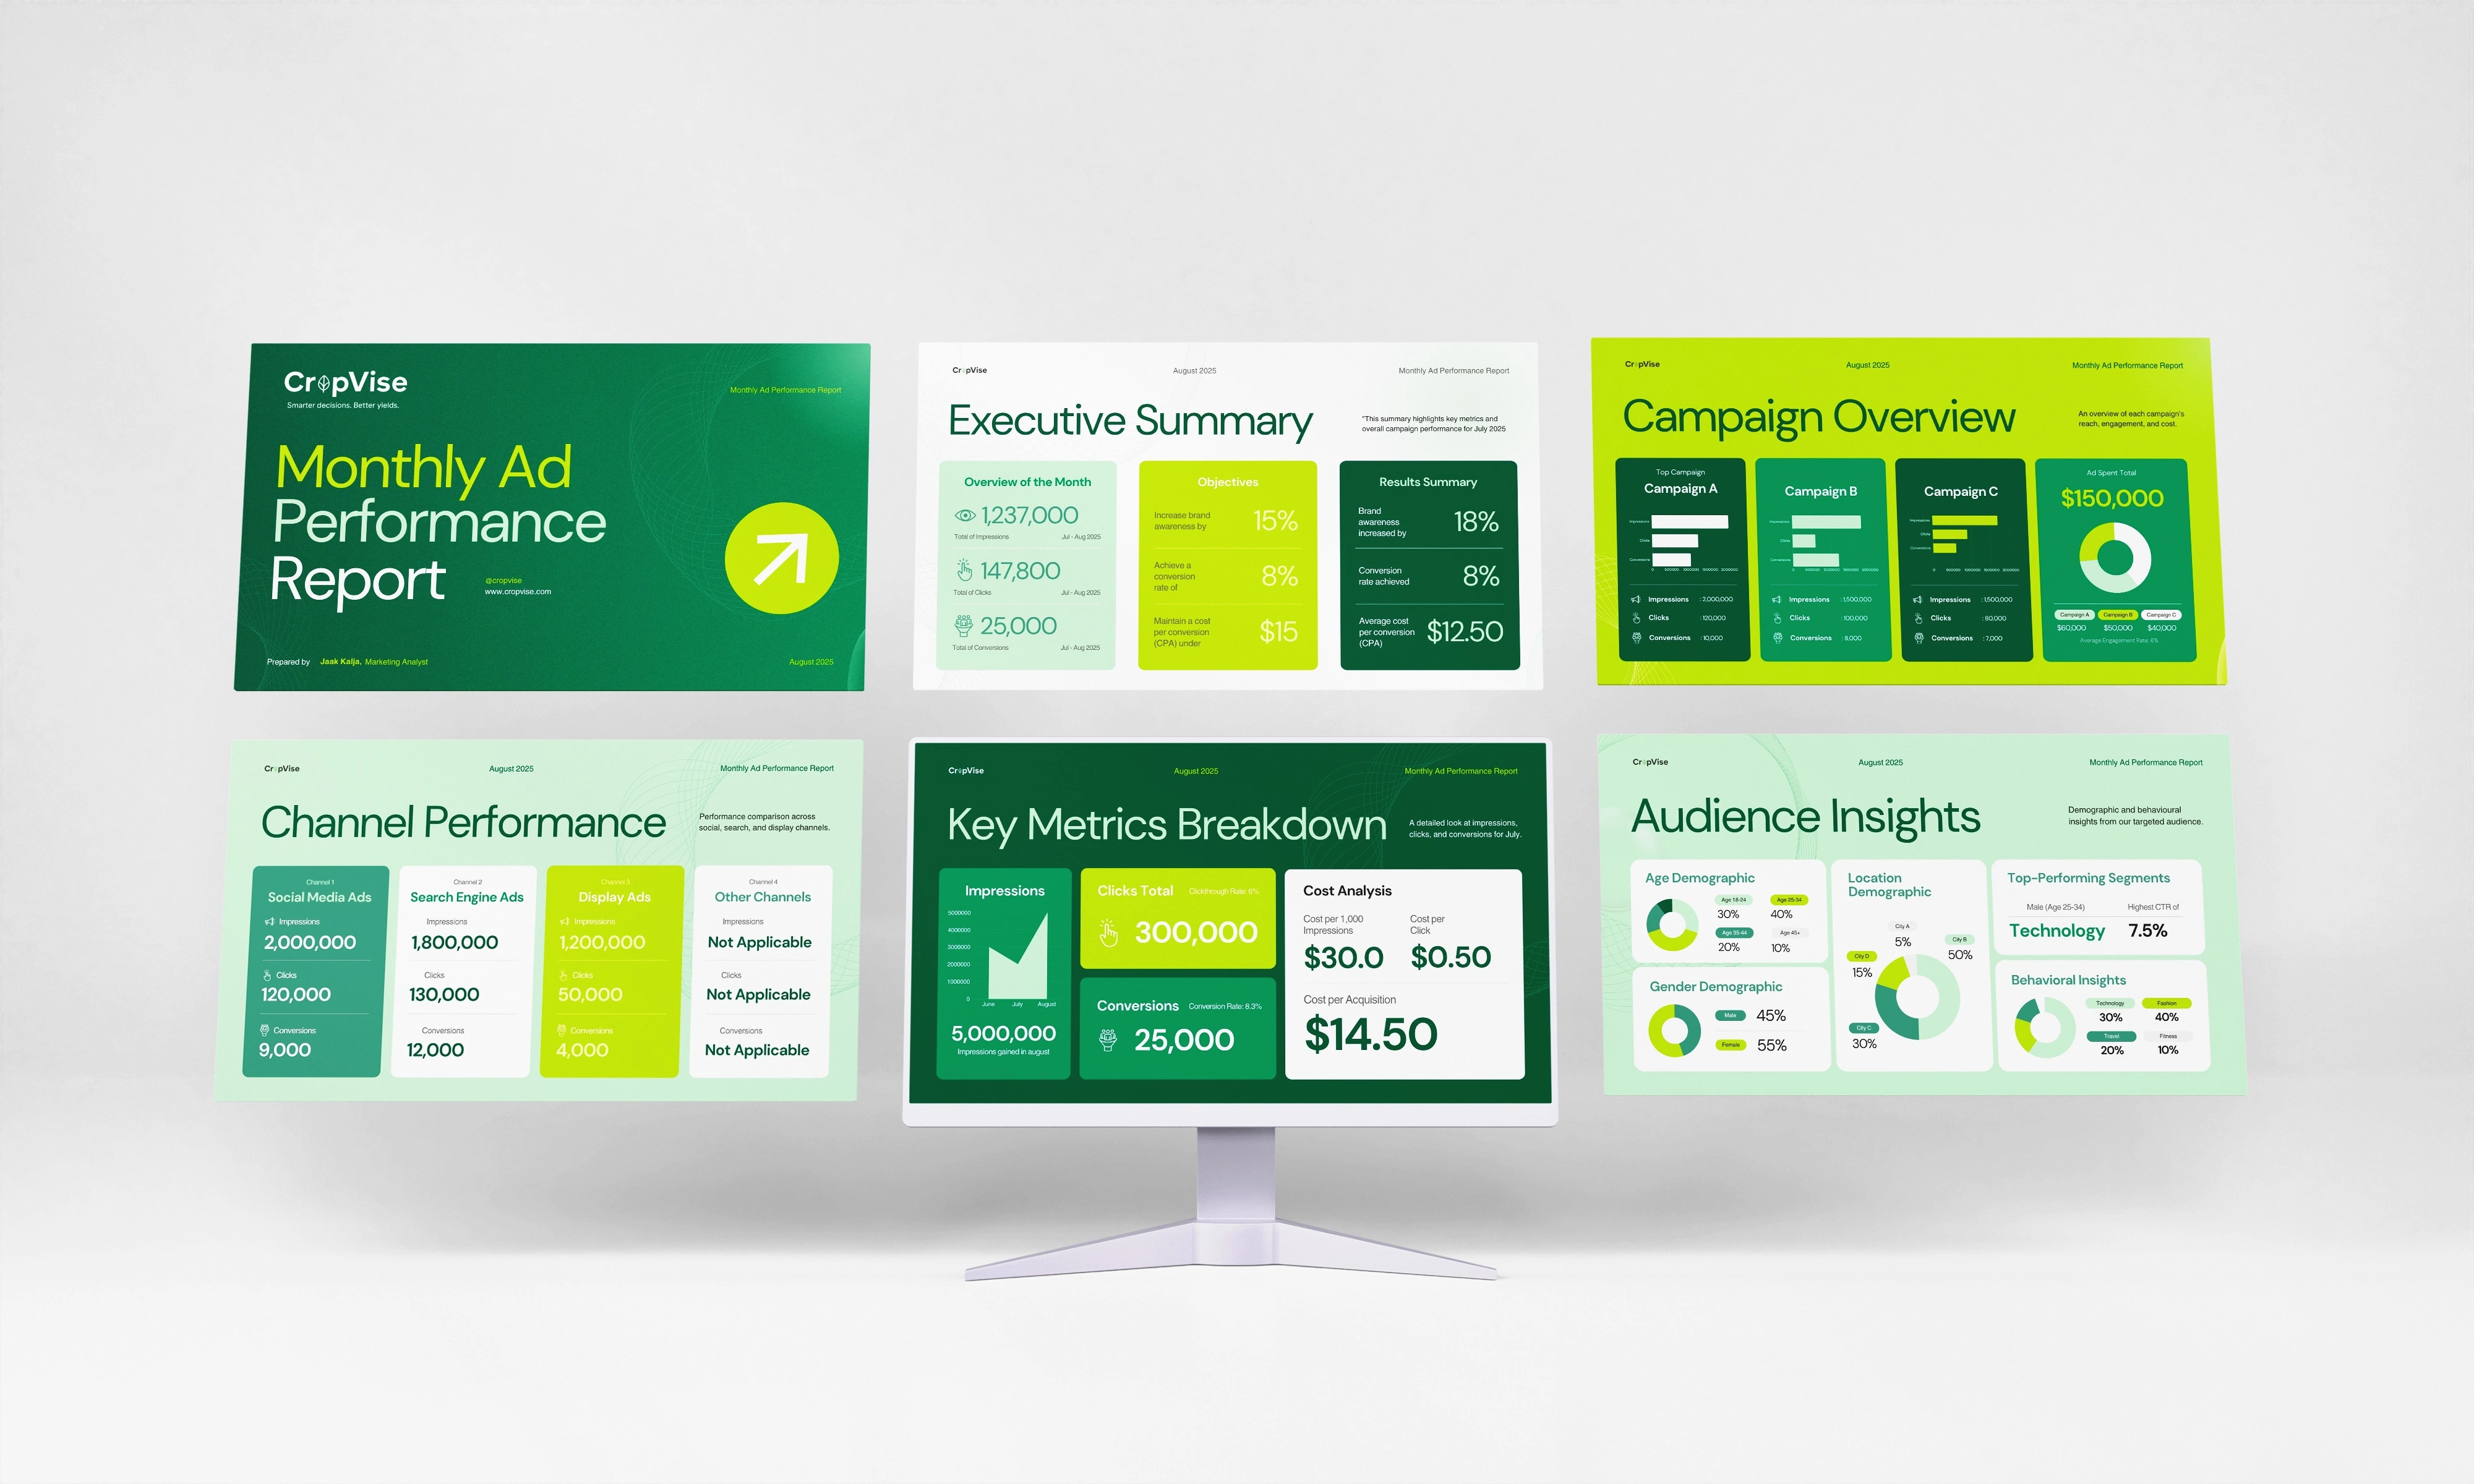
CropVise: Monthly Ad Performance Report Design
Overview
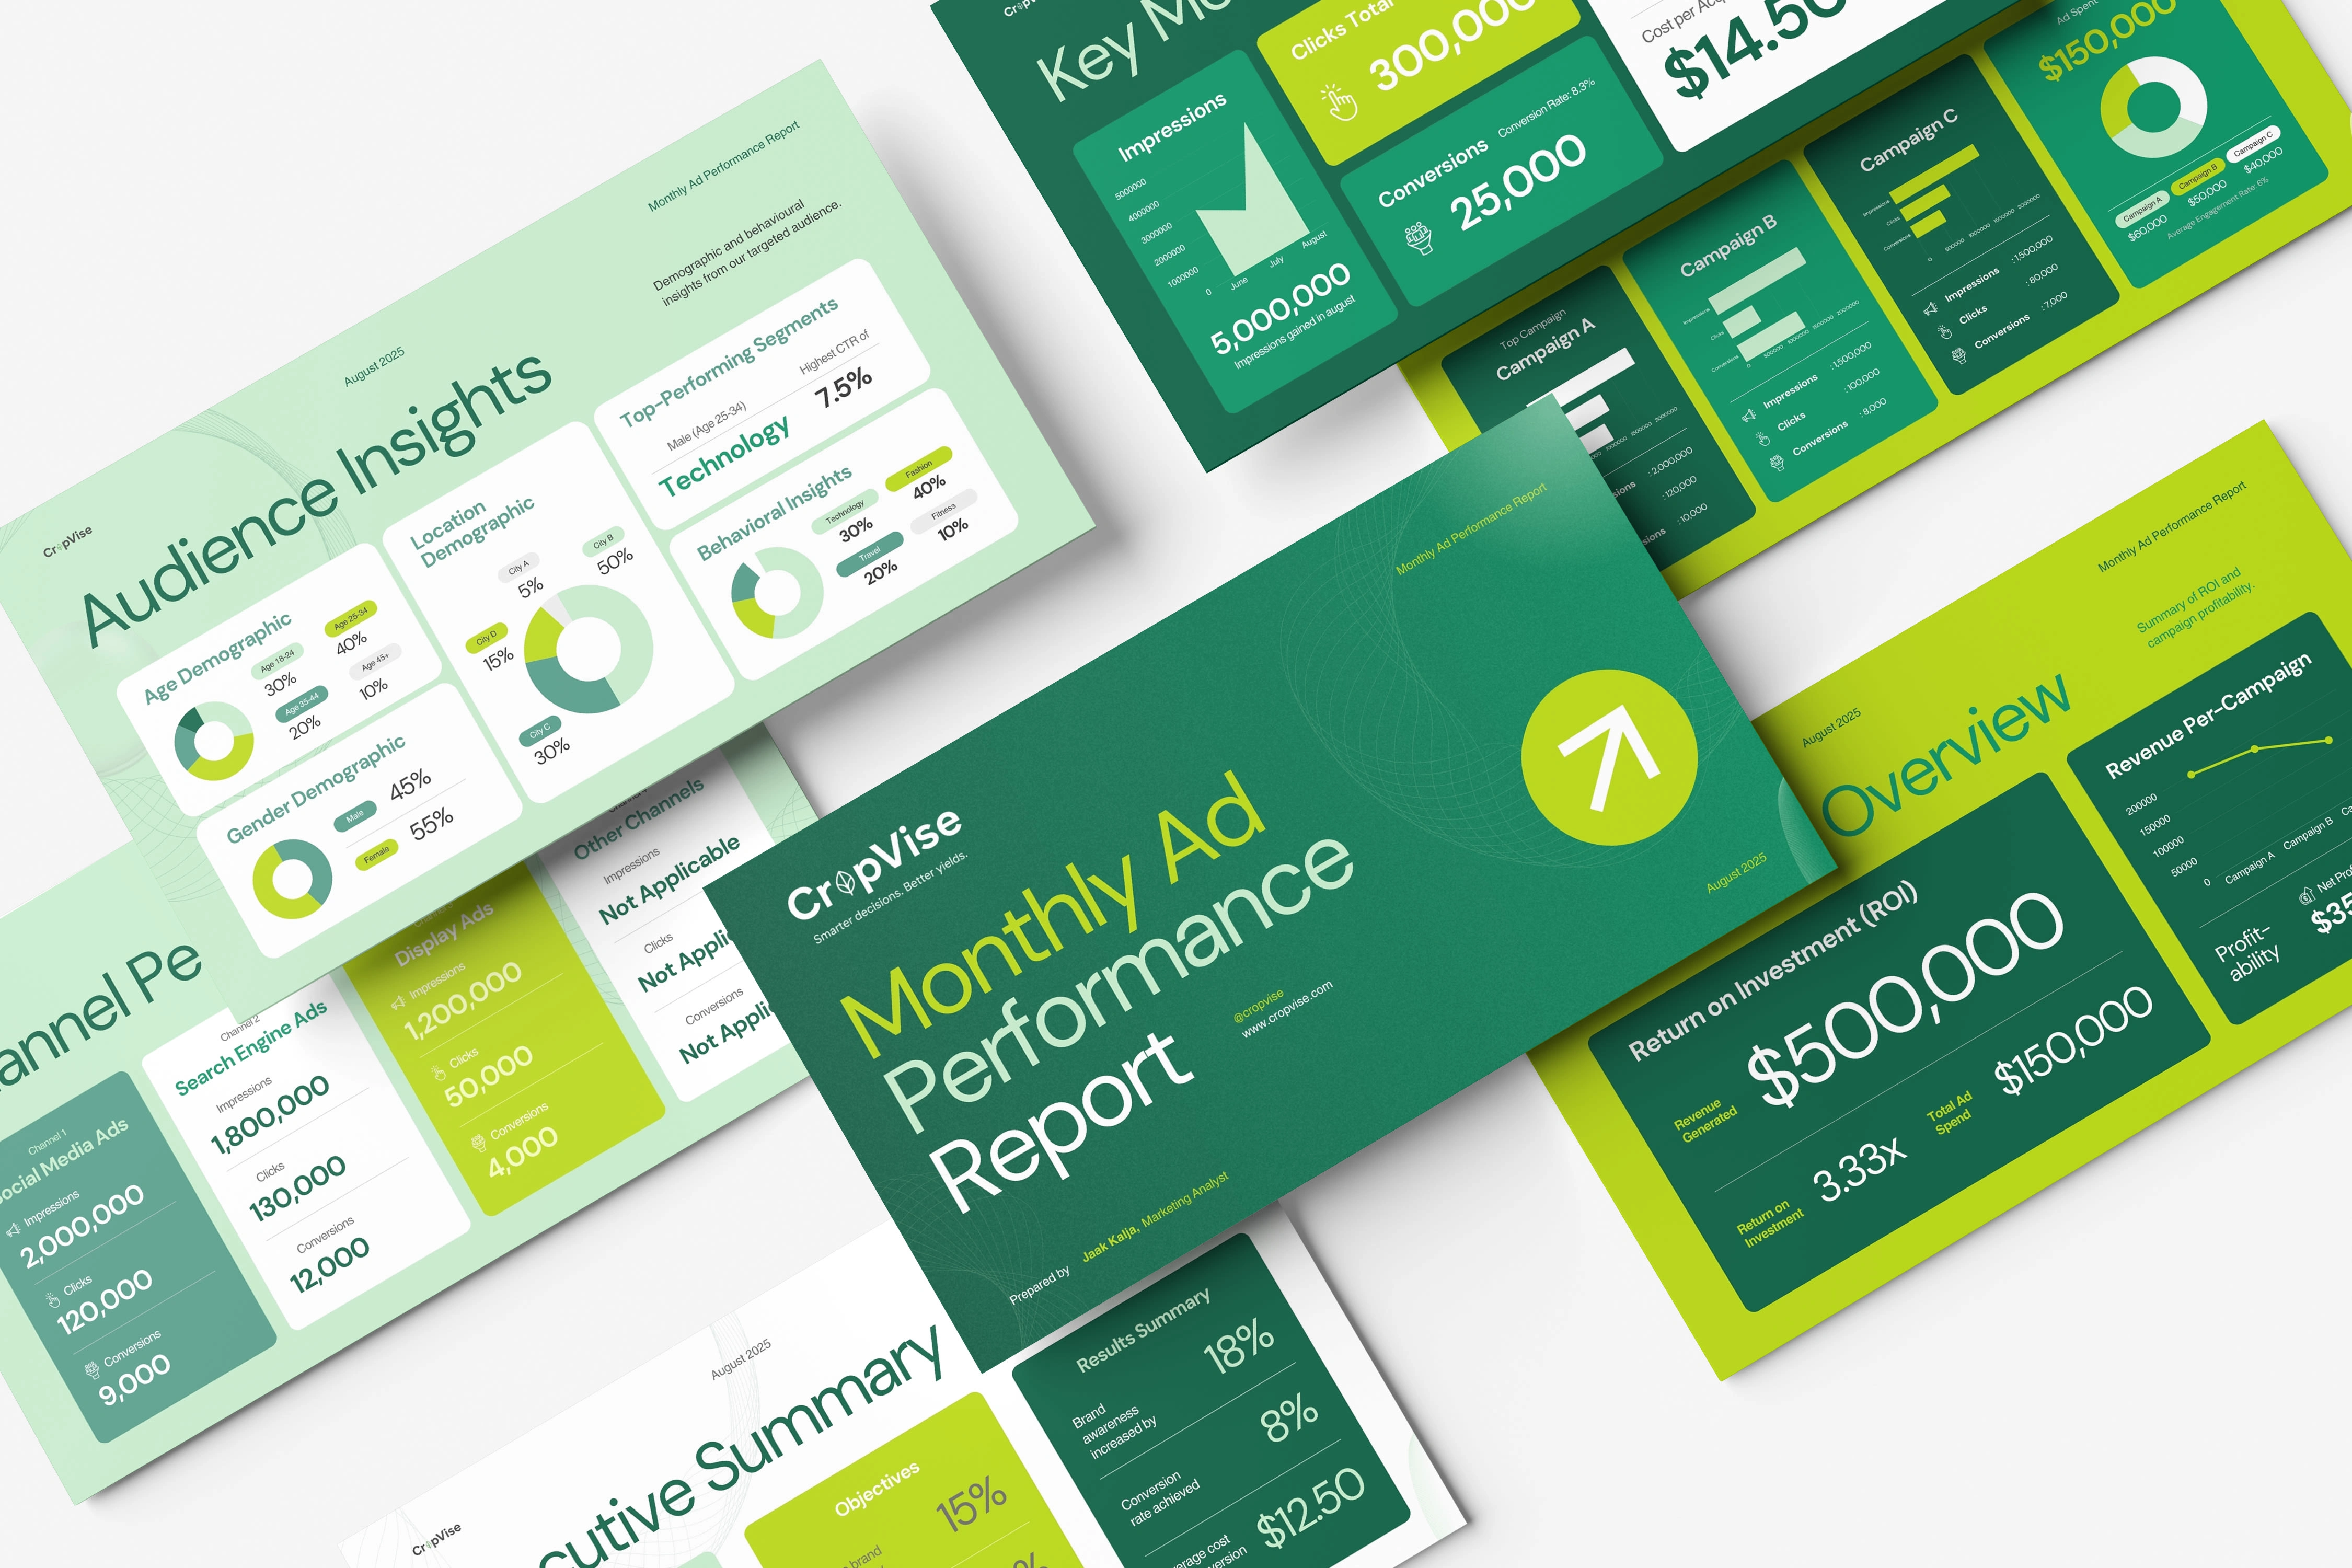
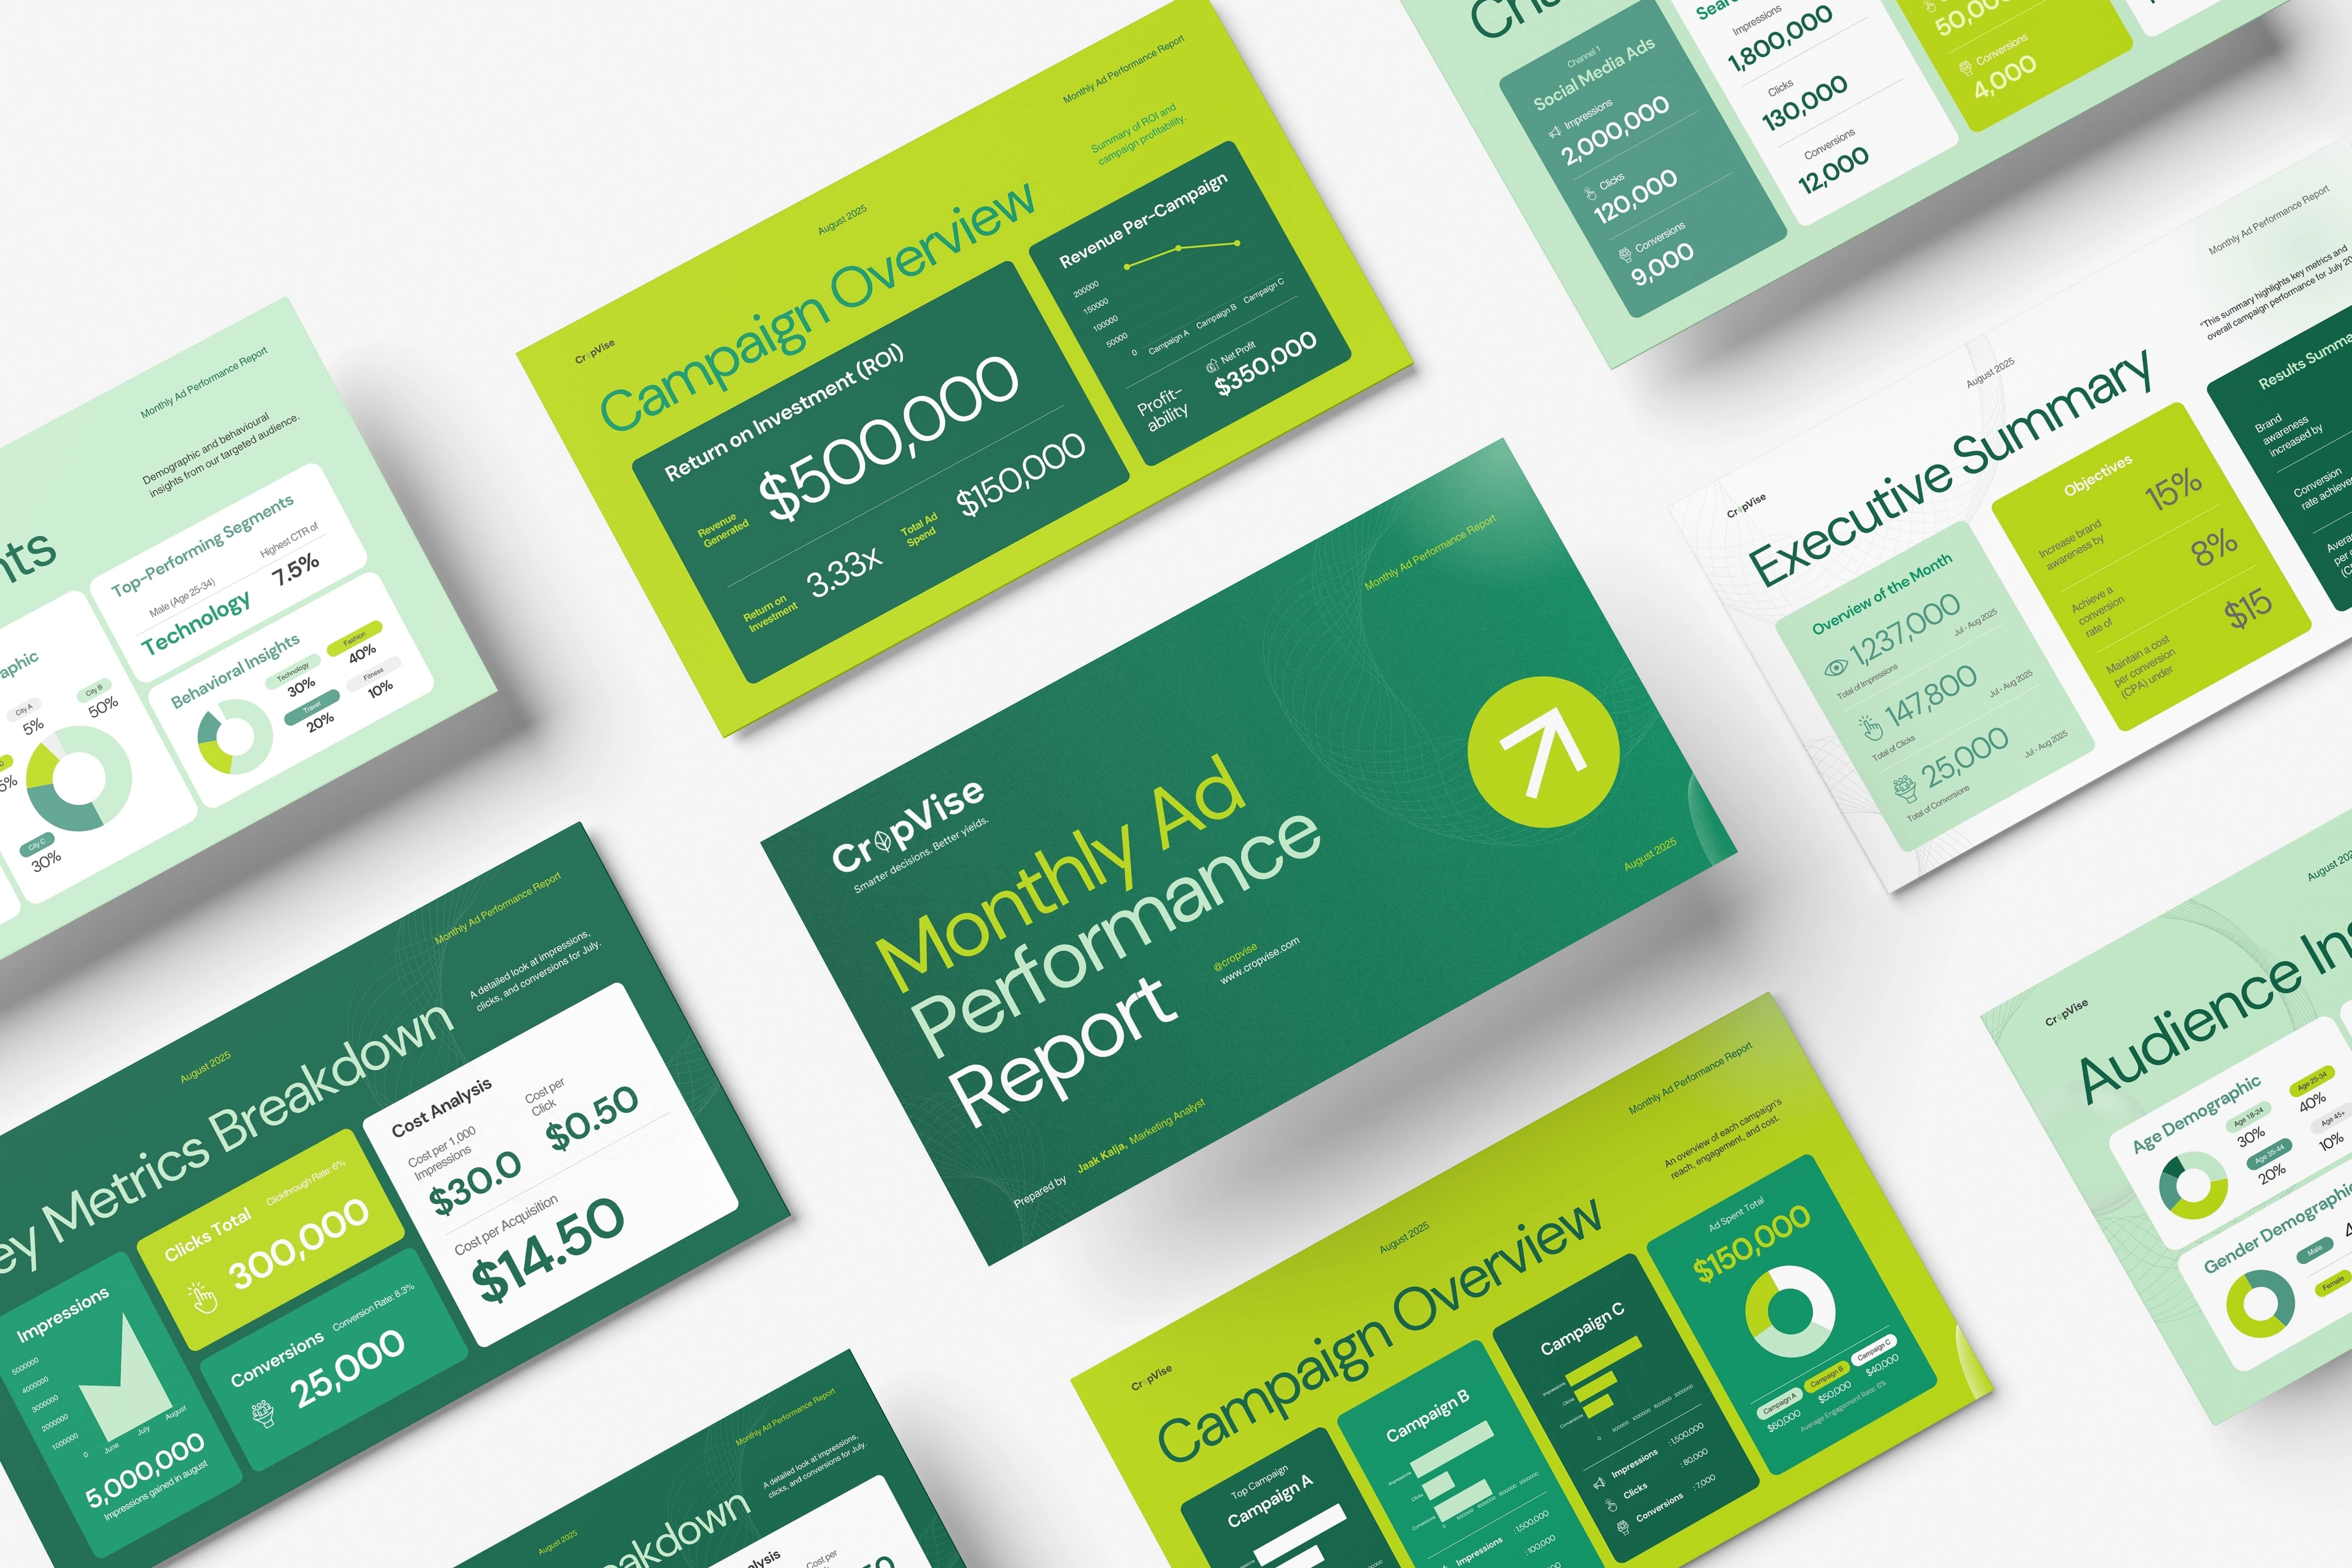
CropVise, a data intelligence platform for agribusinesses, needed a presentation dashboard that clearly communicates complex marketing data to executives and stakeholders. As the Lead Designer, I was tasked with transforming raw analytics into a visually engaging, easy-to-digest performance report that supports smart decision-making and campaign optimization.
Objectives
Design a modern, data-first presentation that conveys key ad metrics at a glance.
Improve information hierarchy for clarity and visual flow.
Maintain strong brand consistency with CropVise’s visual identity.
Create a layout adaptable across both presentation and dashboard interfaces.
Design Approach
To ensure readability and executive appeal, the design prioritizes:
Clean typography and structured grid layouts for balanced visual weight.
Color-coded segmentation to differentiate performance channels (Social, Search, Display).
Infographic-style components for quick insights into impressions, clicks, and conversions.
5 likes · 17 views · Oct 15, 2025
CropVise, a data intelligence platform for agribusinesses, needed a presentation dashboard that clearly communicates complex marketing data to executives.


