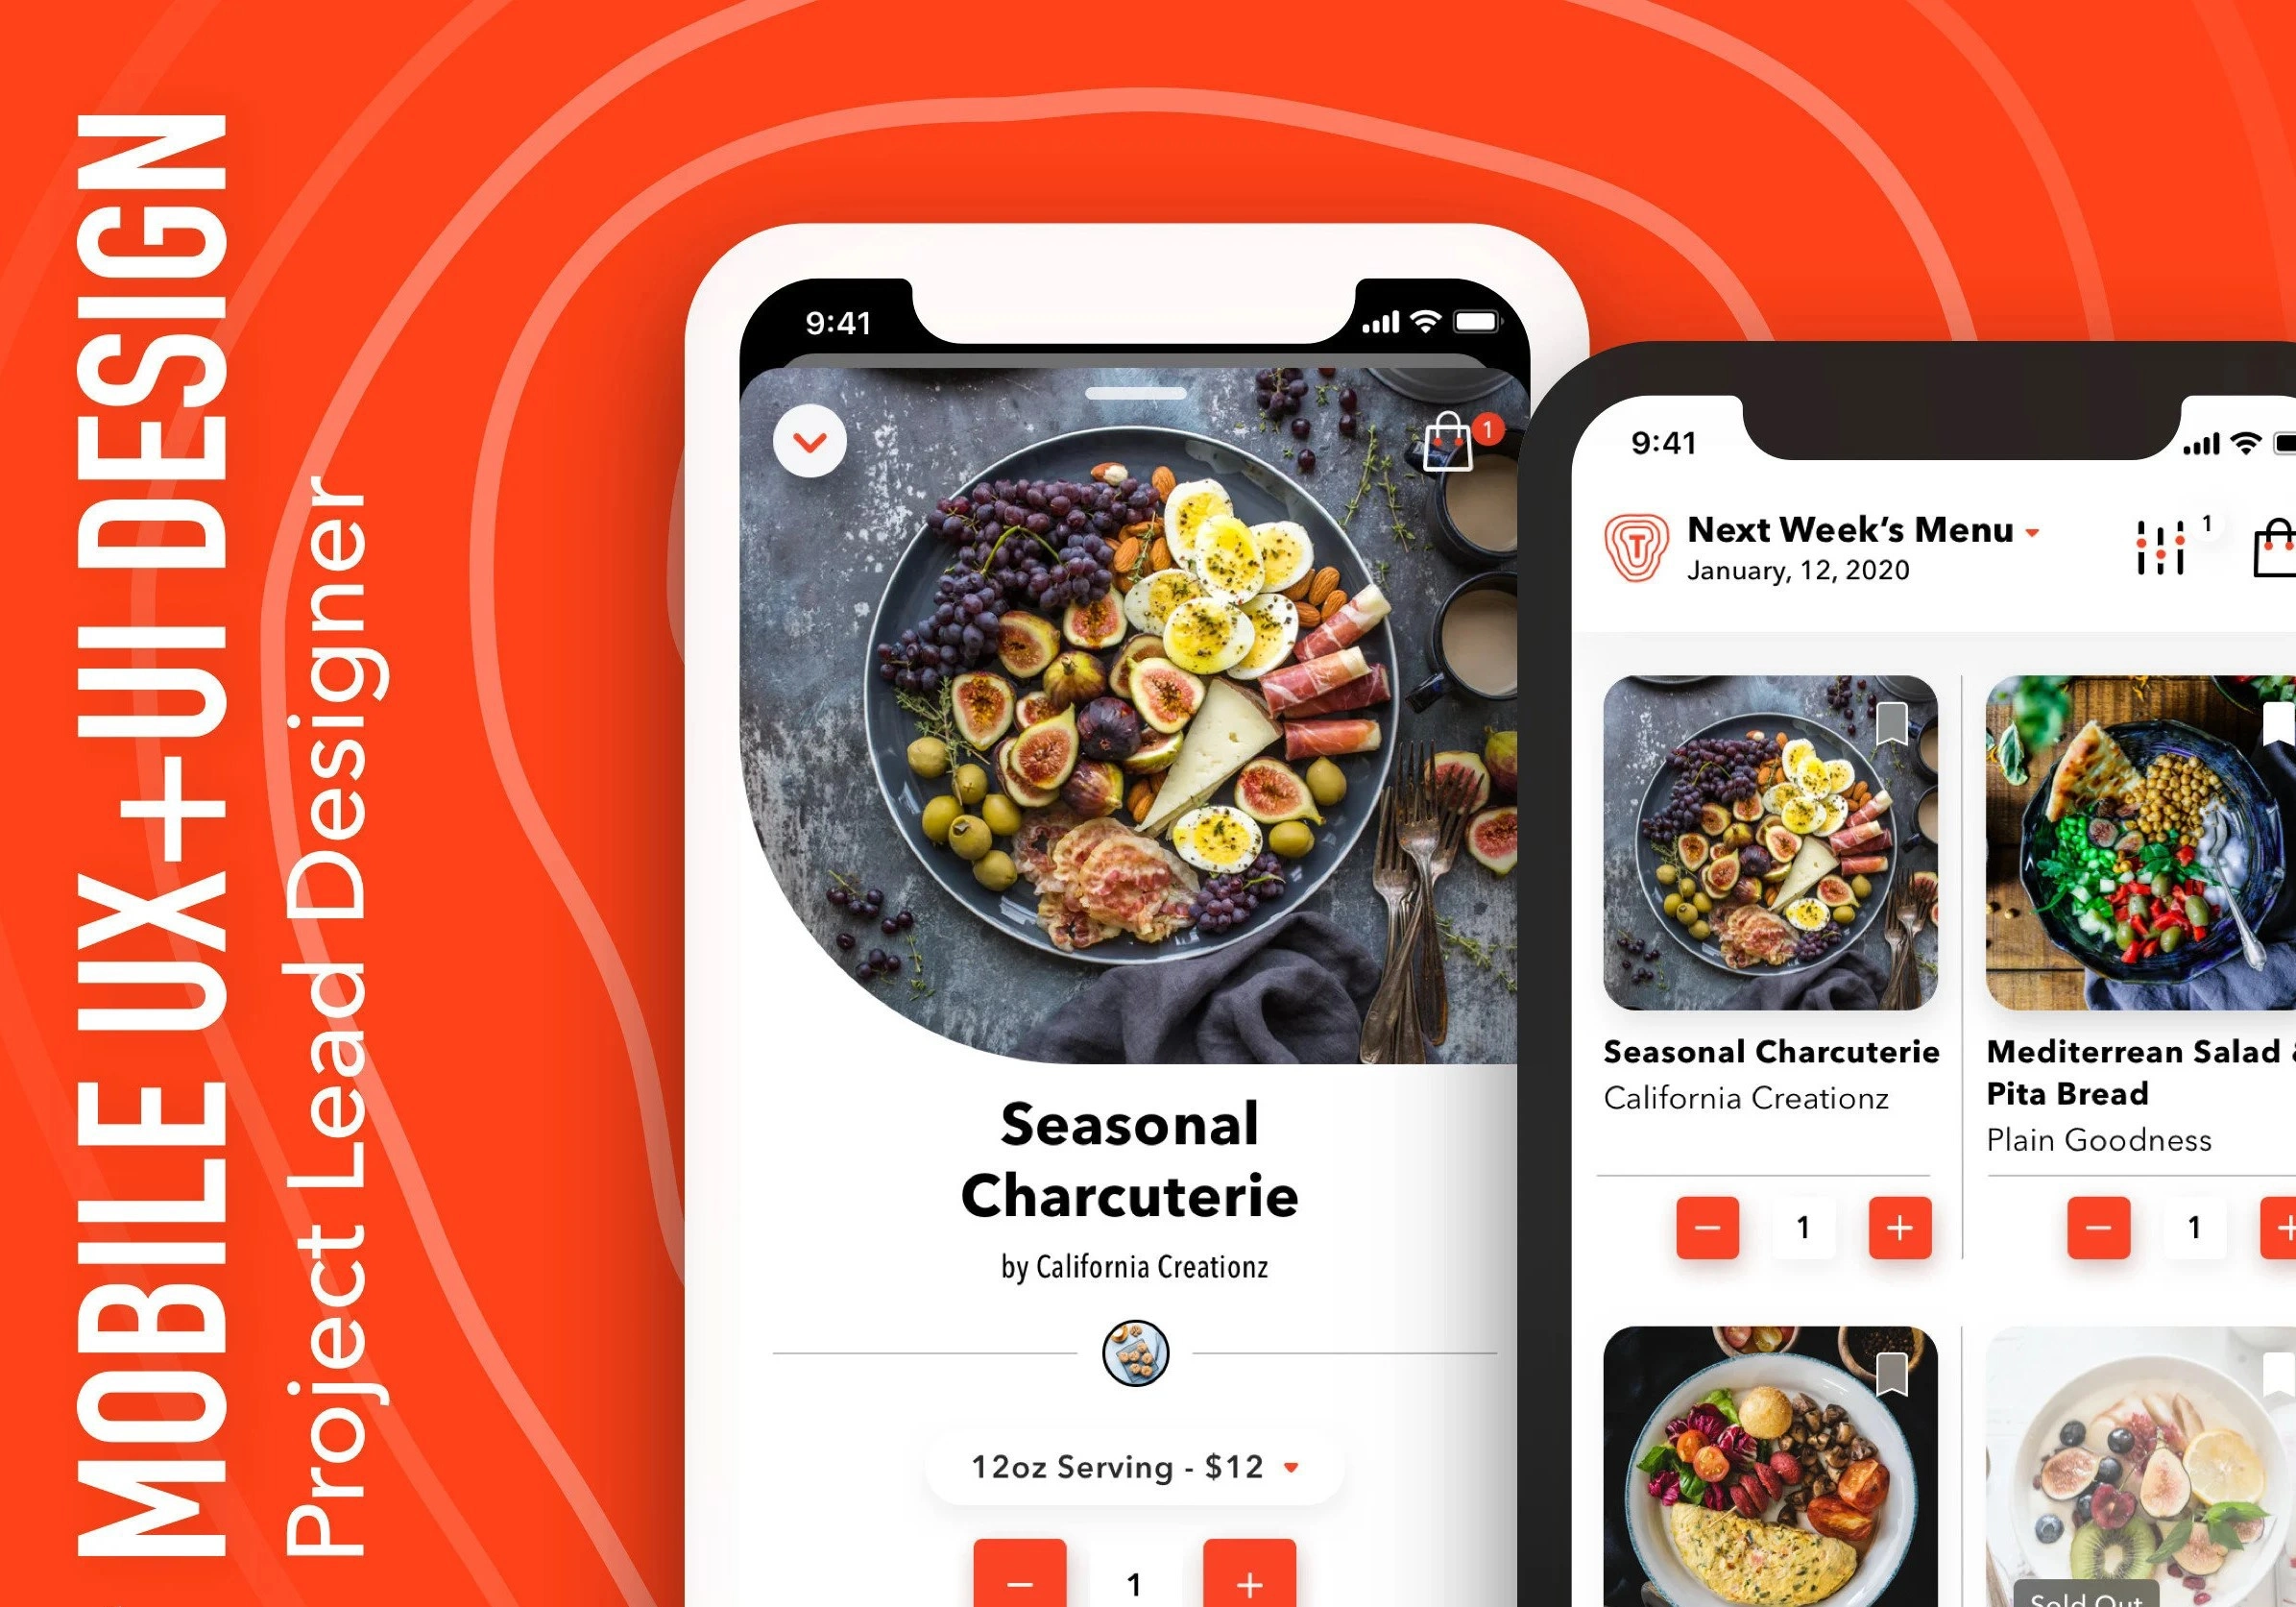
Territory Foods | Project Lead Designer
Boluwatife Okanlawon
Background
My Role
As a senior designer (project lead), I was tasked with bringing Territory Foods (at the time the company was called Powersupply) to mobile, where my work necessitated:
-Collecting and documenting feedback
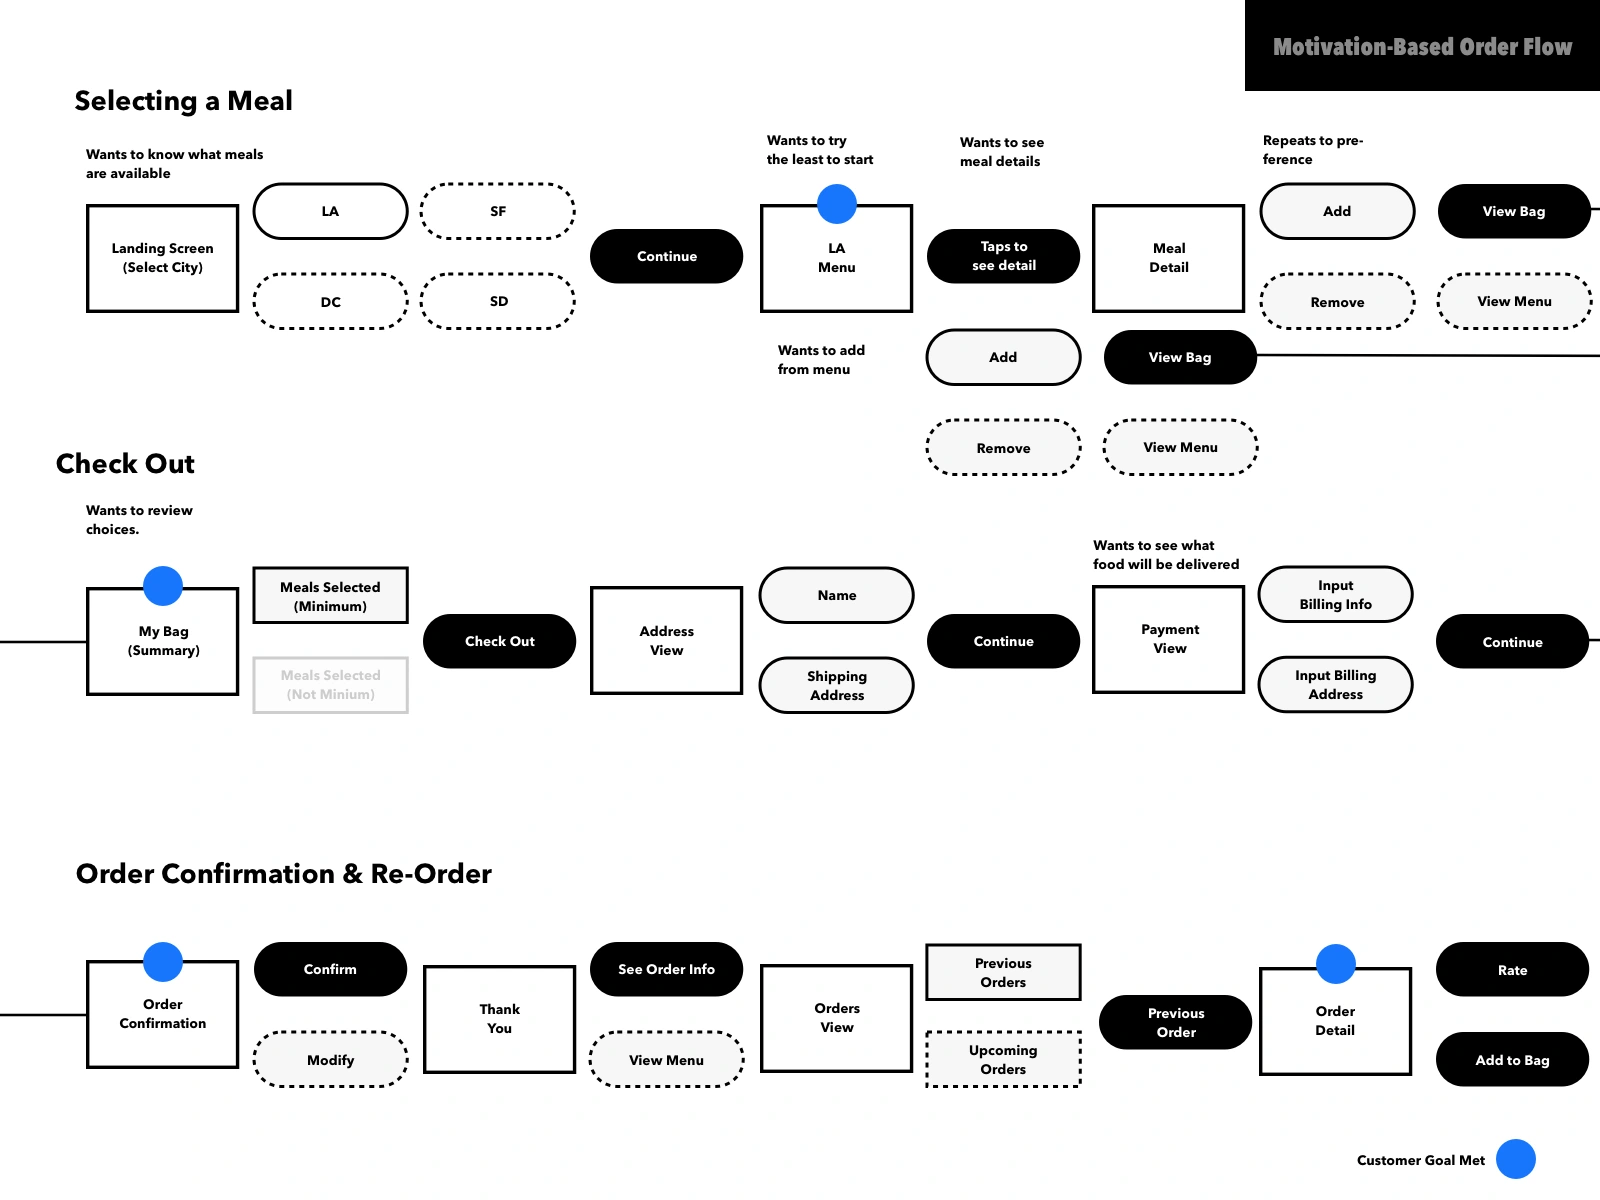
-Mapping user journeys
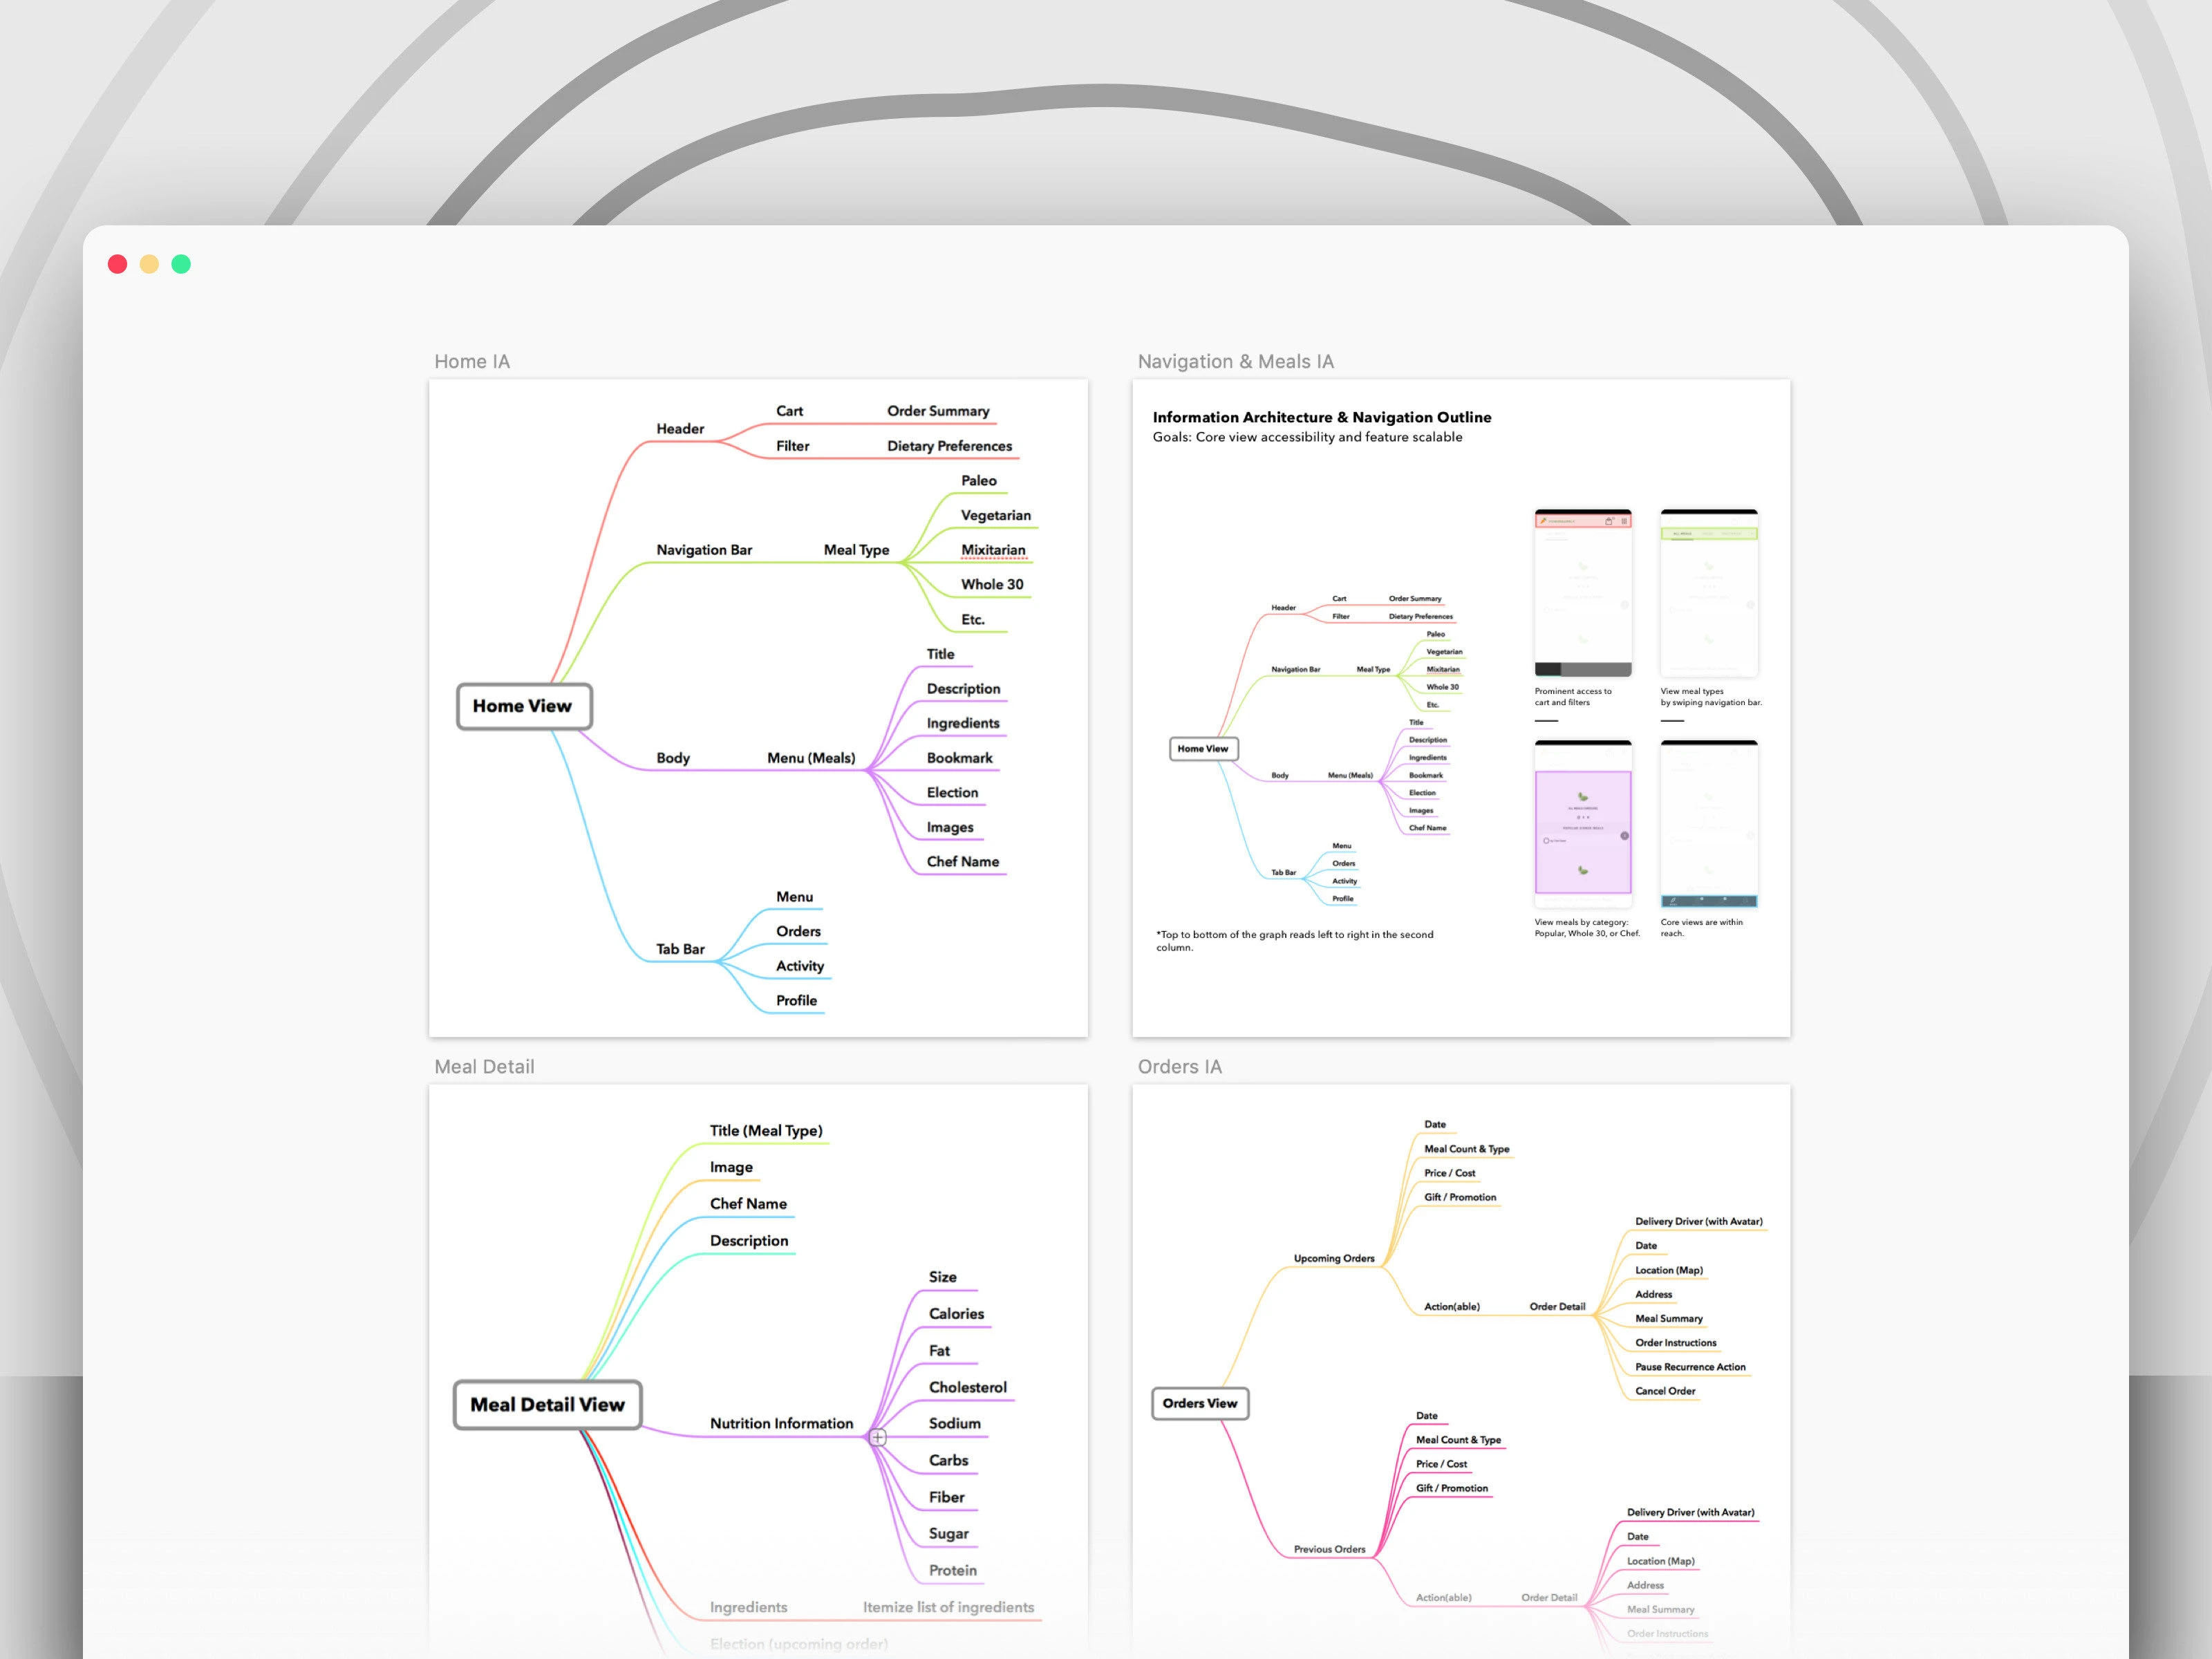
-Information architecture
-Scope documentation and feature prioritization
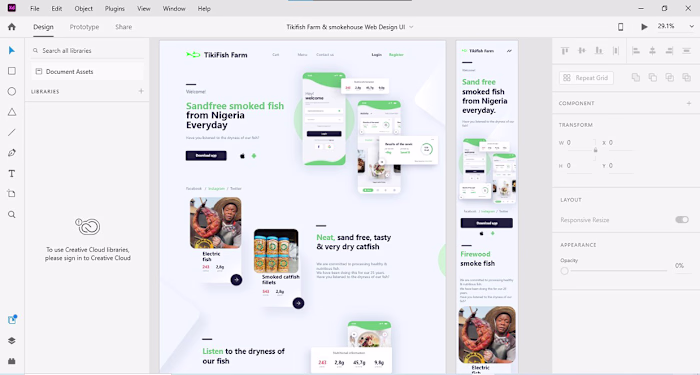
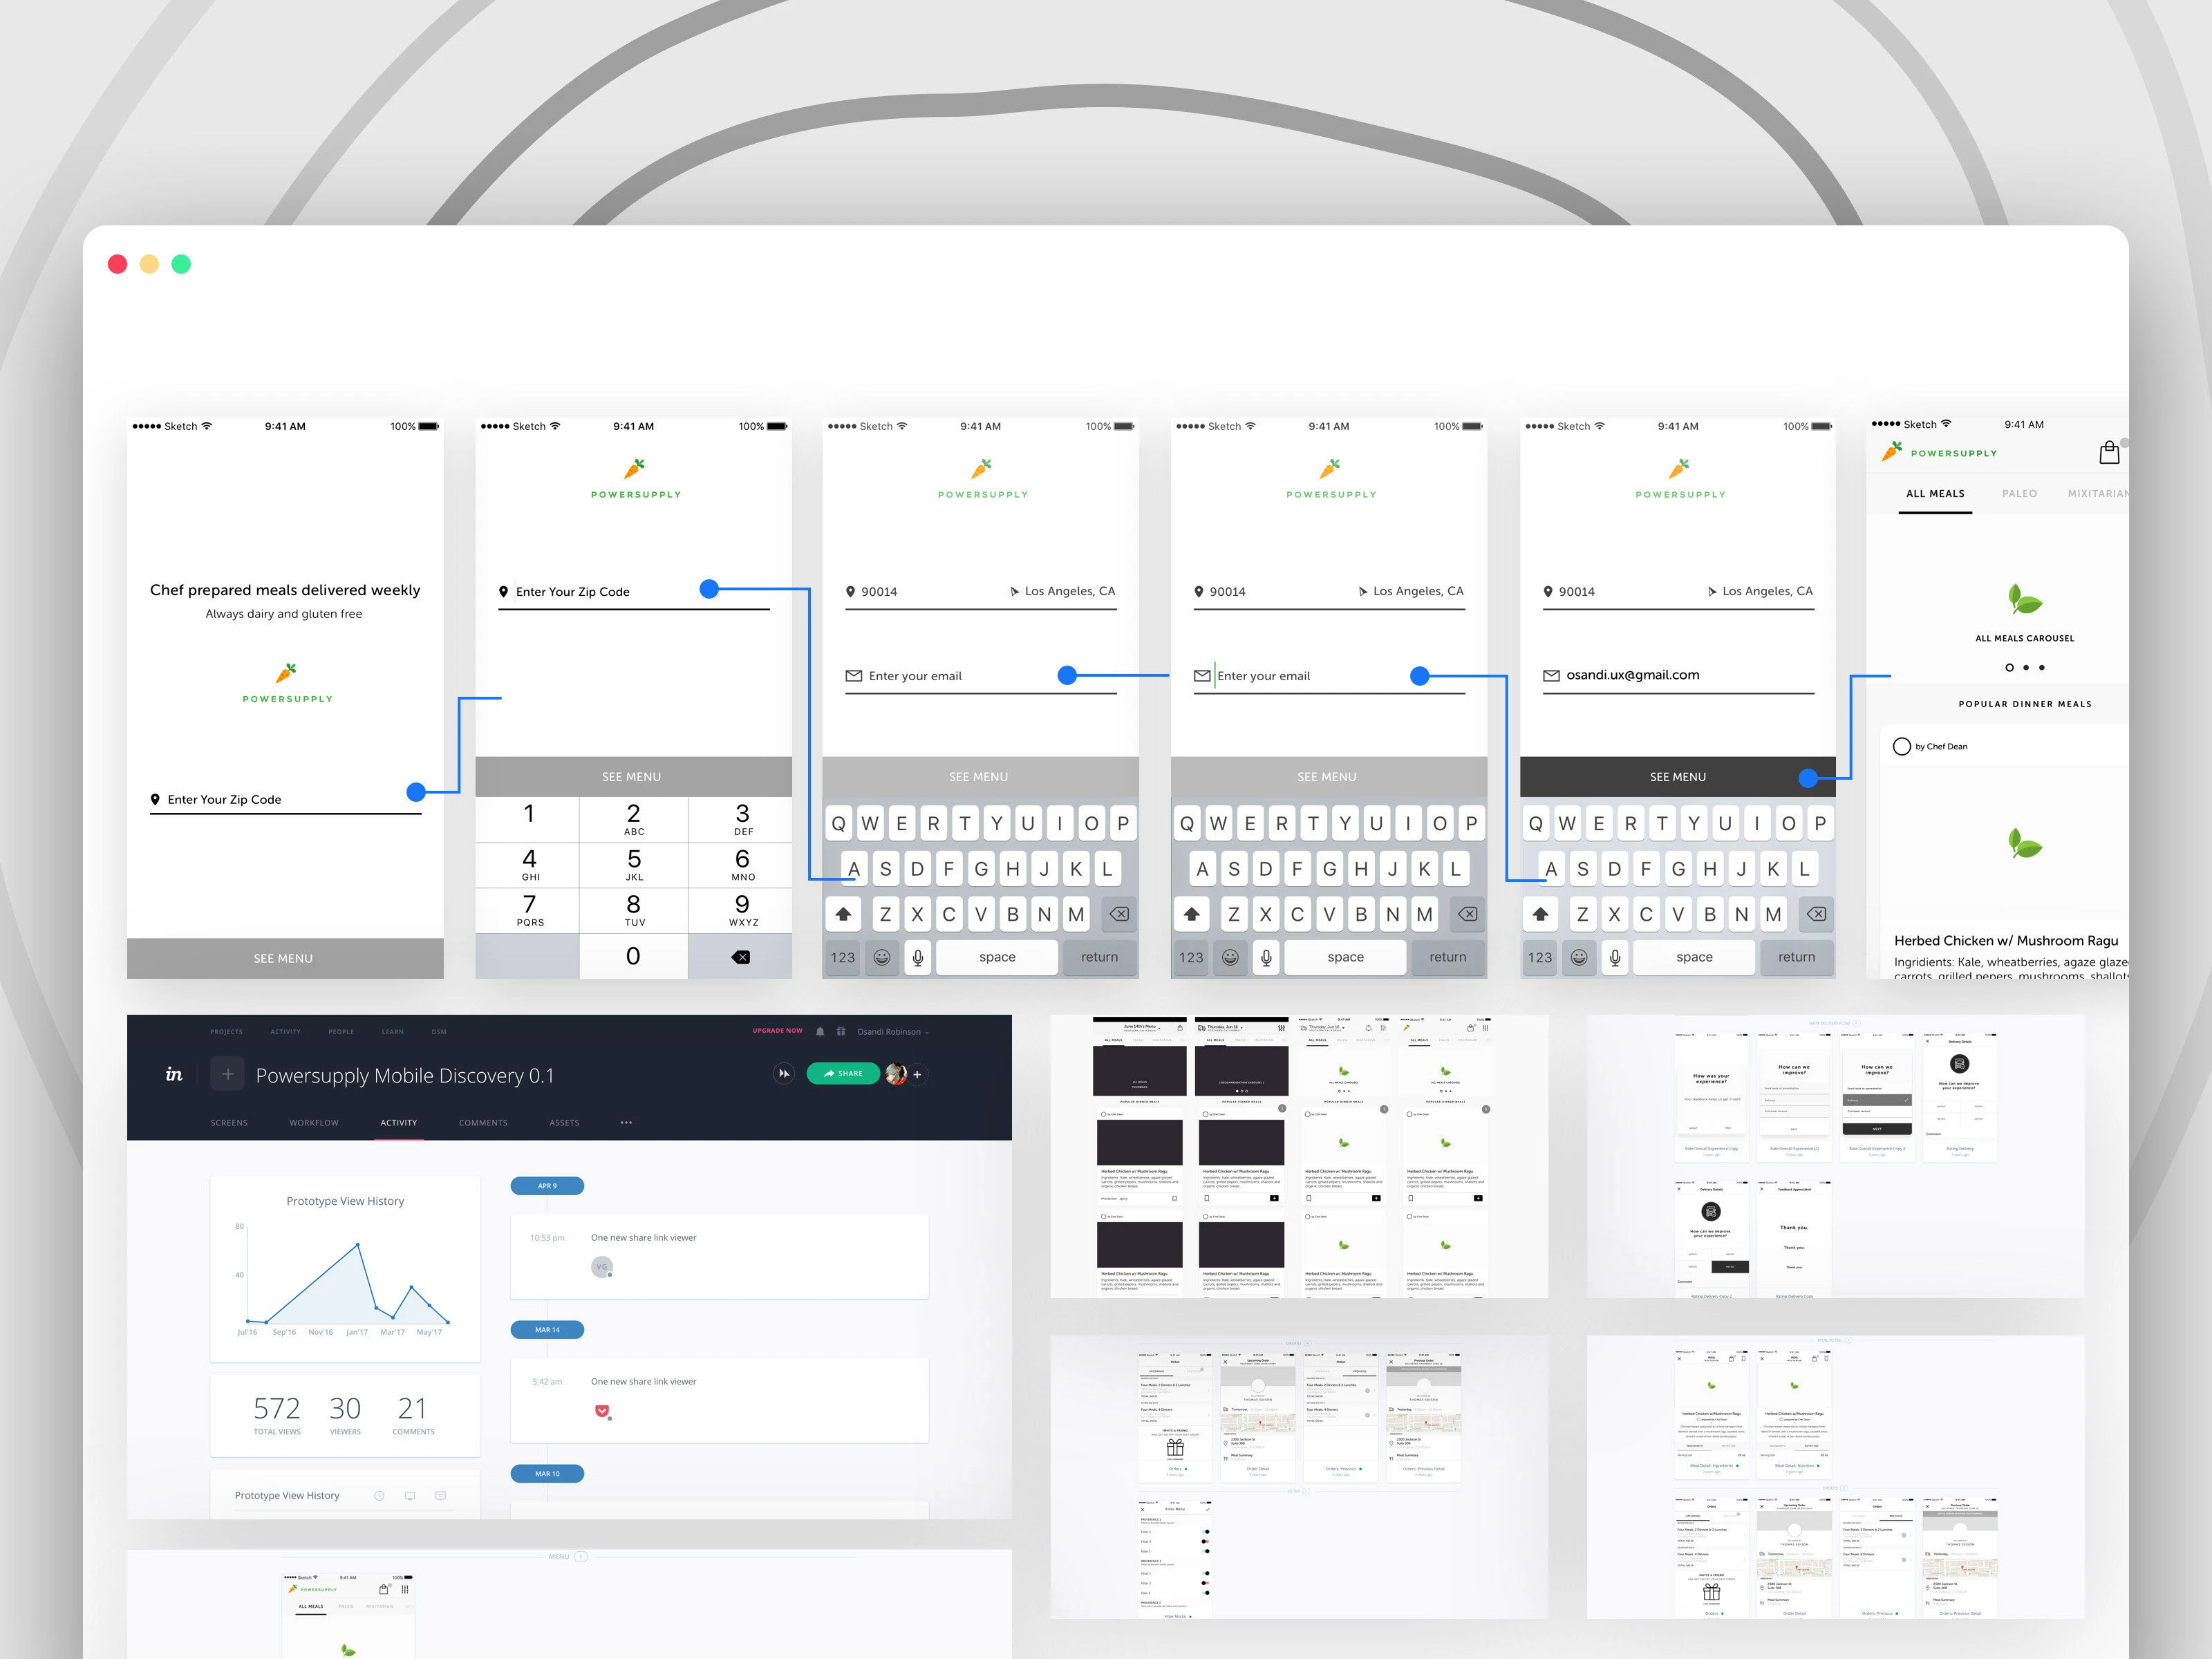
-Wireframe design
-User interface design
-Rapid prototyping
I worked with five engineers and a product owner and engineer as a distributed team over two timezones.
Constraints would weigh the decision to postpone a mobile application given a re-brand; the work would be the basis for the web UX.
You can see the original insights and product thinking here.
The problem
Situation
We needed a way to visualize what we learned from data and for the web experience to begin quantifying the friction points we observed in our web experience to frame our hypothesis.
I partnered with our growth engineer and the product owner to learn more about how our first-time customers experienced our product when placing their first and second orders.
Segment
We used this segmented group because the first two order experiences are where we experienced the most churn.
Outcome
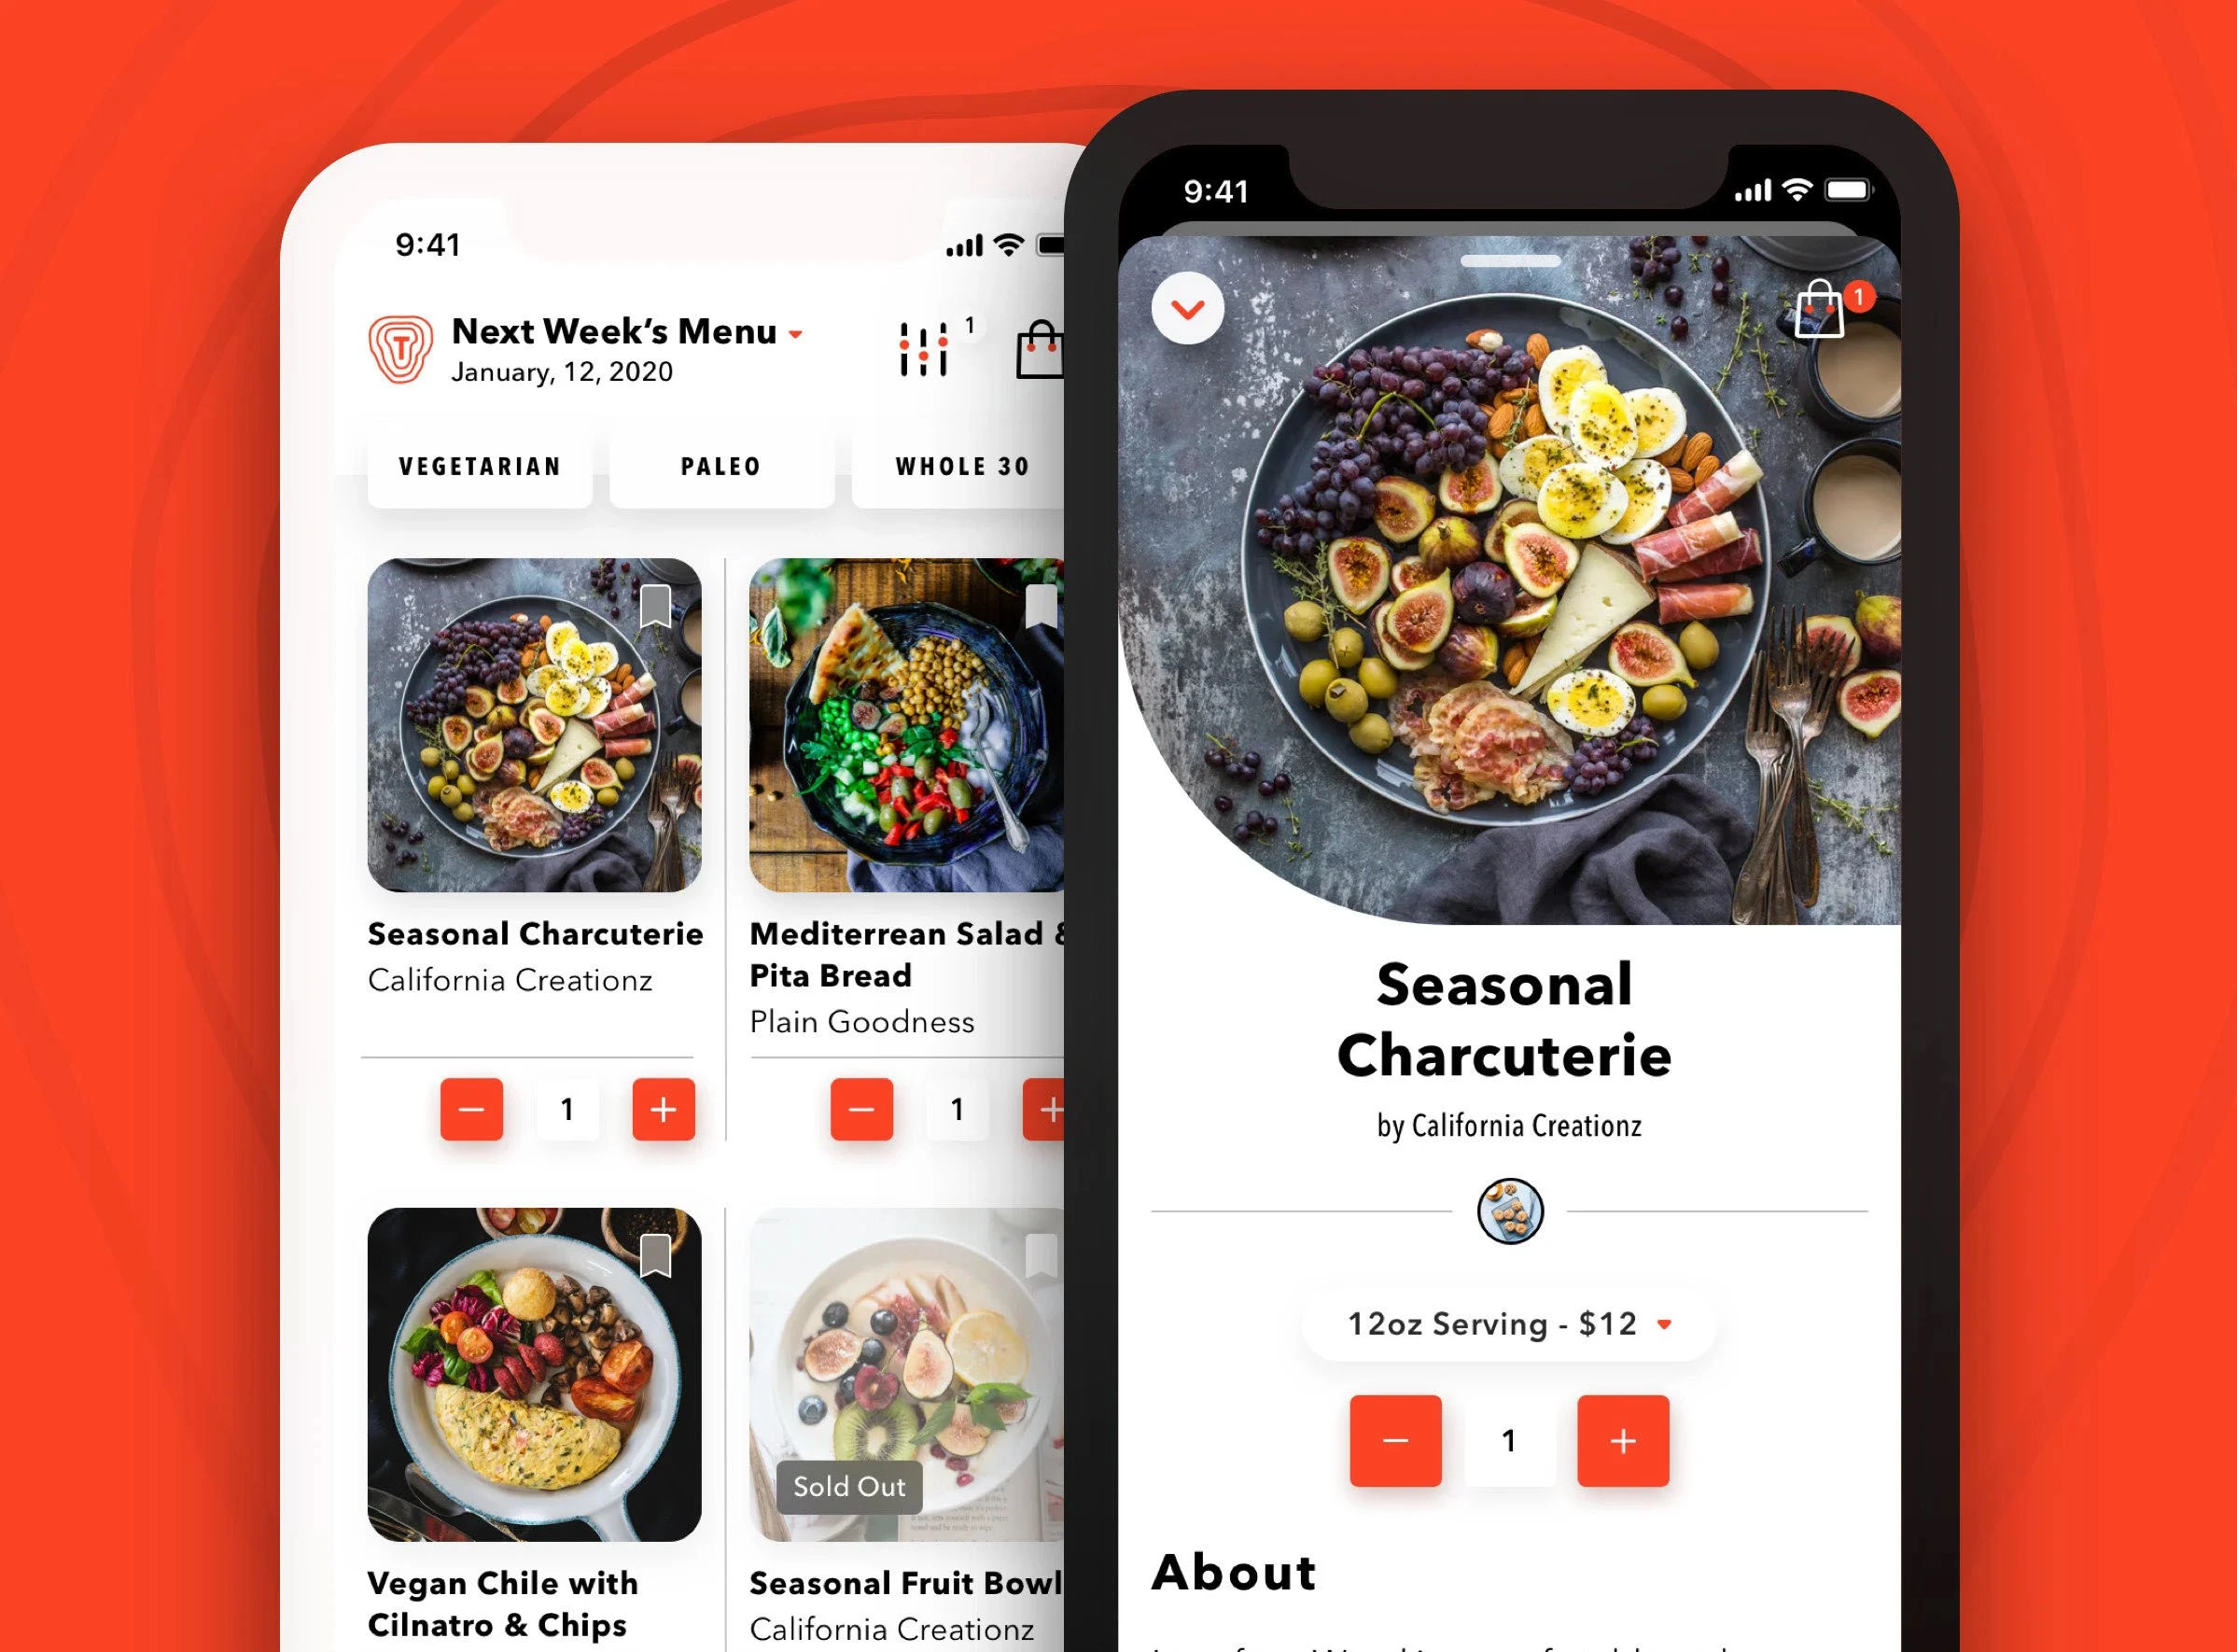
With data, customer feedback and usability tests, we learned that the biggest issues for new customers are finding food they may like and reordering the food they really enjoyed.
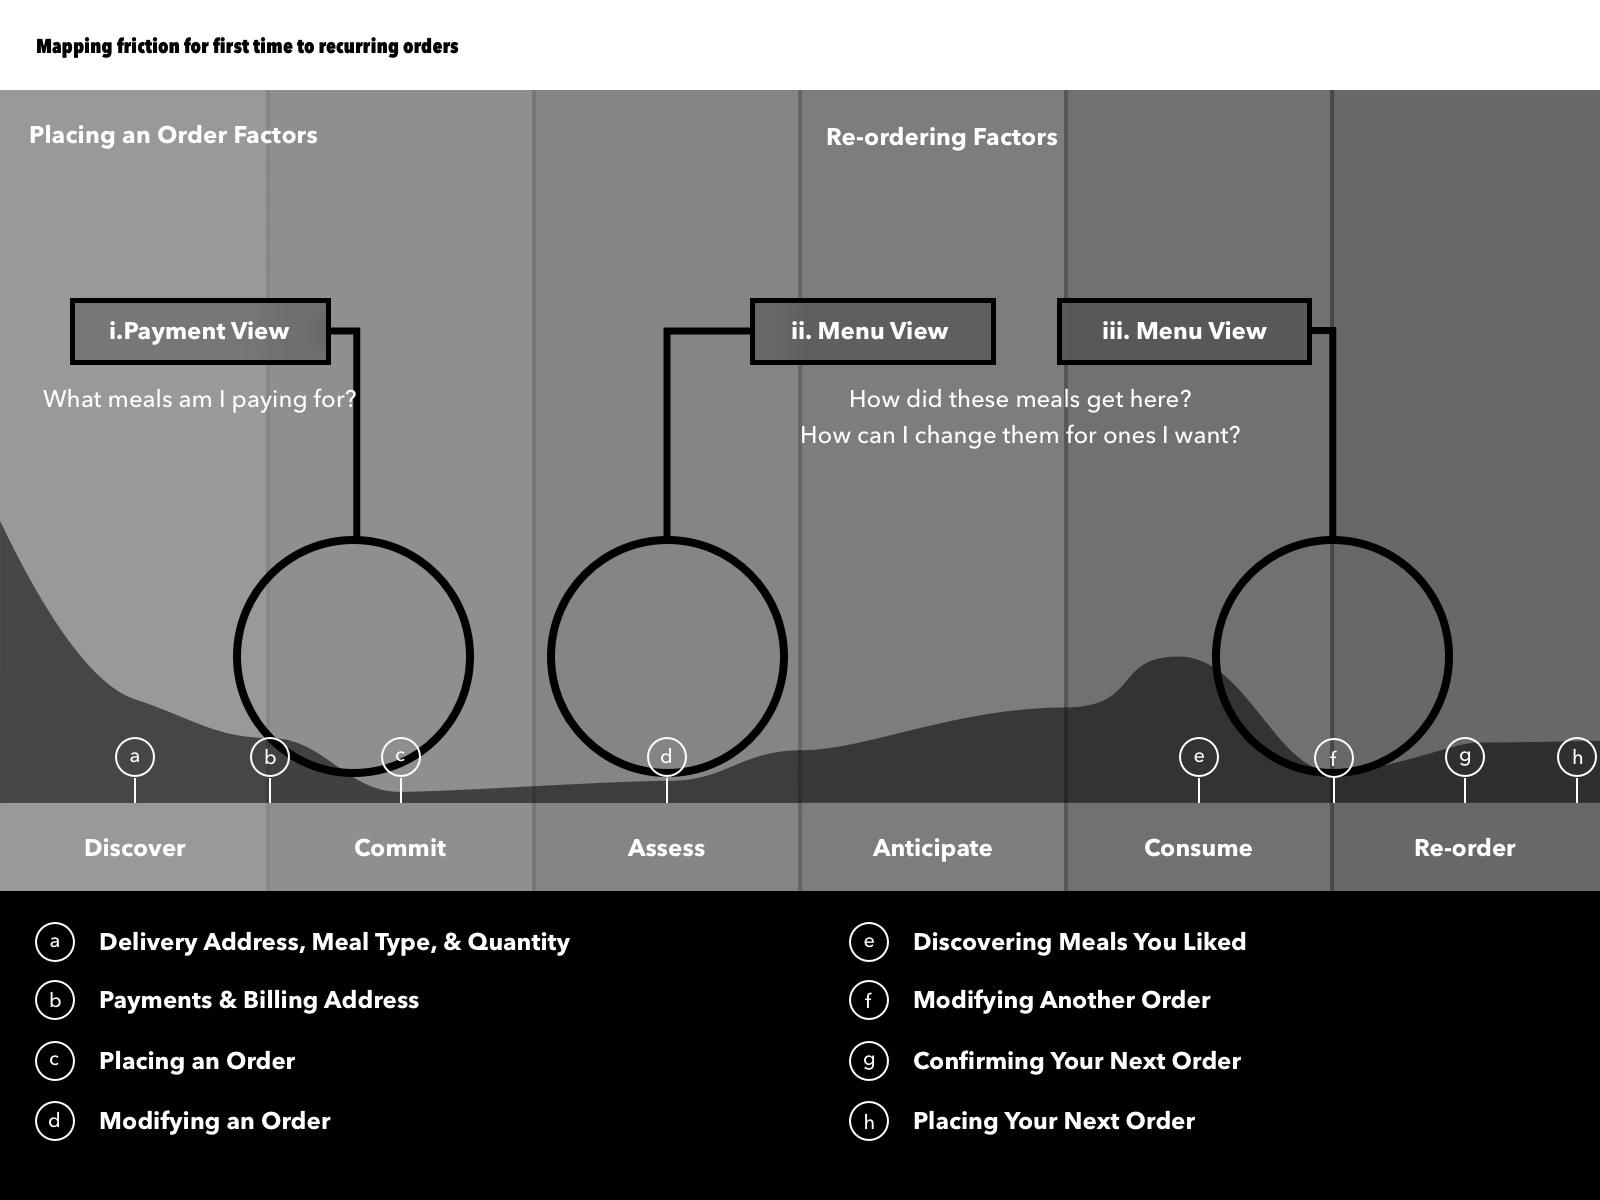
Displayed
Displayed is a graphic that displays the first-time customer journey for customers who successfully place their first and second orders, highlighting the views that create the most friction based on Google Analytics.
Like this project
Posted Feb 27, 2025
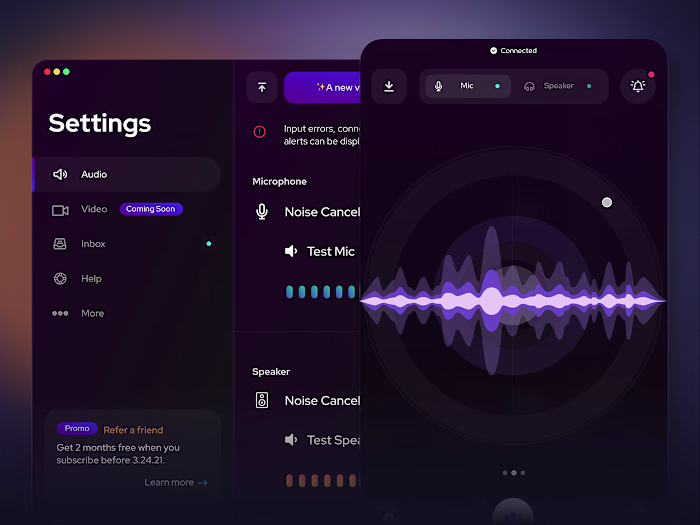
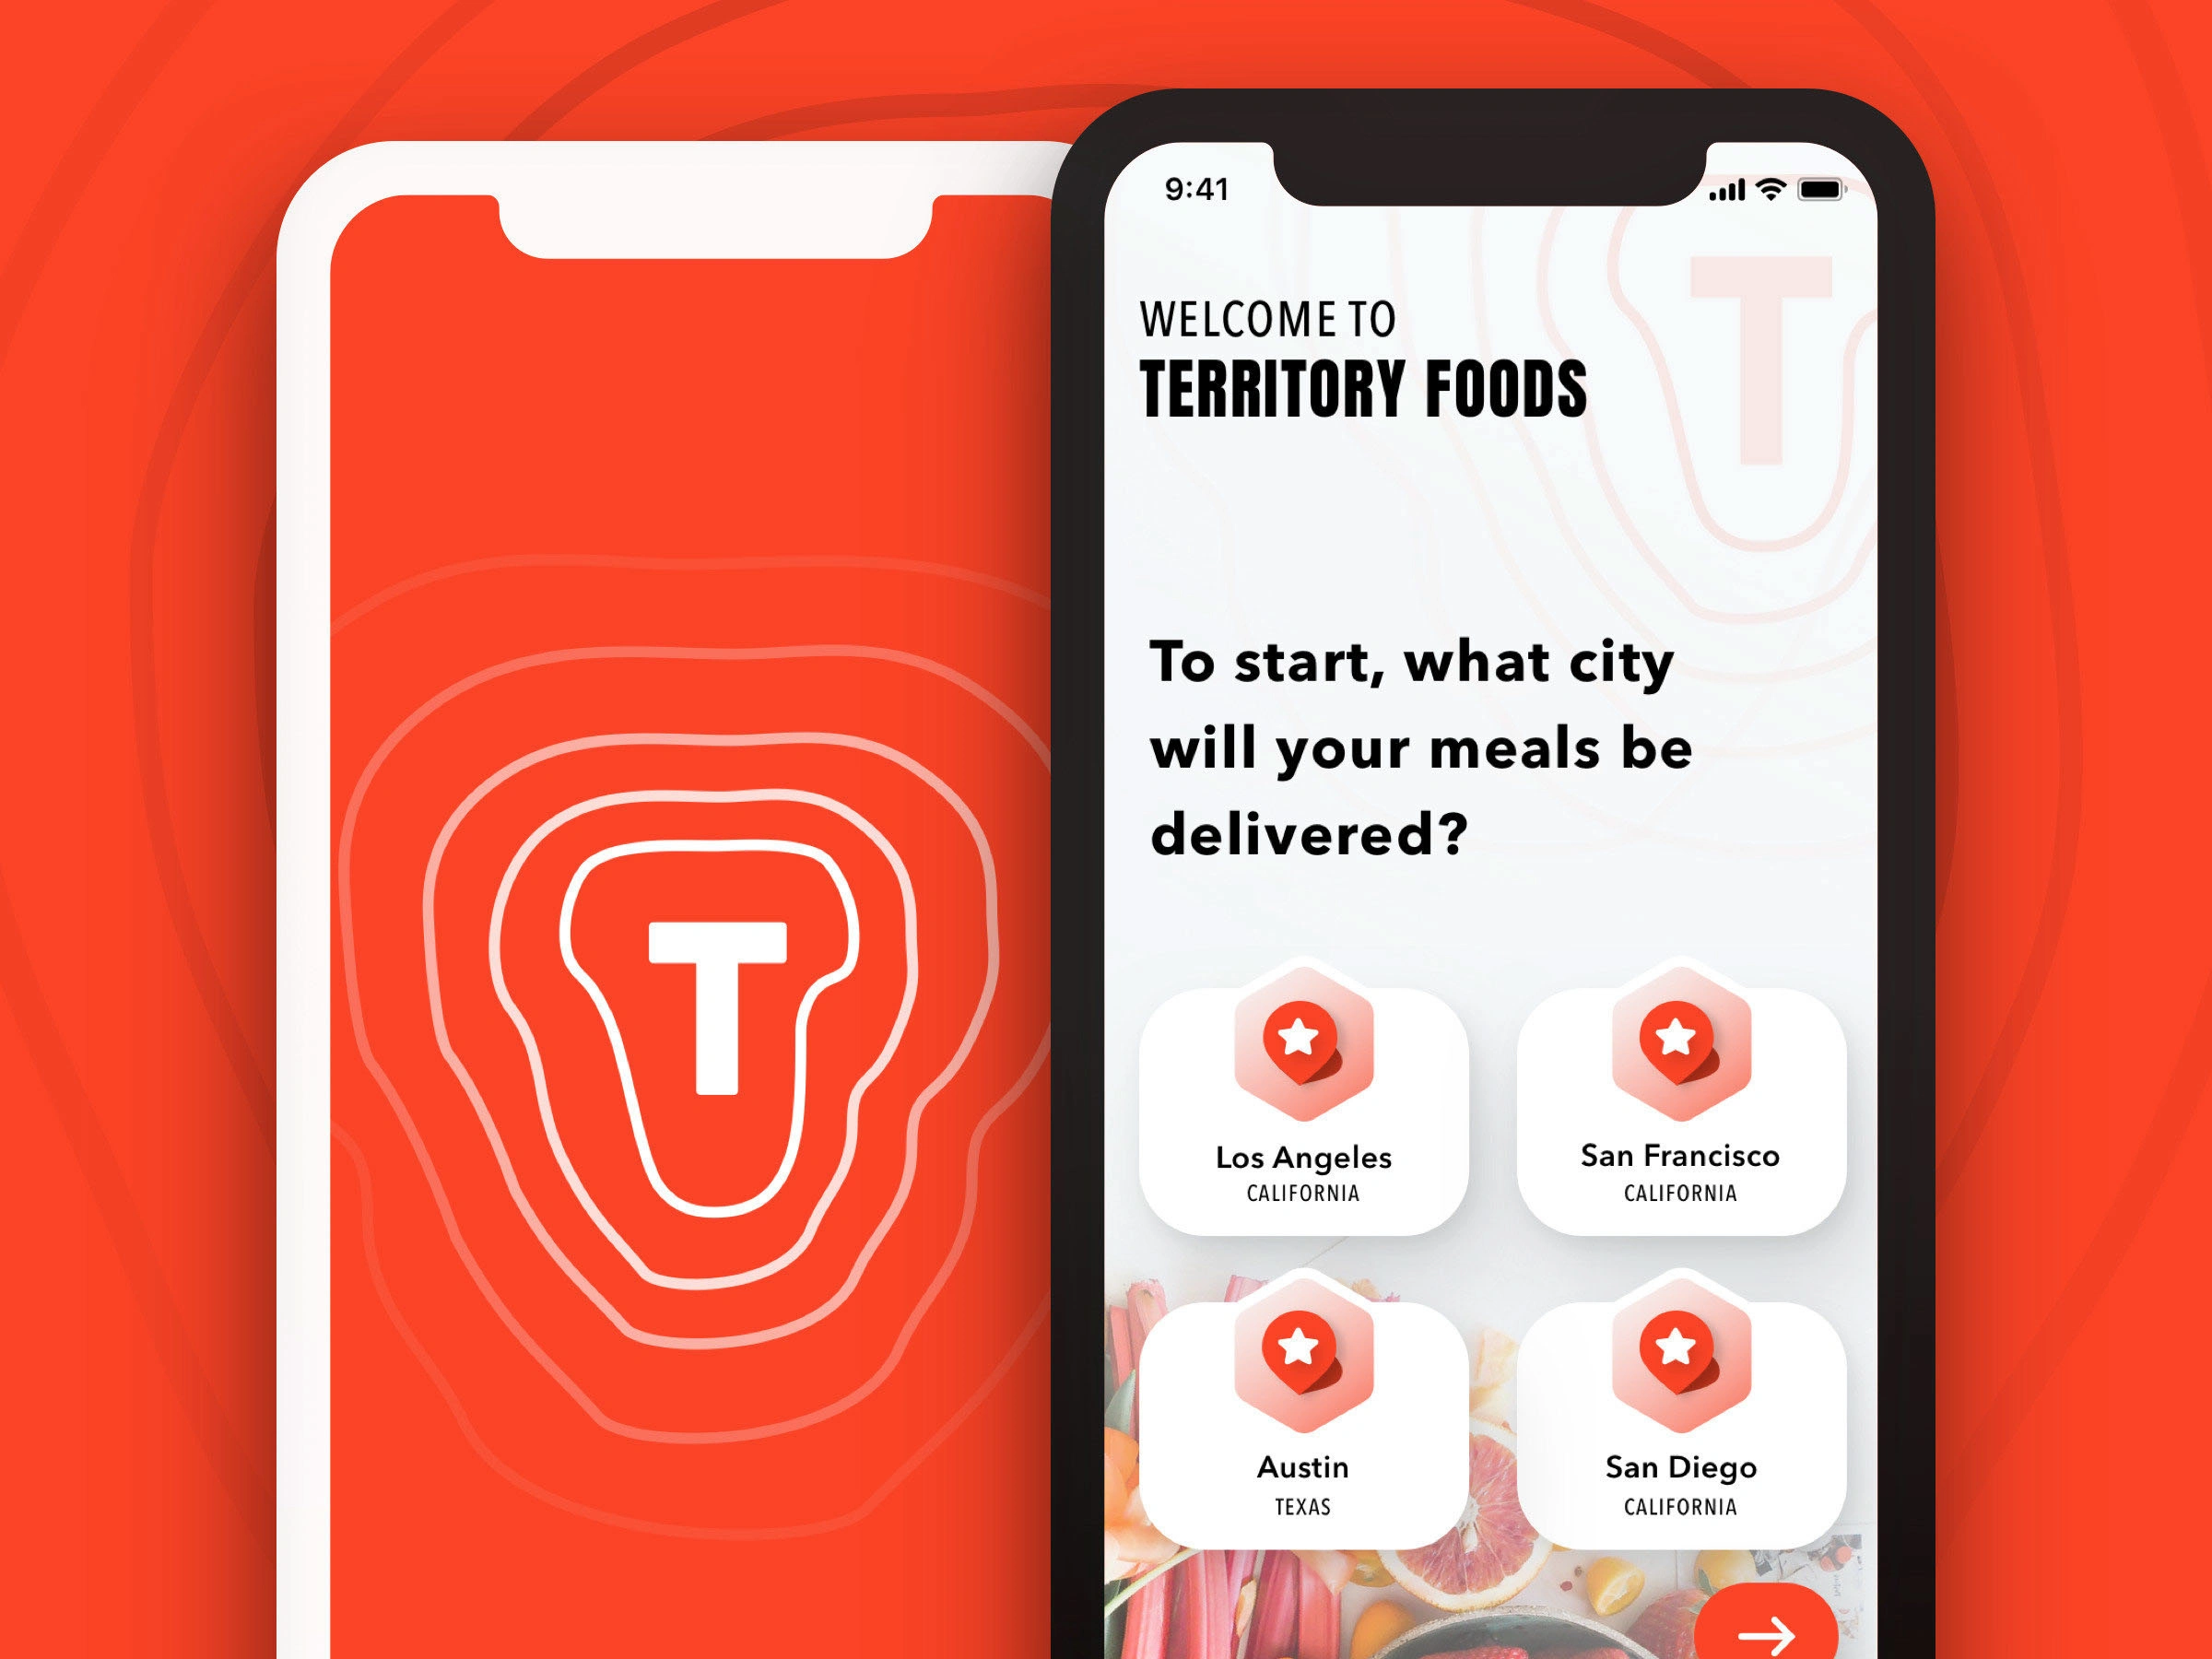
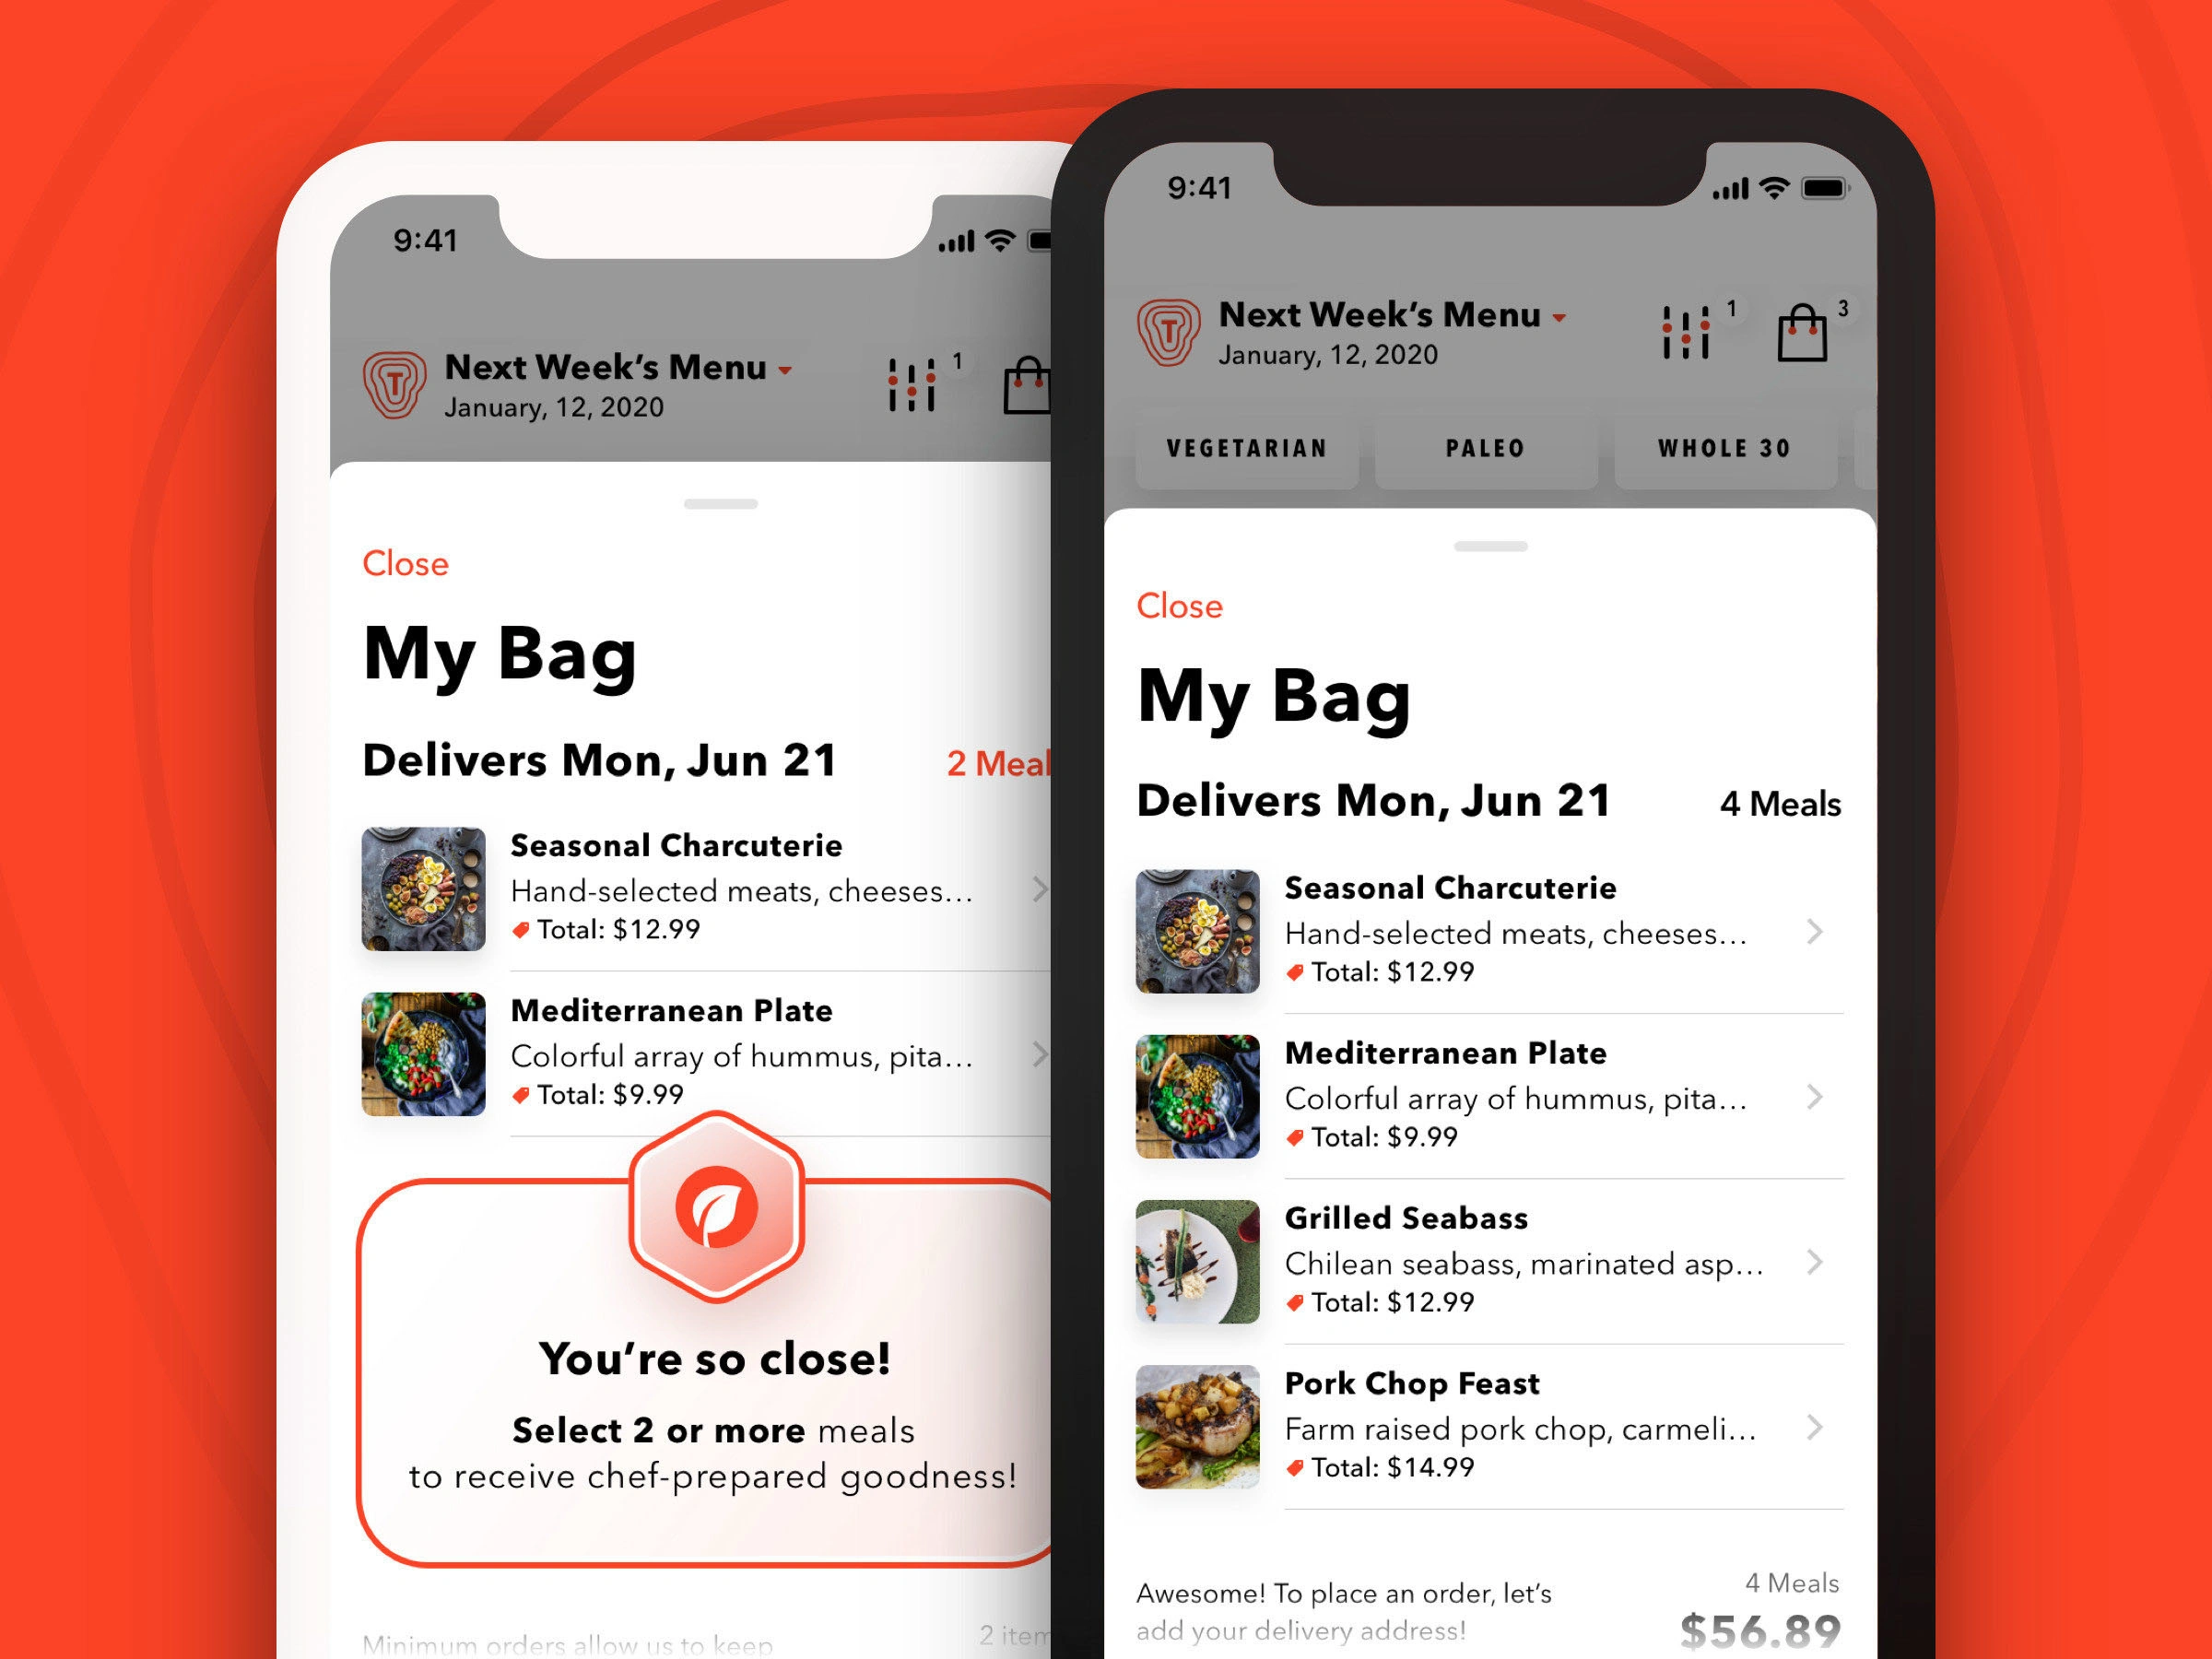
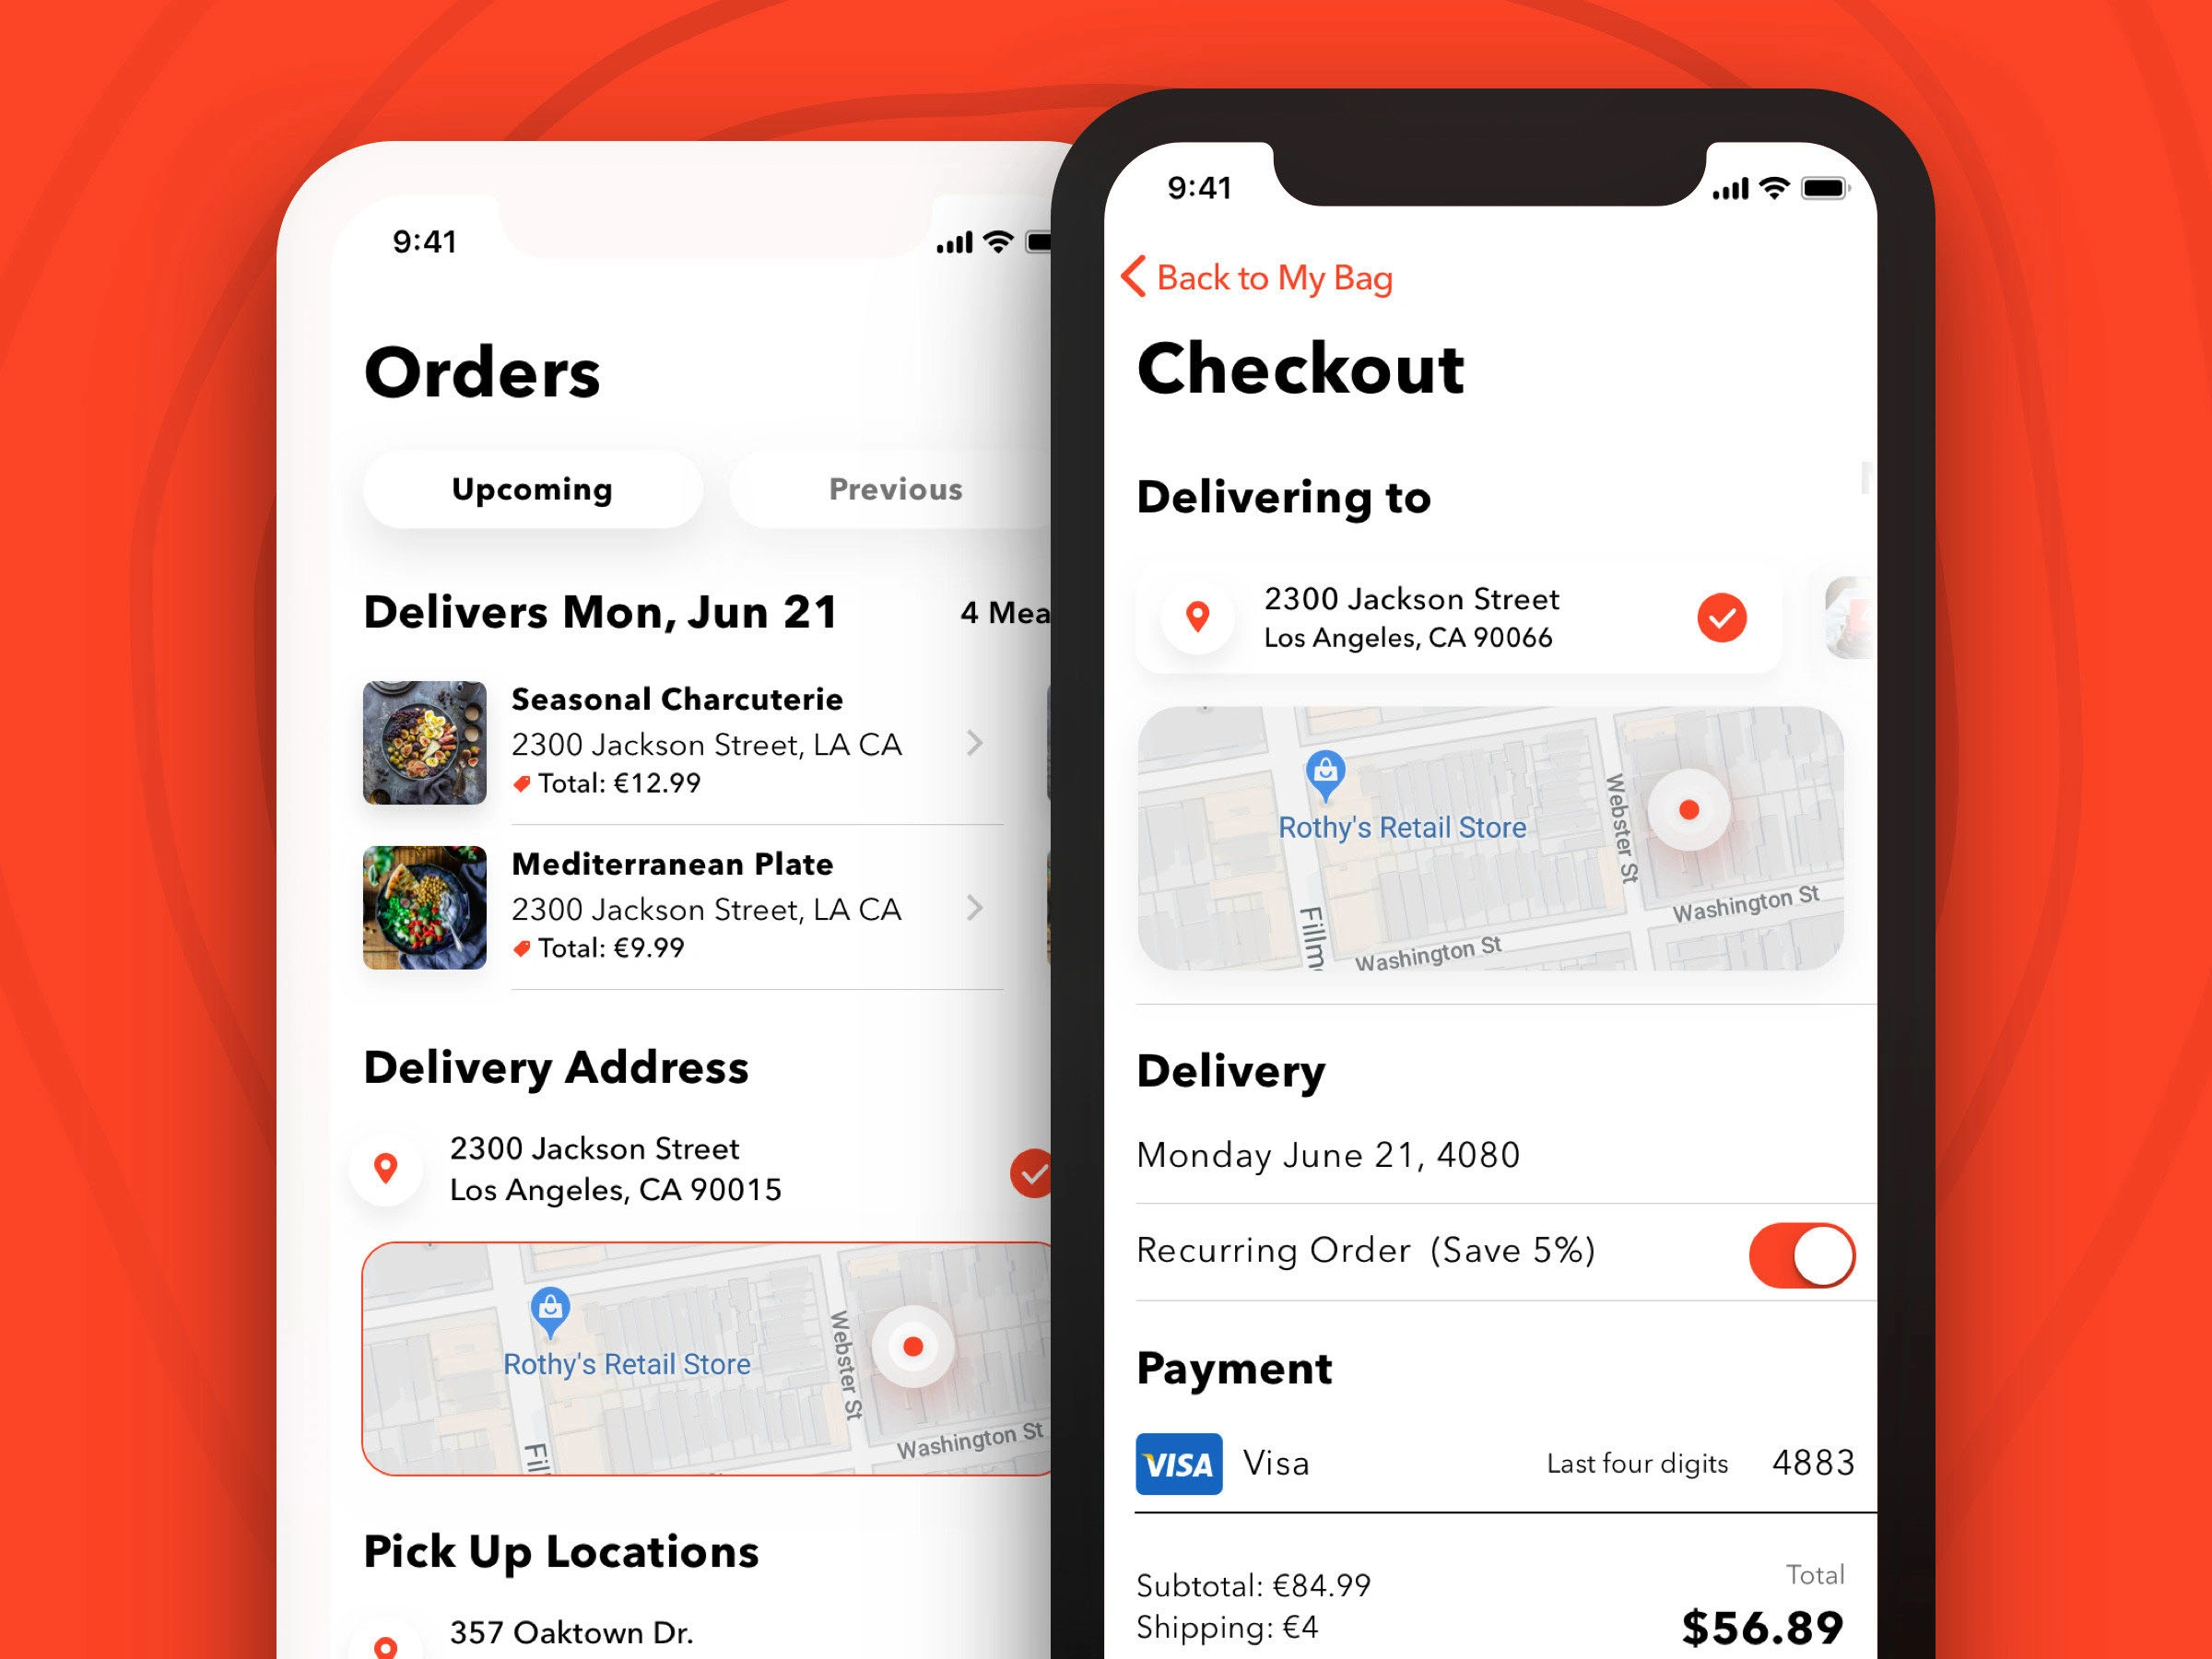
Redesigned Territory Foods’ mobile experience, simplifying onboarding and meal selection, boosting user retention and reducing order drop-offs.
Likes
5
Views
7