UI/UX Design for Greenprint Financial App
Jawad Khan
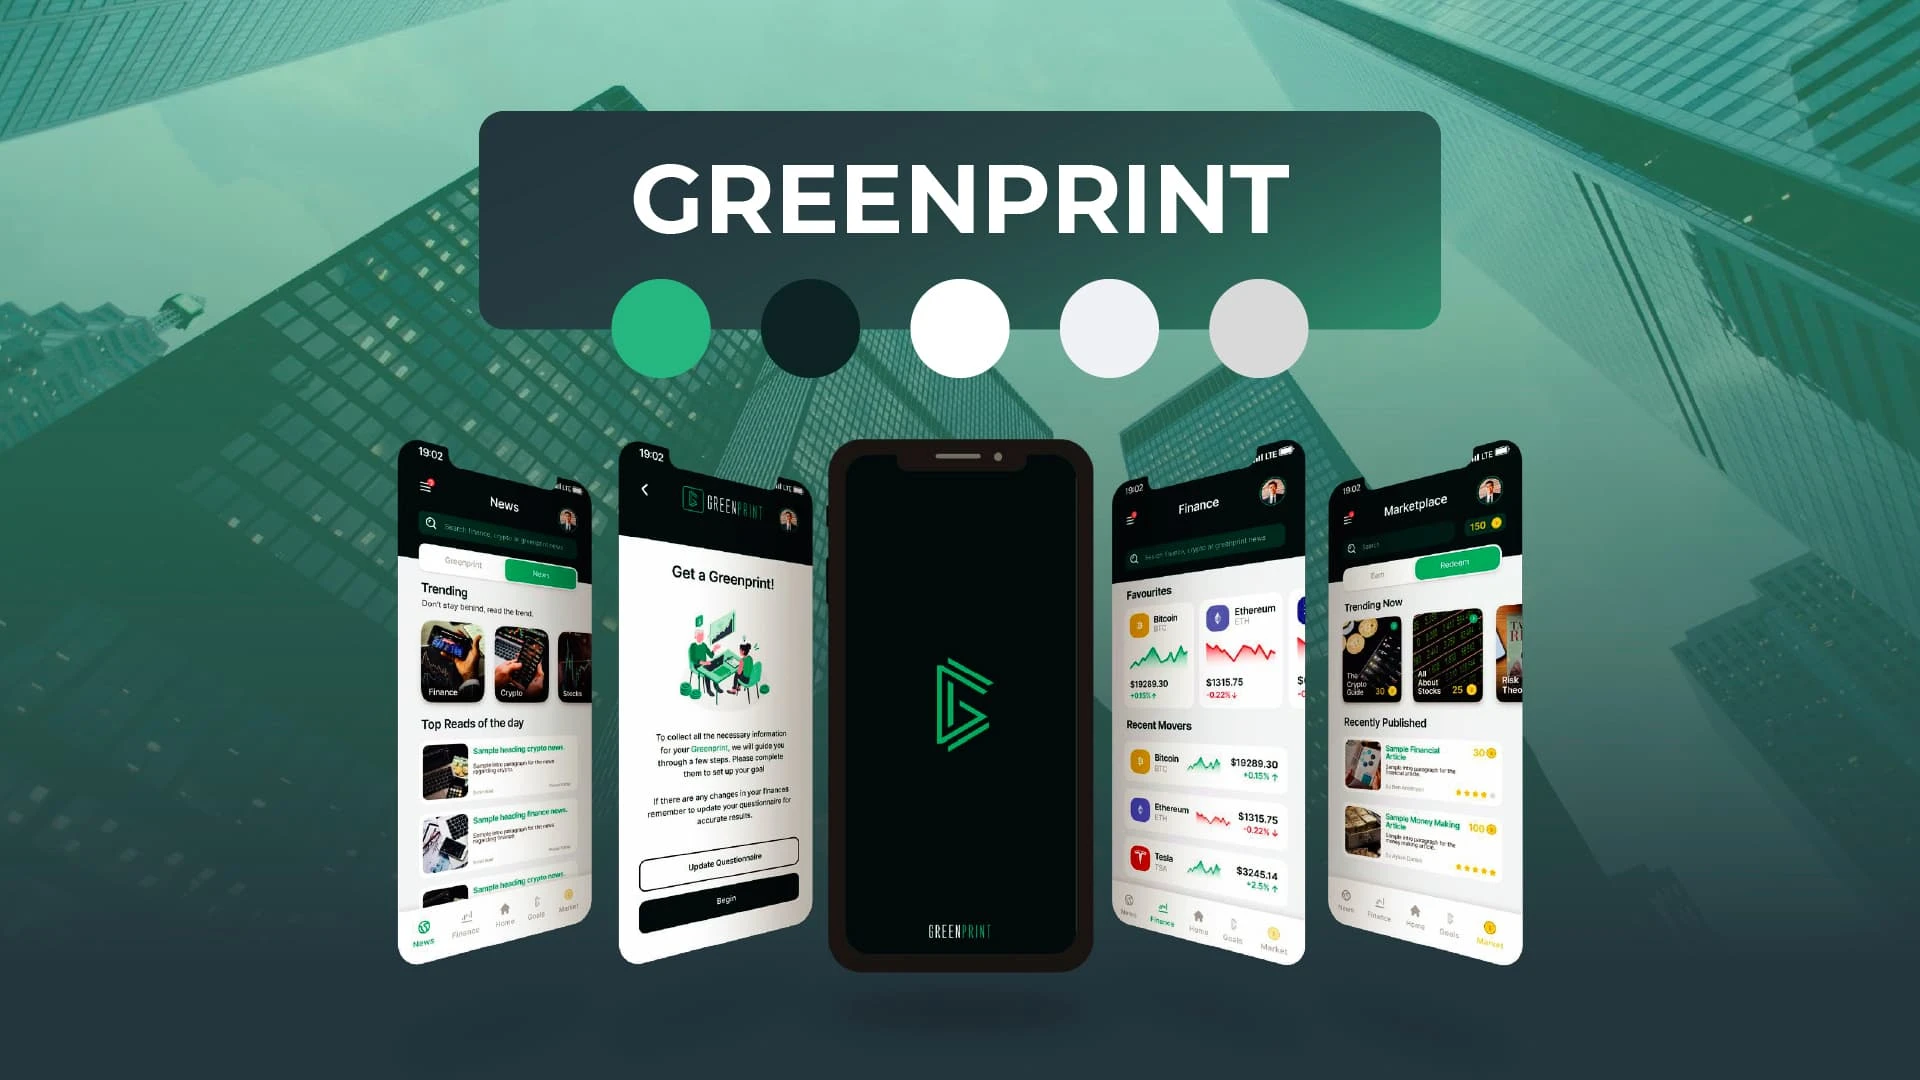
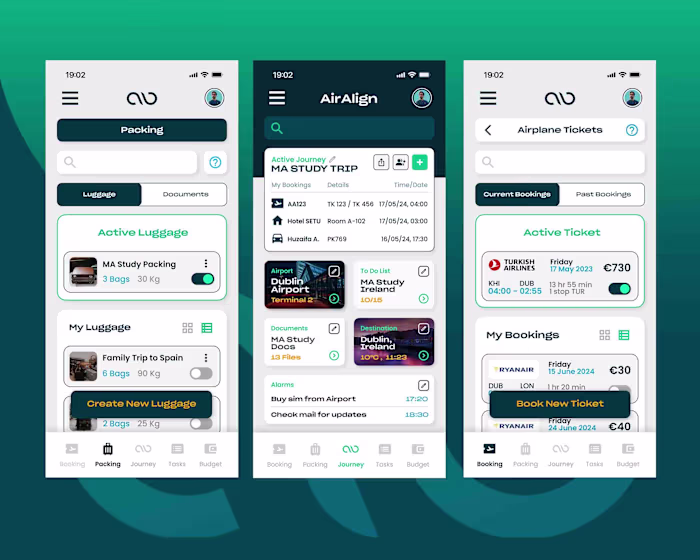
Greenprint is a comprehensive financial management app that consolidates various finance categories and displays their amounts. It also includes wealth check-ups and goal-setting features. The client provided basic wireframes for a few pages, and I enhanced these designs, creating 50+ mobile screens and web screens for the admin dashboard.
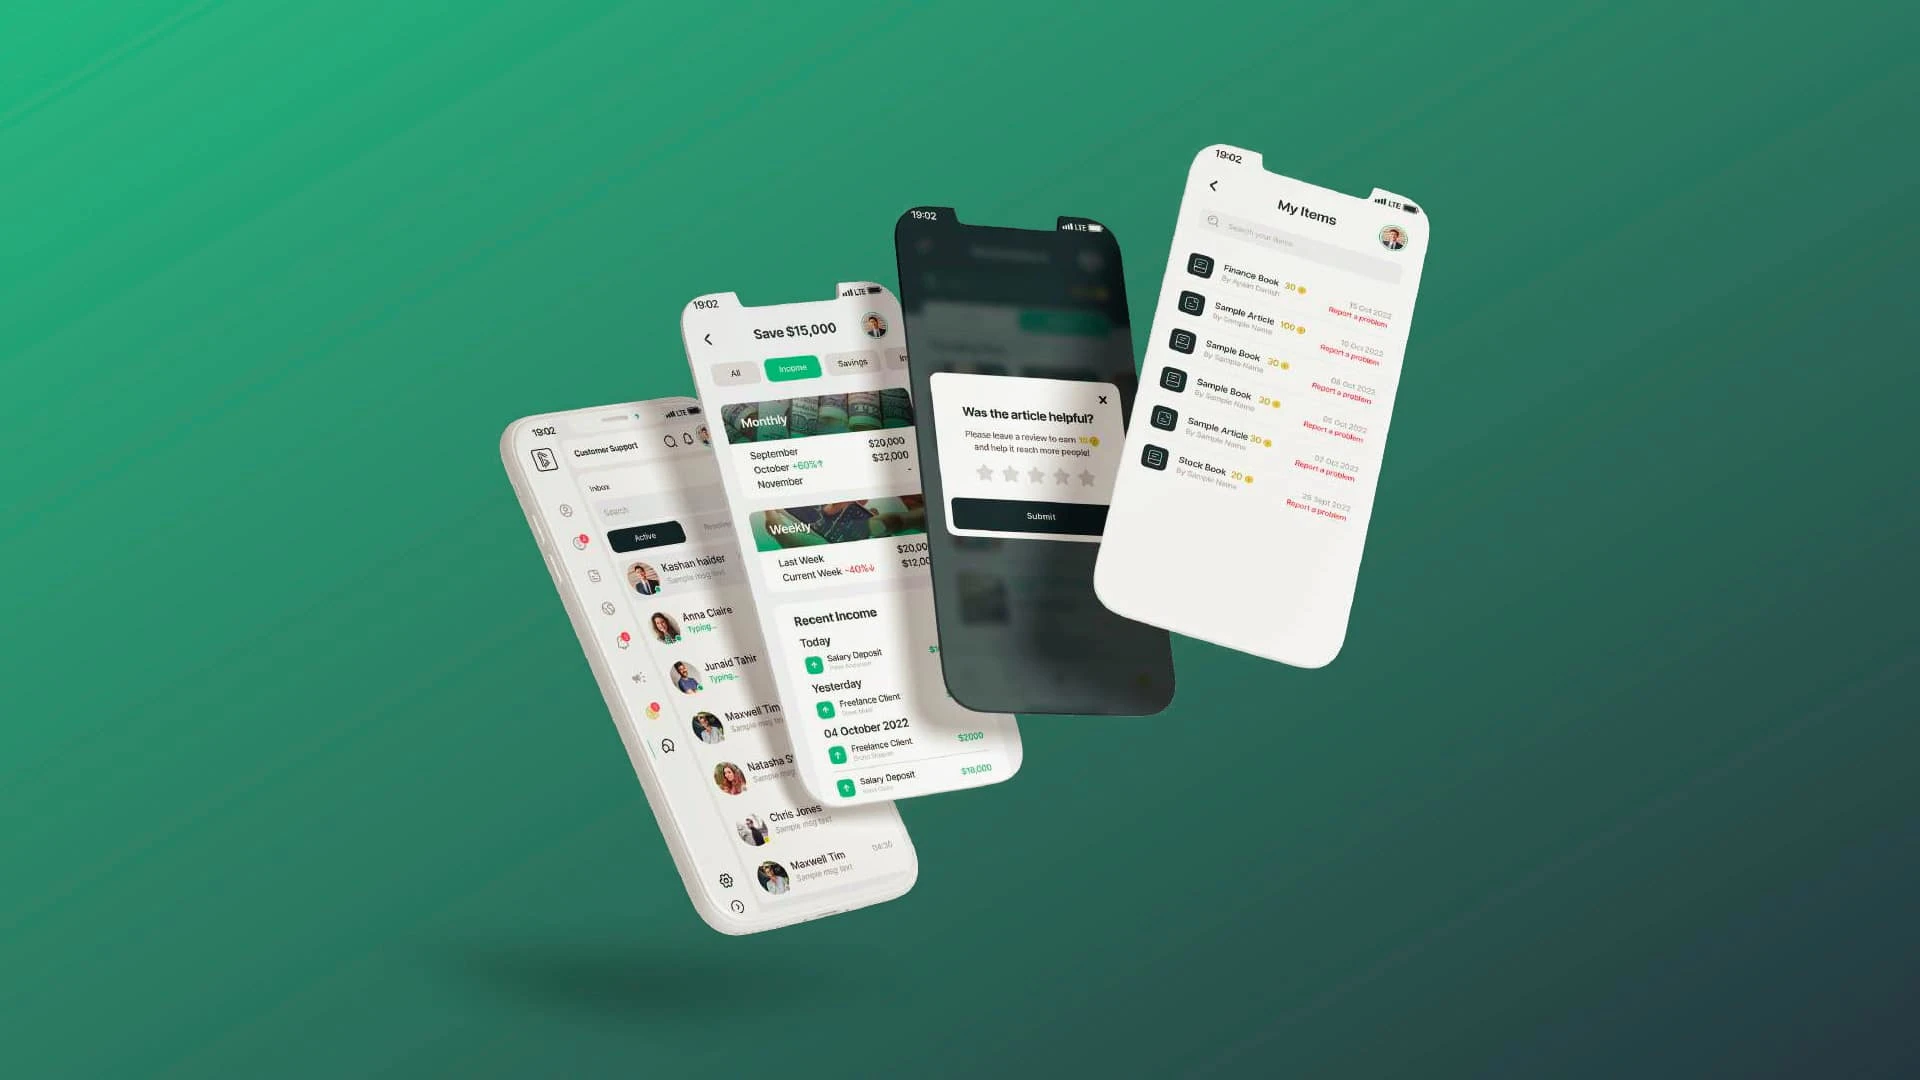
Homepage & Transactions
The homescreen needed to have all the necessary information while also not being overly crowded with information. The wireframe requirements included graphs and transactions to be displayed. The client later wanted categories of transactions to be displayed on the same page as well.
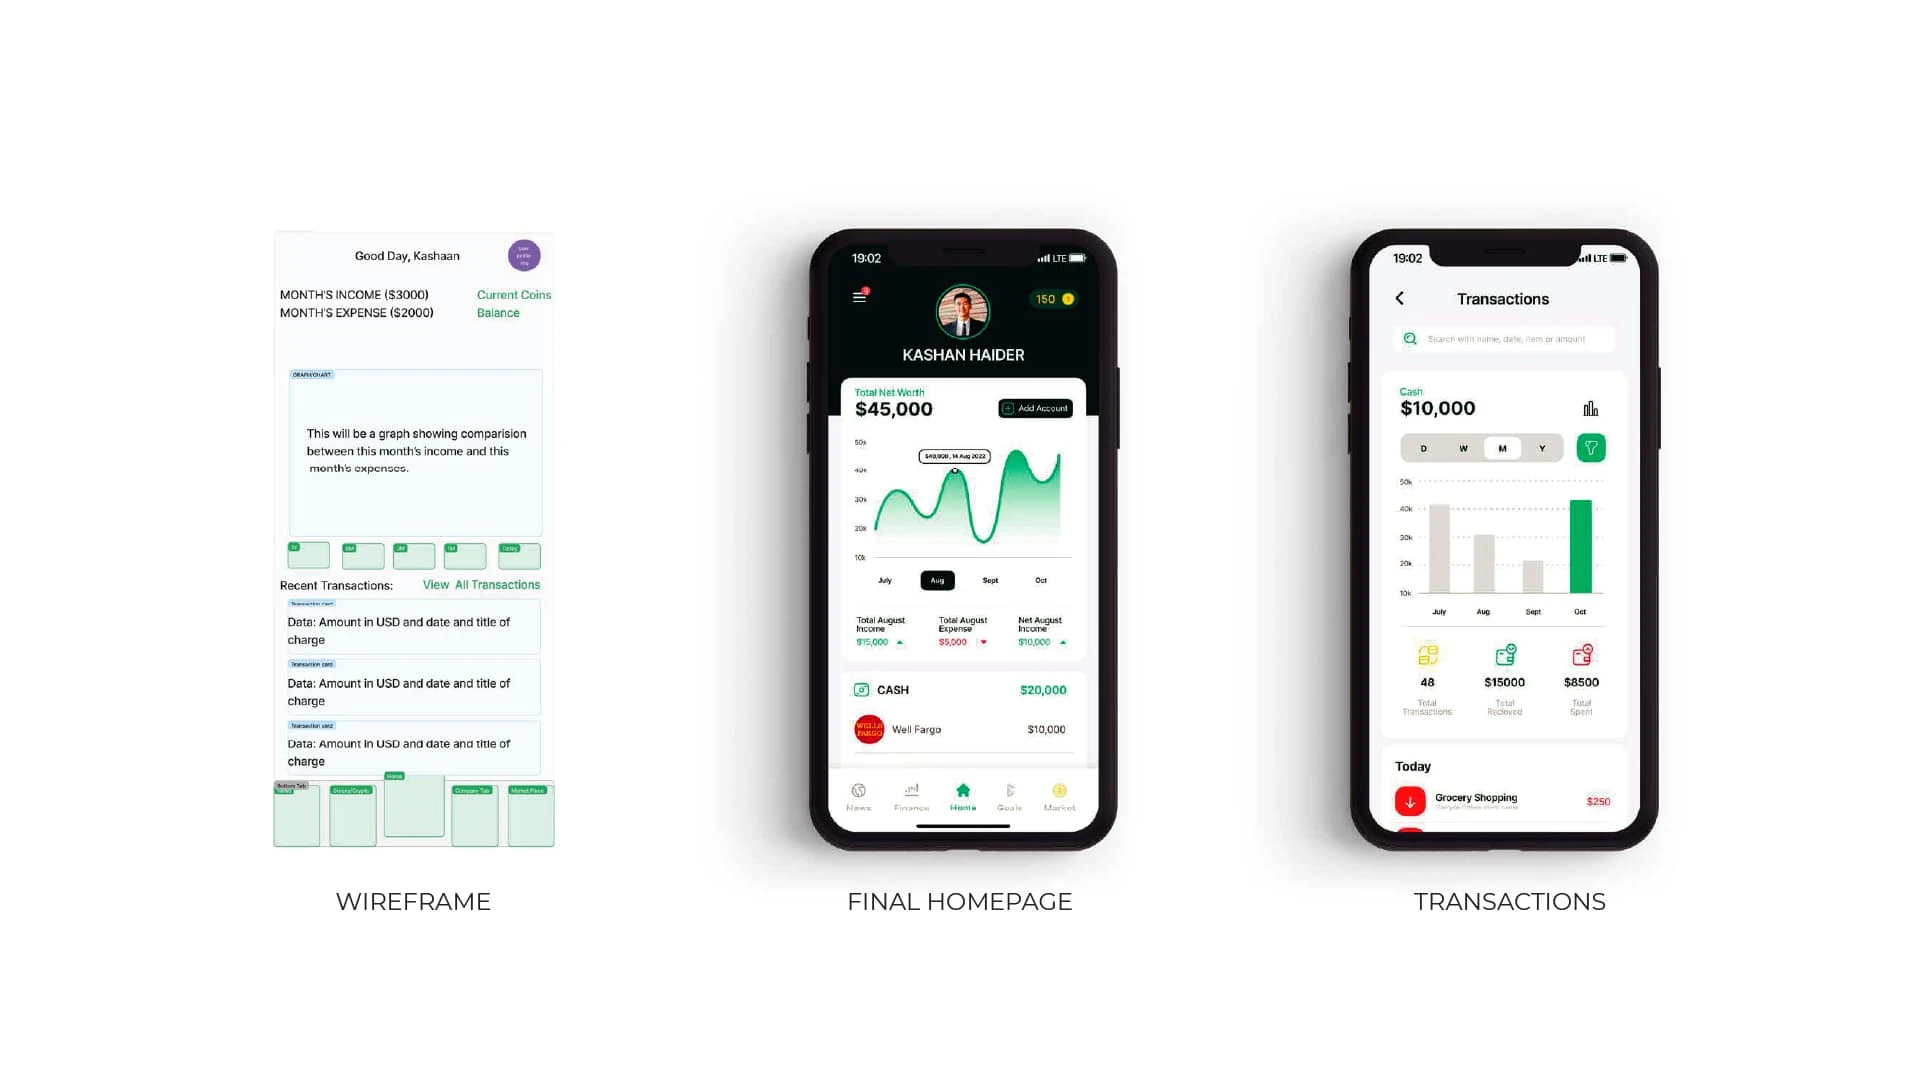
I designed the page by adding an interactive graph with filters to access different months. Furthermore, improvising on the wireframe design, I added category labels with the total amount displayed within them, which could then be used as drop-down to view more information or clicked to be redirected to a separate transaction page.
Onboarding Pages
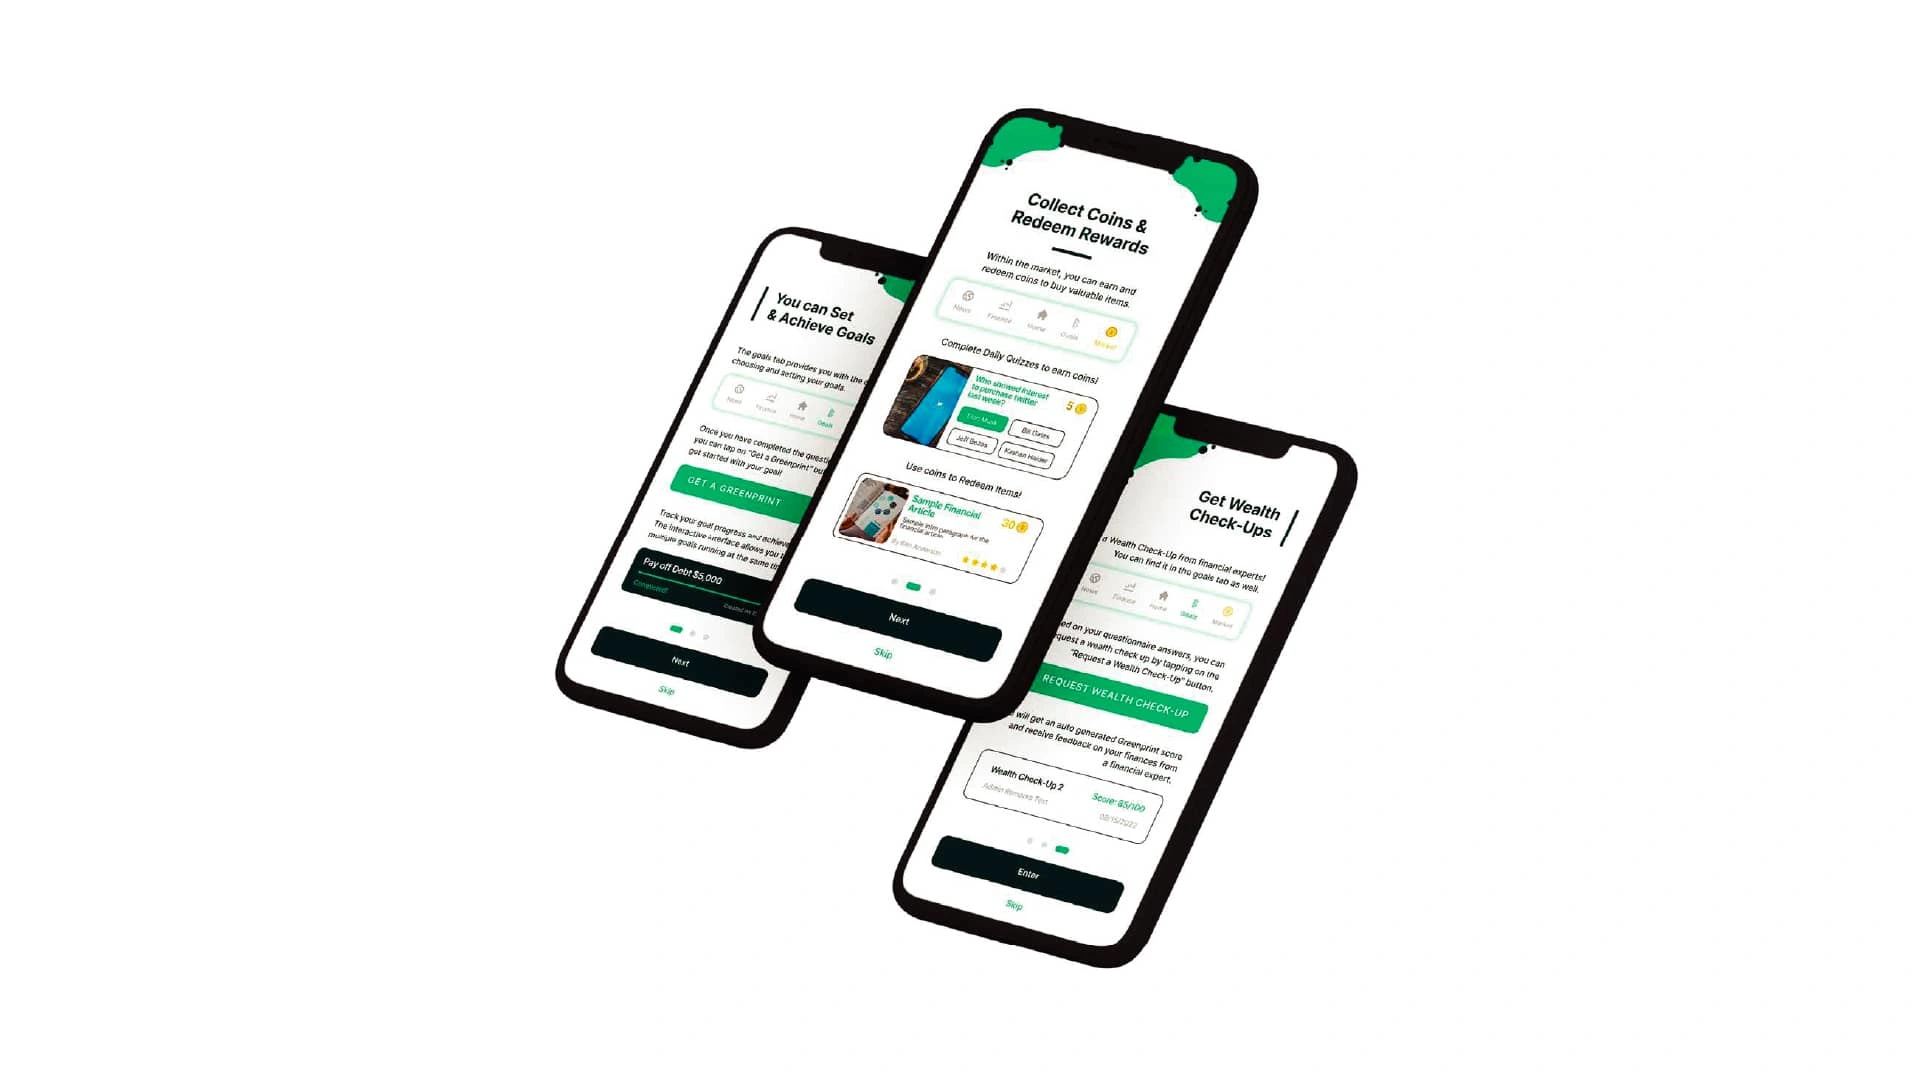
I added tutorial pages on the startup screen to guide users about the main features of the application. These helped improve the user experience by allowing users to have an insight into the different features of the application.
Goals, Wealth Check-Up & Questionnaire
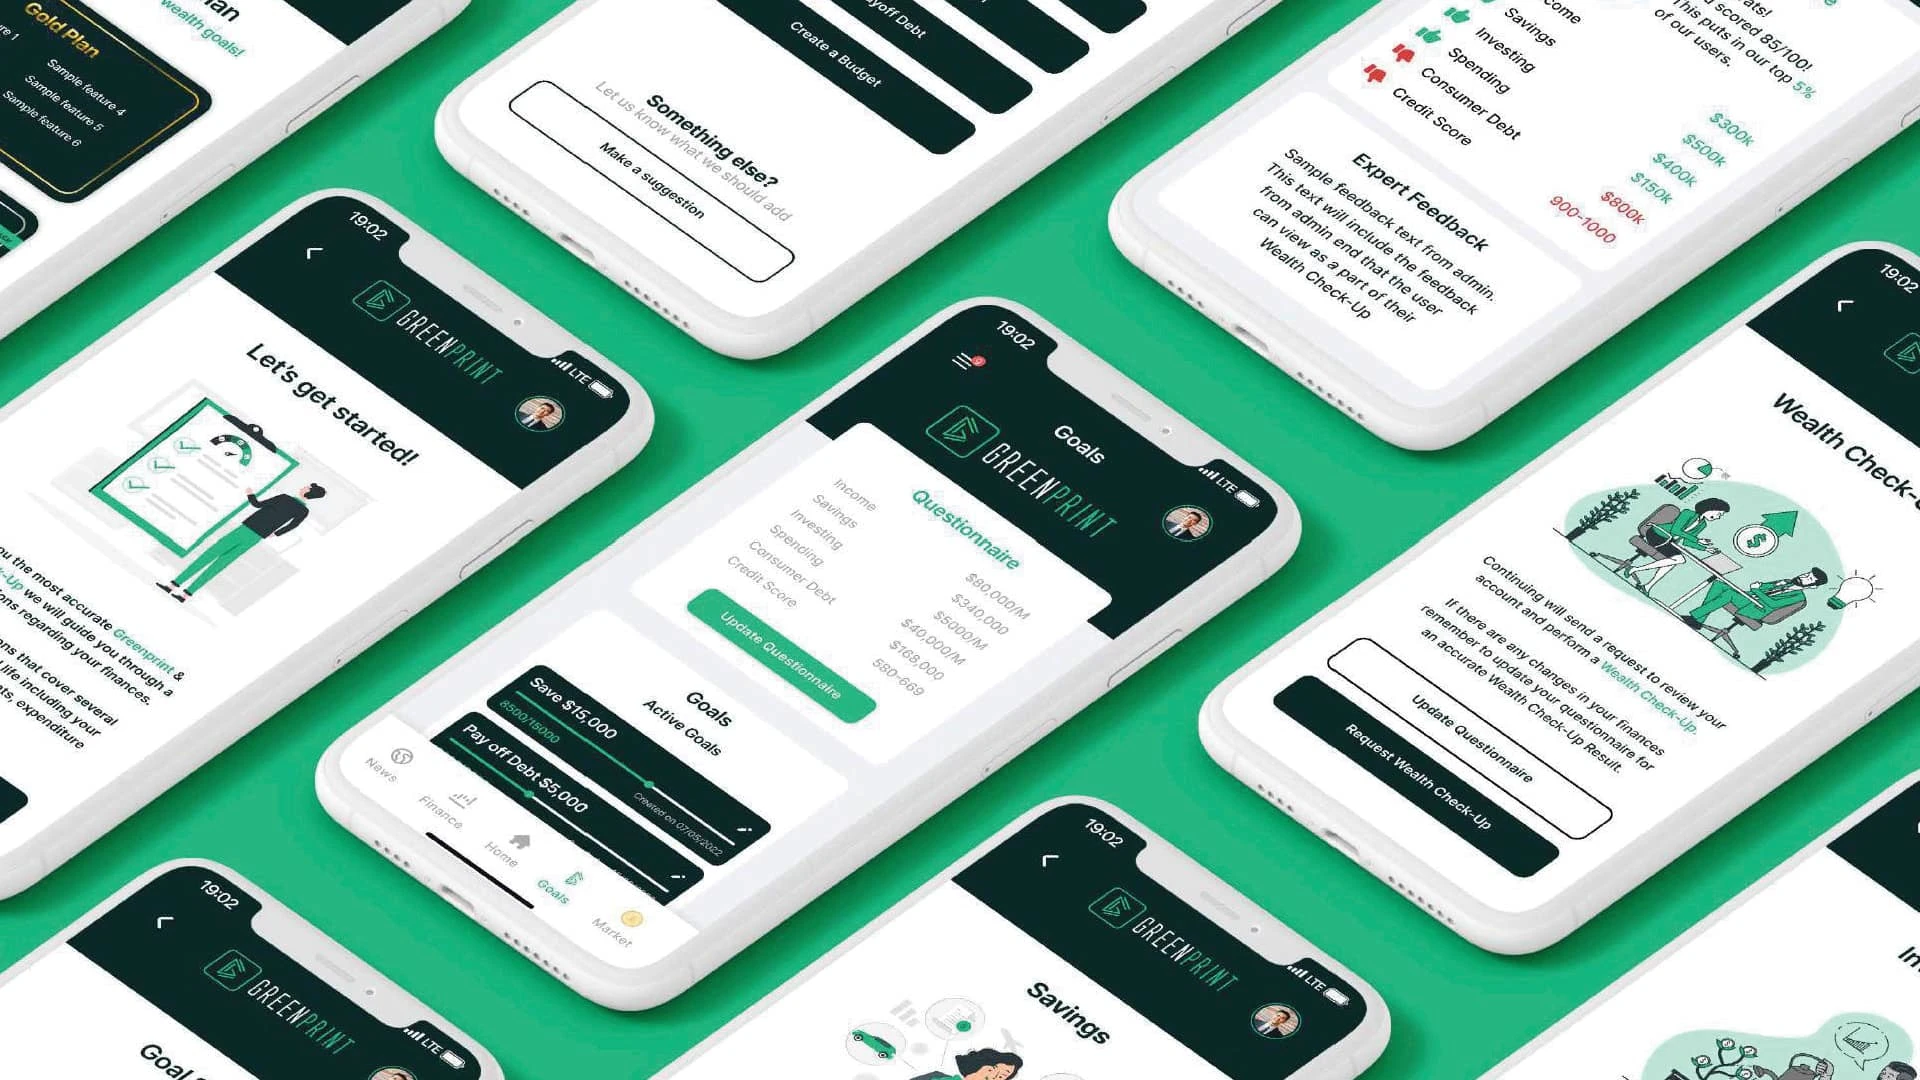
The second design hurdle was finding a way to incorporate the use of a questionnaire for wealth check-ups and to set goals, such that all of these processes are easy to use and run smoothly.
I designed the pages in a way that the questionnaire would be the first thing a user goes through. And only after filling it, can the user access the ‘Goals’ and ‘Wealth Check-Up’ sections.
The design was kept simple. Card-section look was used throughout the app to give it a clean look while also organising related features within a single card.
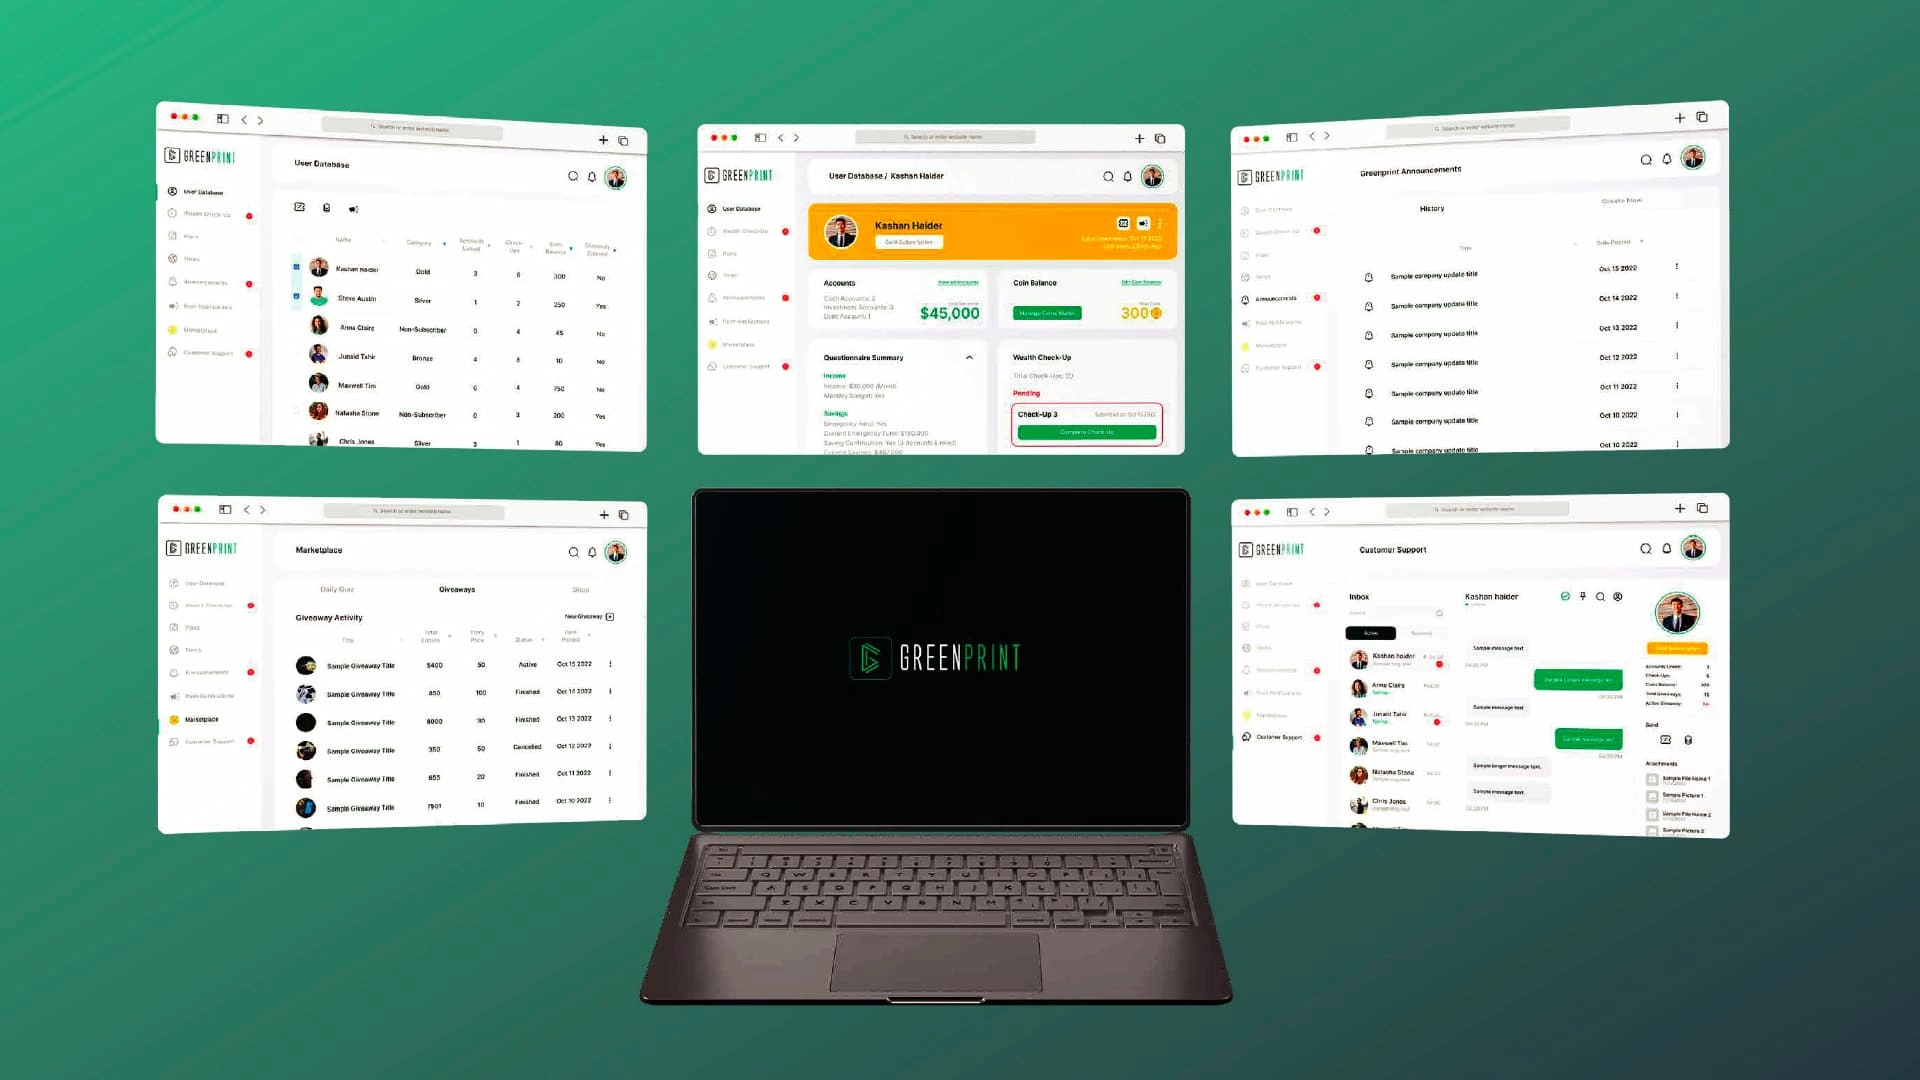
Admin Panel Webpages
The client needed the admin side of the application as well from where they could manage all user information and perform necessary tasks. Responsive web screens were required for the admin panel.
I created a dashboard look and grouped different categories under vertical tabs. This allowed everything to be organised and one click away for the admin. Support features were also added to the side panel so any users’ queries would be visible and could be resolved quickly.
Like this project
Posted Apr 28, 2025
Designed 50+ screens for Greenprint's financial management app.
Likes
0
Views
10
Timeline
Jan 1, 2025 - Jan 29, 2025