VS Omnitrade: Reports Dashboard Interface Design

Vineet Jaydeo

Project overview
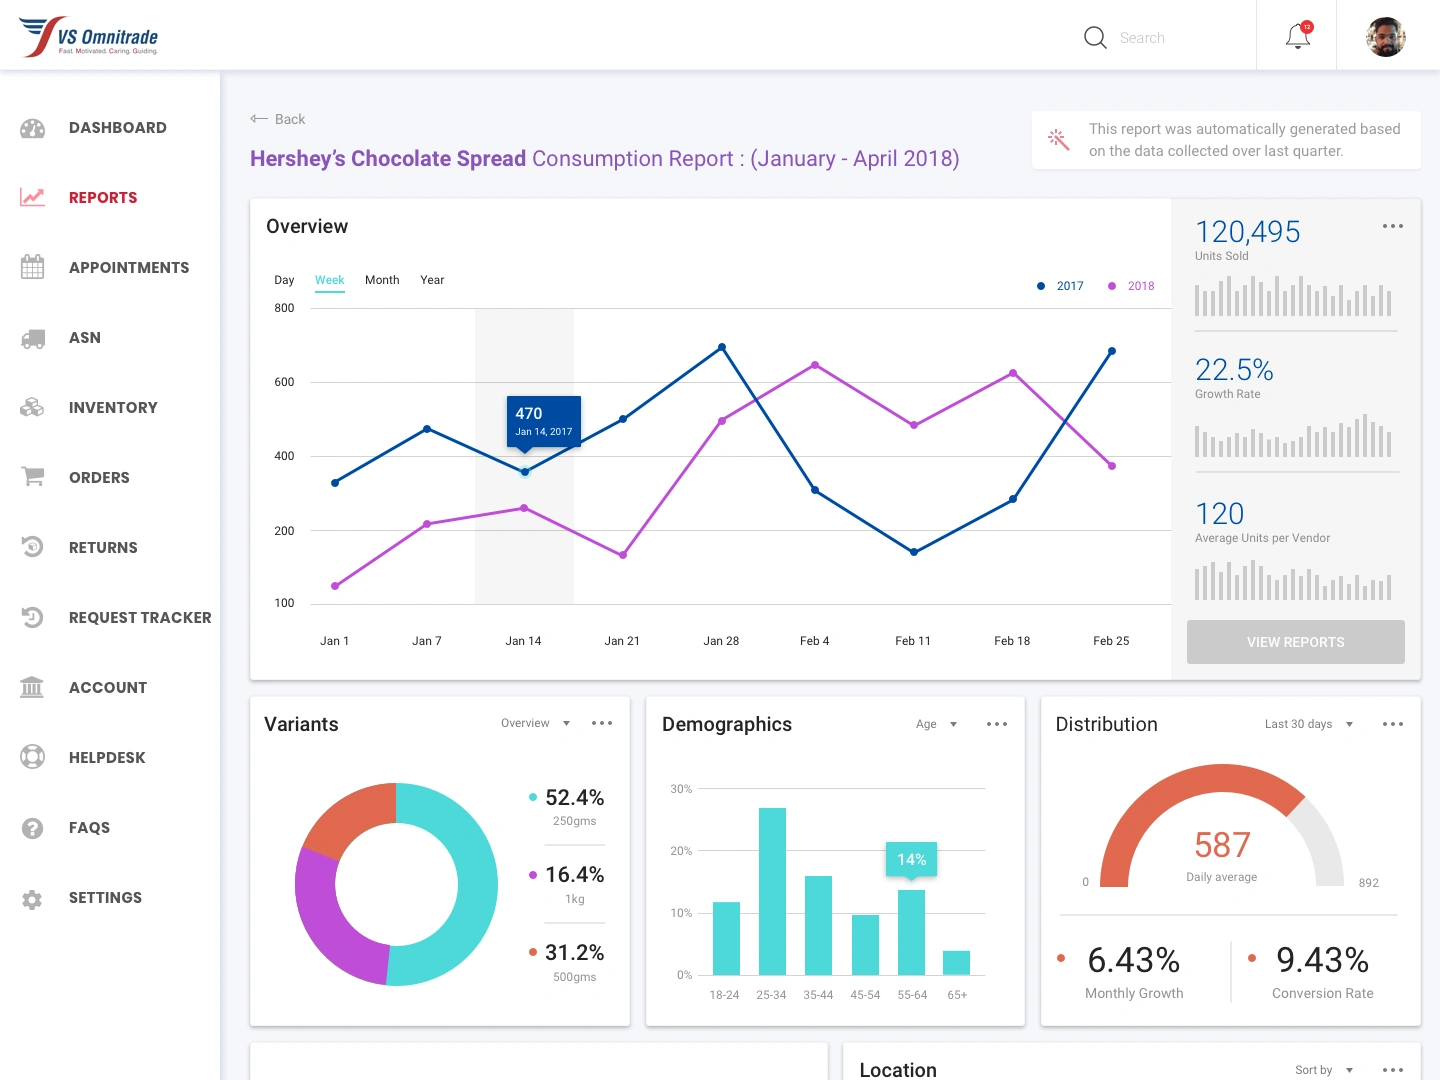
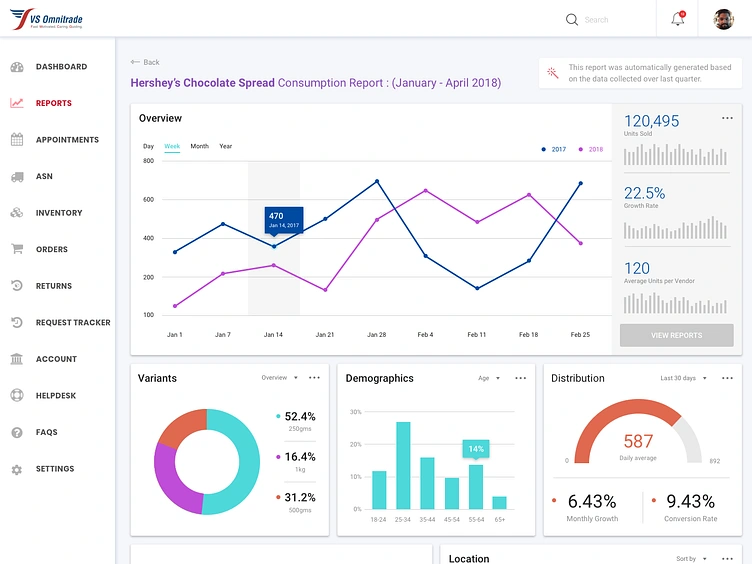
This reporting dashboard design presents a commercial operations workspace for VS Omnitrade. The preserved screen focuses on a consumption report, combining comparative trends with summary indicators and related reporting panels.
My contribution
I designed the interface in Figma, organizing the reporting view, navigation and chart presentation. The work shown covers the visual structure of the dashboard and the relationship between the primary report and supporting information.
Design approach
The main trend chart occupies the largest area of the screen. Two distinct line colors separate the comparison series, while time-range controls give the report a consistent way to communicate its viewing period. The values shown are sample content within the design.
A column of compact indicators sits beside the chart, making summary measures visible in the same view. Below it, separate cards introduce variants, demographics and distribution, maintaining a clear hierarchy between the overview and additional detail.
The left navigation groups operational areas such as reports, inventory, orders and returns. The highlighted reporting item helps locate the current view within the wider application. A light background and restrained borders keep the dense information organized.
Delivered work
The original screen documents the report layout, chart styling and navigation context. It demonstrates my approach to business interfaces where detailed data needs a clear hierarchy and a consistent visual language.
Like this project
Posted Oct 12, 2026
Figma reporting dashboard design with comparative trend charts, summary indicators and structured navigation for a commercial operations workspace.
Likes
0
Views
9
Tags