Procura: Trade Analytics Dashboard Concept

Vineet Jaydeo

Project overview
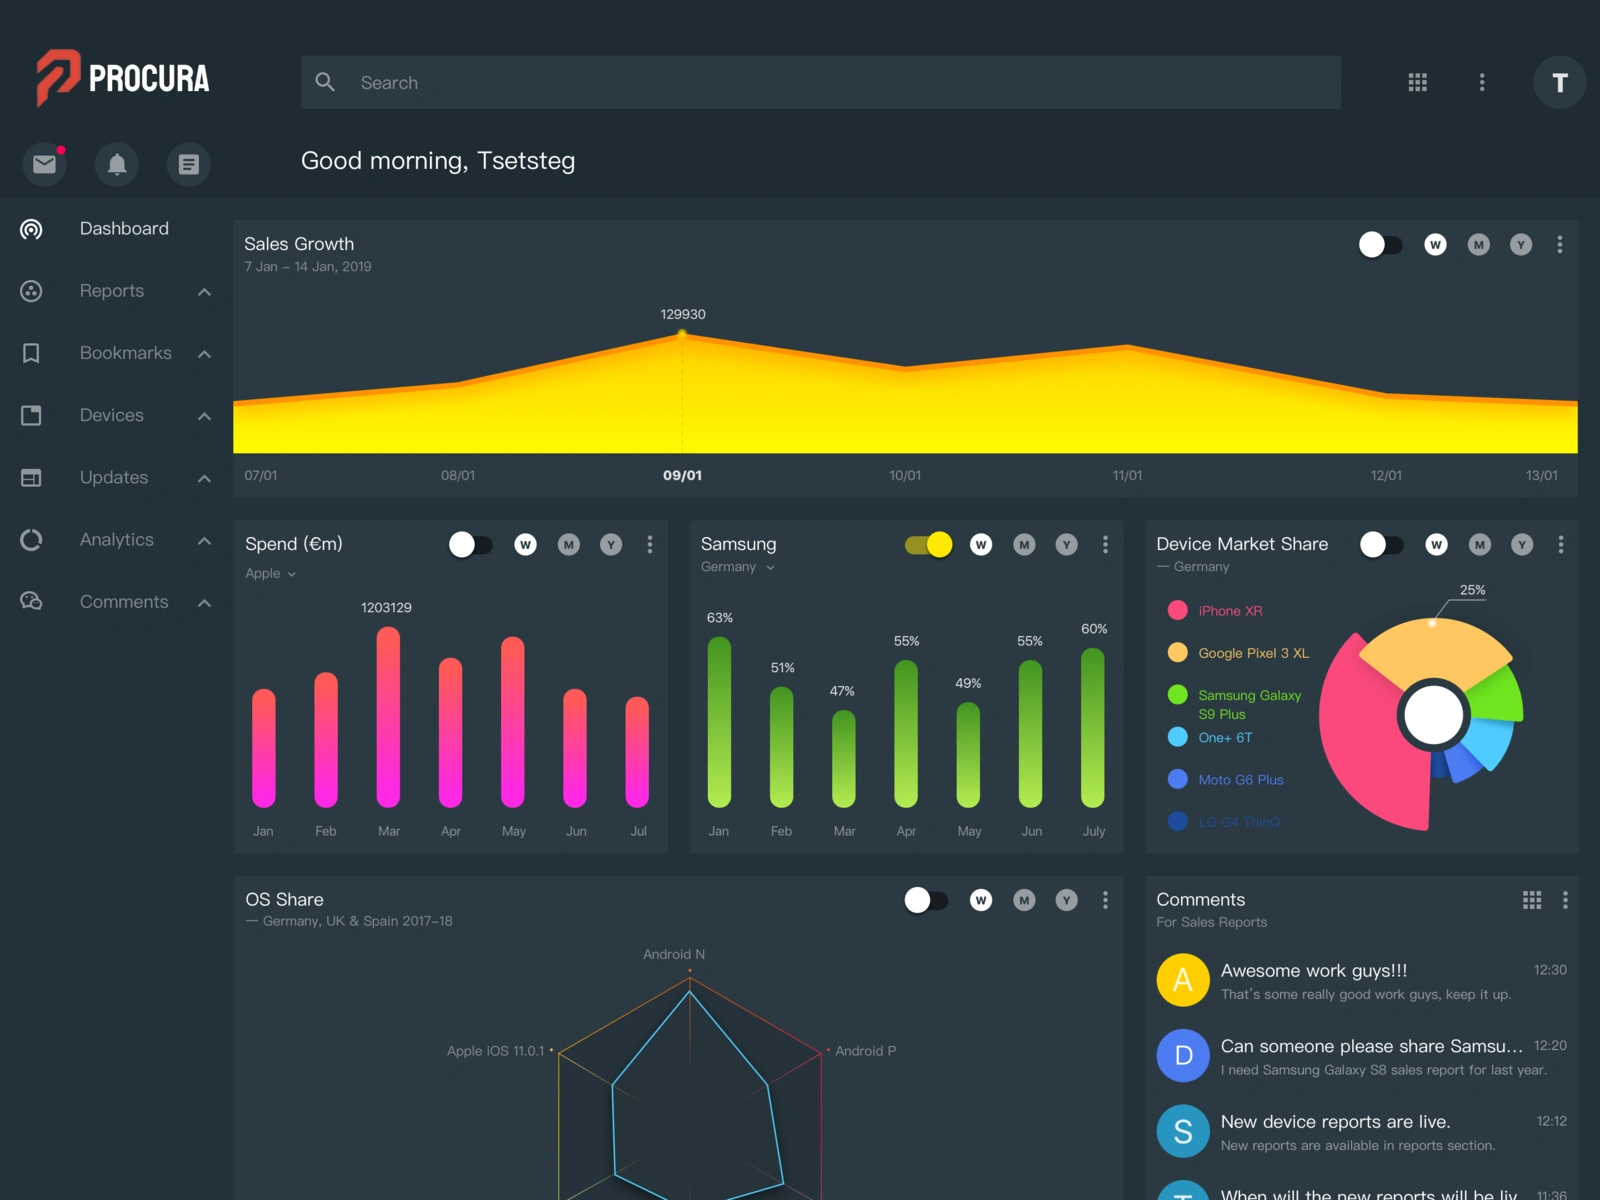
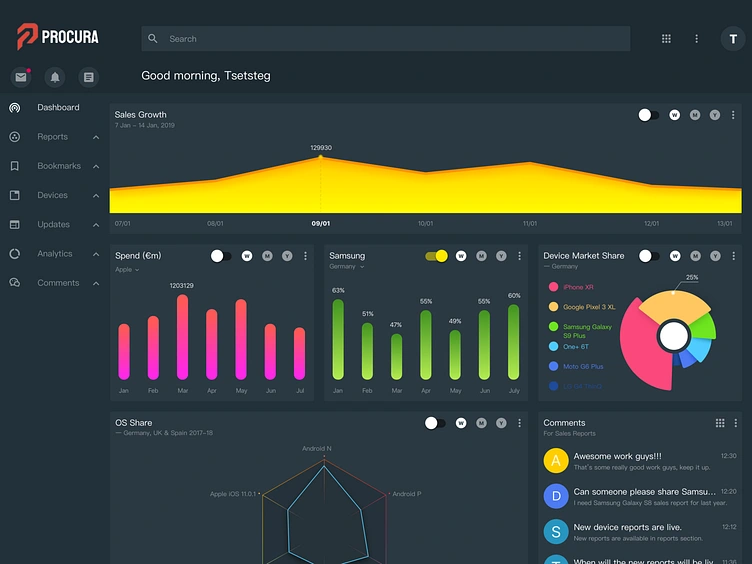
This Procura dashboard concept explores an analytics workspace for trade and commercial reporting. The original screen presents sales growth, spending and device market share through a combination of area, bar and donut charts.
My contribution
I designed the dashboard interface in Figma, organizing navigation, a search area and multiple reporting panels into a coherent desktop layout. The figures and charts in the concept are illustrative interface content.
Design approach
The largest panel gives the sales trend visual priority. Smaller panels below allow related measures to be viewed alongside one another, with each chart contained within its own labeled card. This structure establishes a clear relationship between an overview and supporting detail.
A dark background creates a consistent workspace, while brighter chart colors help distinguish different measures and series. Repeated time-range controls and menu placements give the panels a common visual language.
The left navigation keeps dashboard, reports and other workspace areas in a predictable location. The top search and greeting form a separate utility area so they do not compete with the reporting content.
Delivered work
The preserved dashboard visual demonstrates the information architecture, chart presentation and component styling. This project shows my approach to data-heavy interfaces: establish a primary view, group related information and maintain consistency across reporting panels.
Like this project
Posted Oct 12, 2026
Dark dashboard concept in Figma, organizing sales trends, spending, device market share and navigation into a structured analytics workspace.
Likes
0
Views
8
Tags