Ocean Status 1985-2924

Cinzia Bongino

Ocean Status 1985-2924
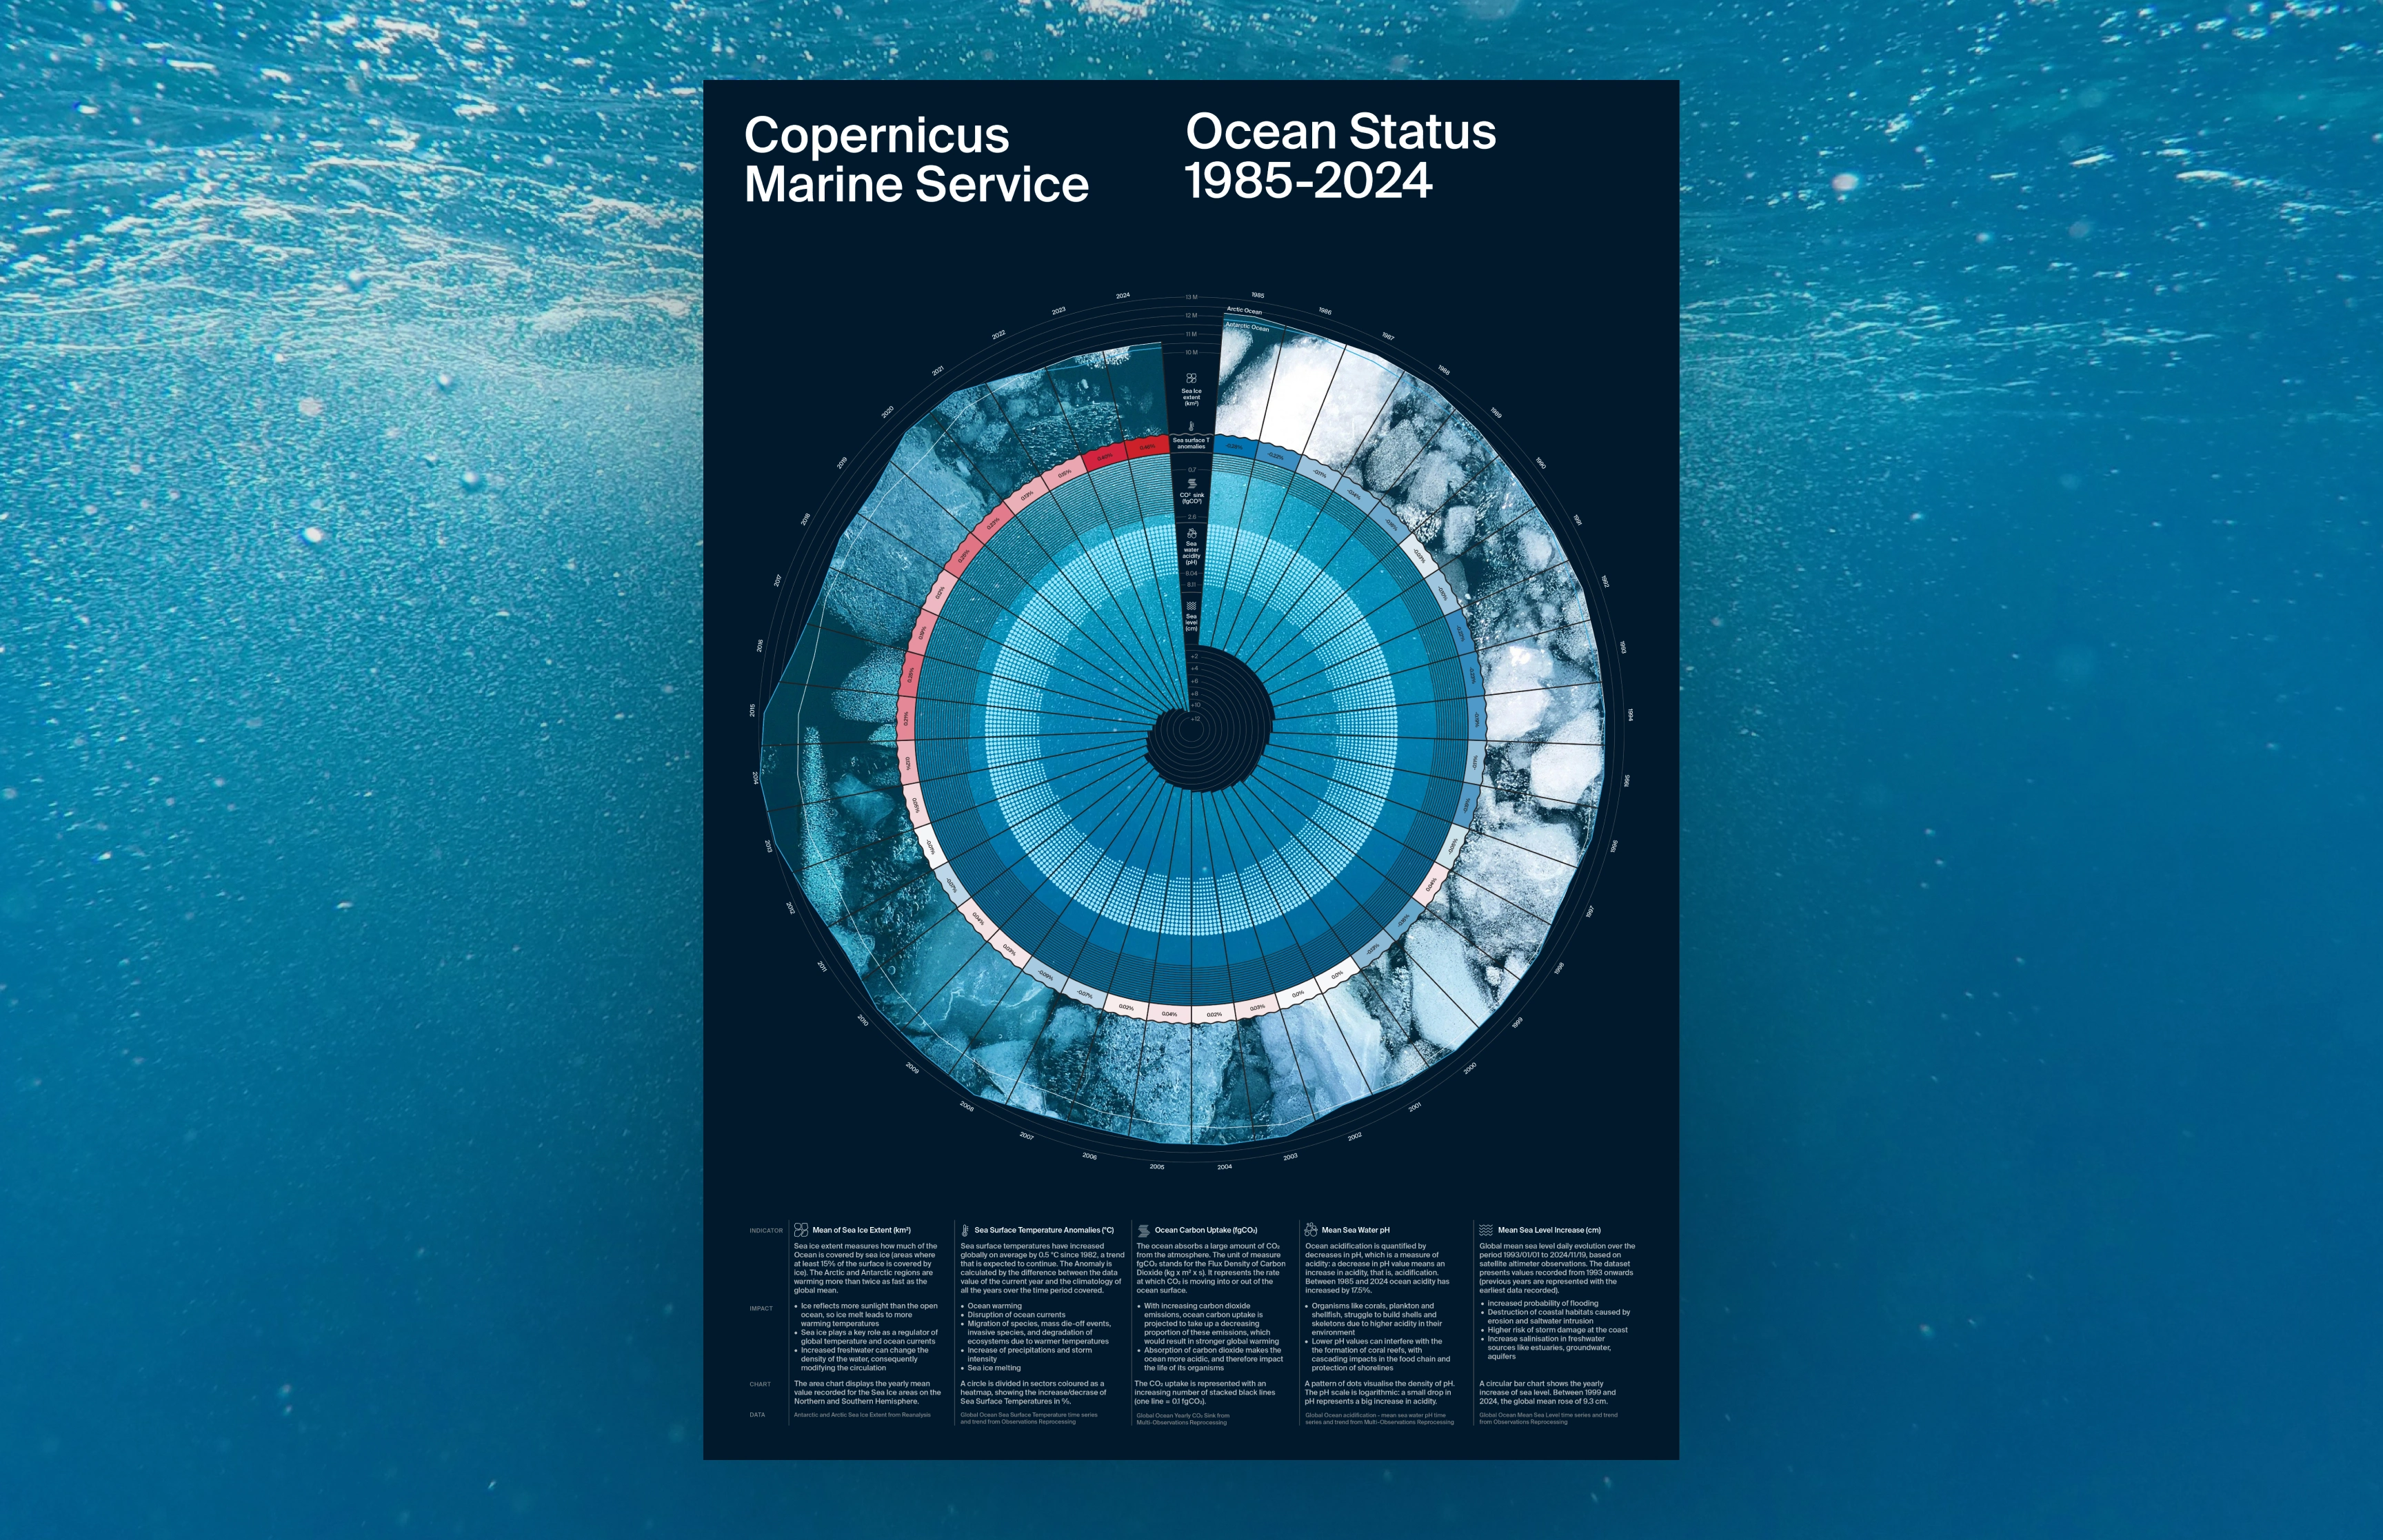
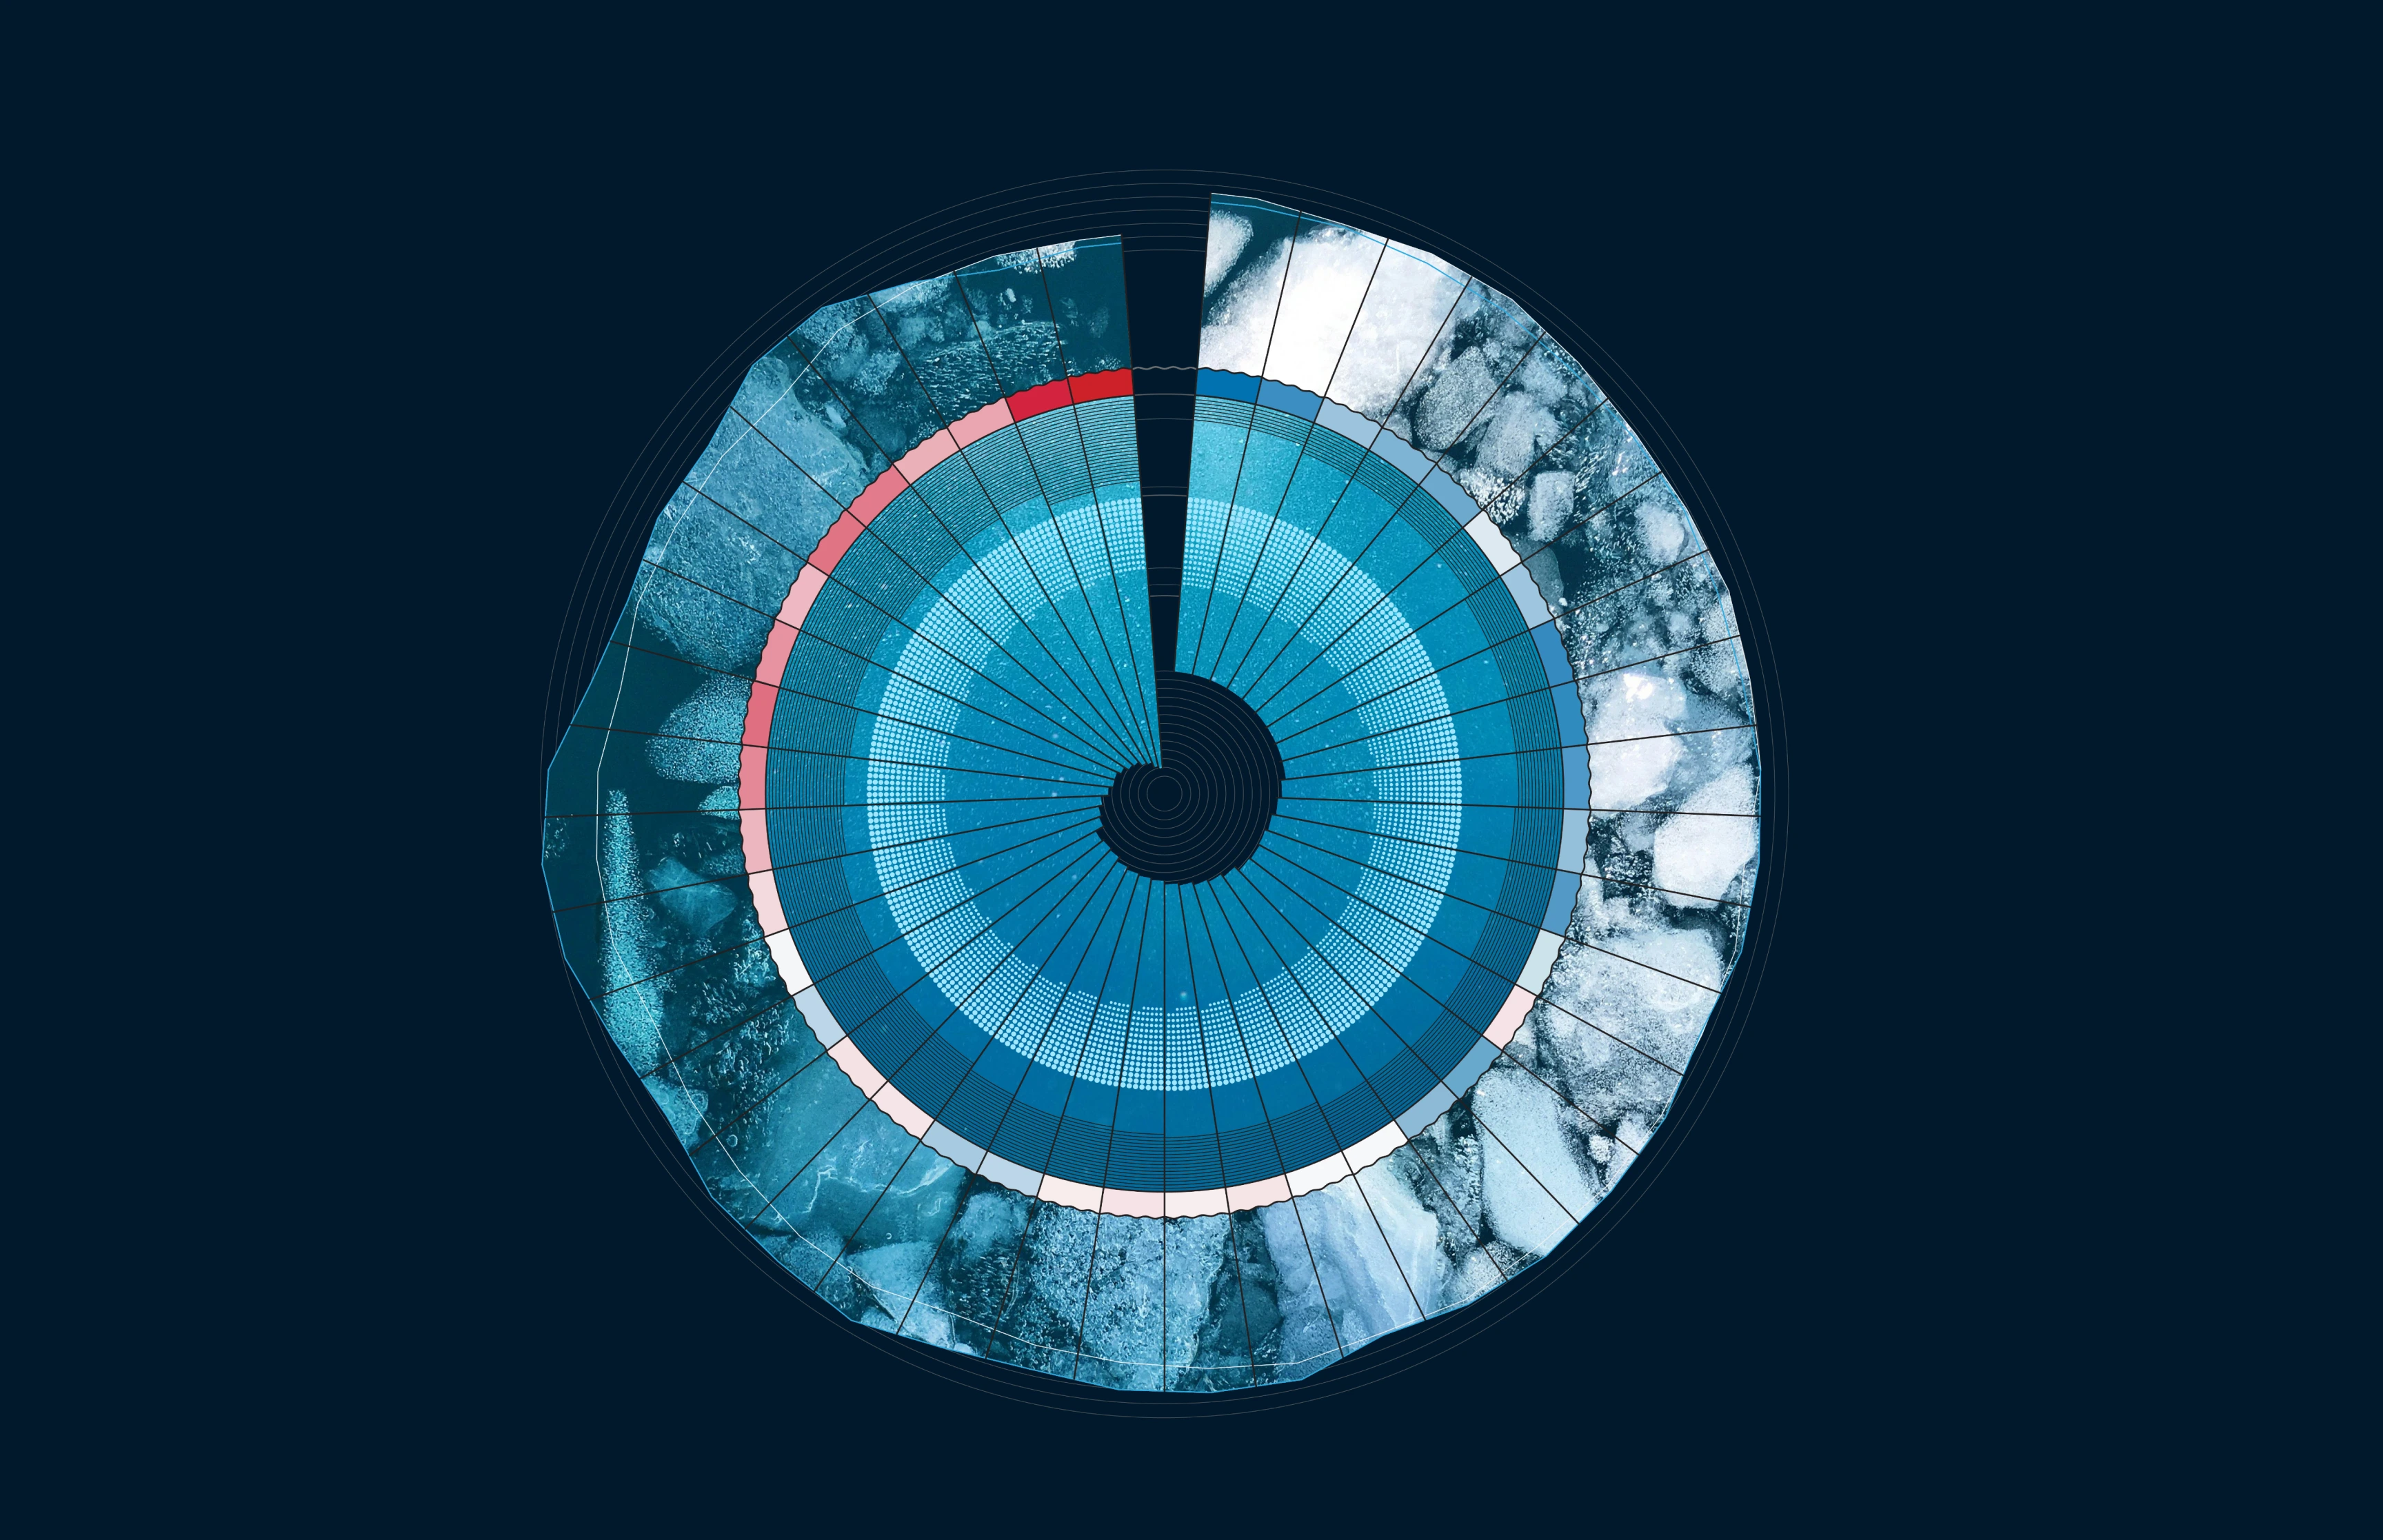
Ocean Status is a circular calendar visualizing 40 years of ocean observations through five Copernicus Marine Service indicators: Sea Ice Extent, Sea Surface Temperature Anomalies, Ocean Carbon Uptake, Seawater pH, and Mean Sea Level Increase. Each indicator is plotted on a radial slice of the circle, together composing 40 years of recorded observations. The chart is designed to reveal the differences between historical and recent ocean conditions, allowing the design to scale easily as new years of data become available.
🏅 The poster has been selected for the 2026 Copernicus Marine Dataviz Challenge. You can check the other finalists here.
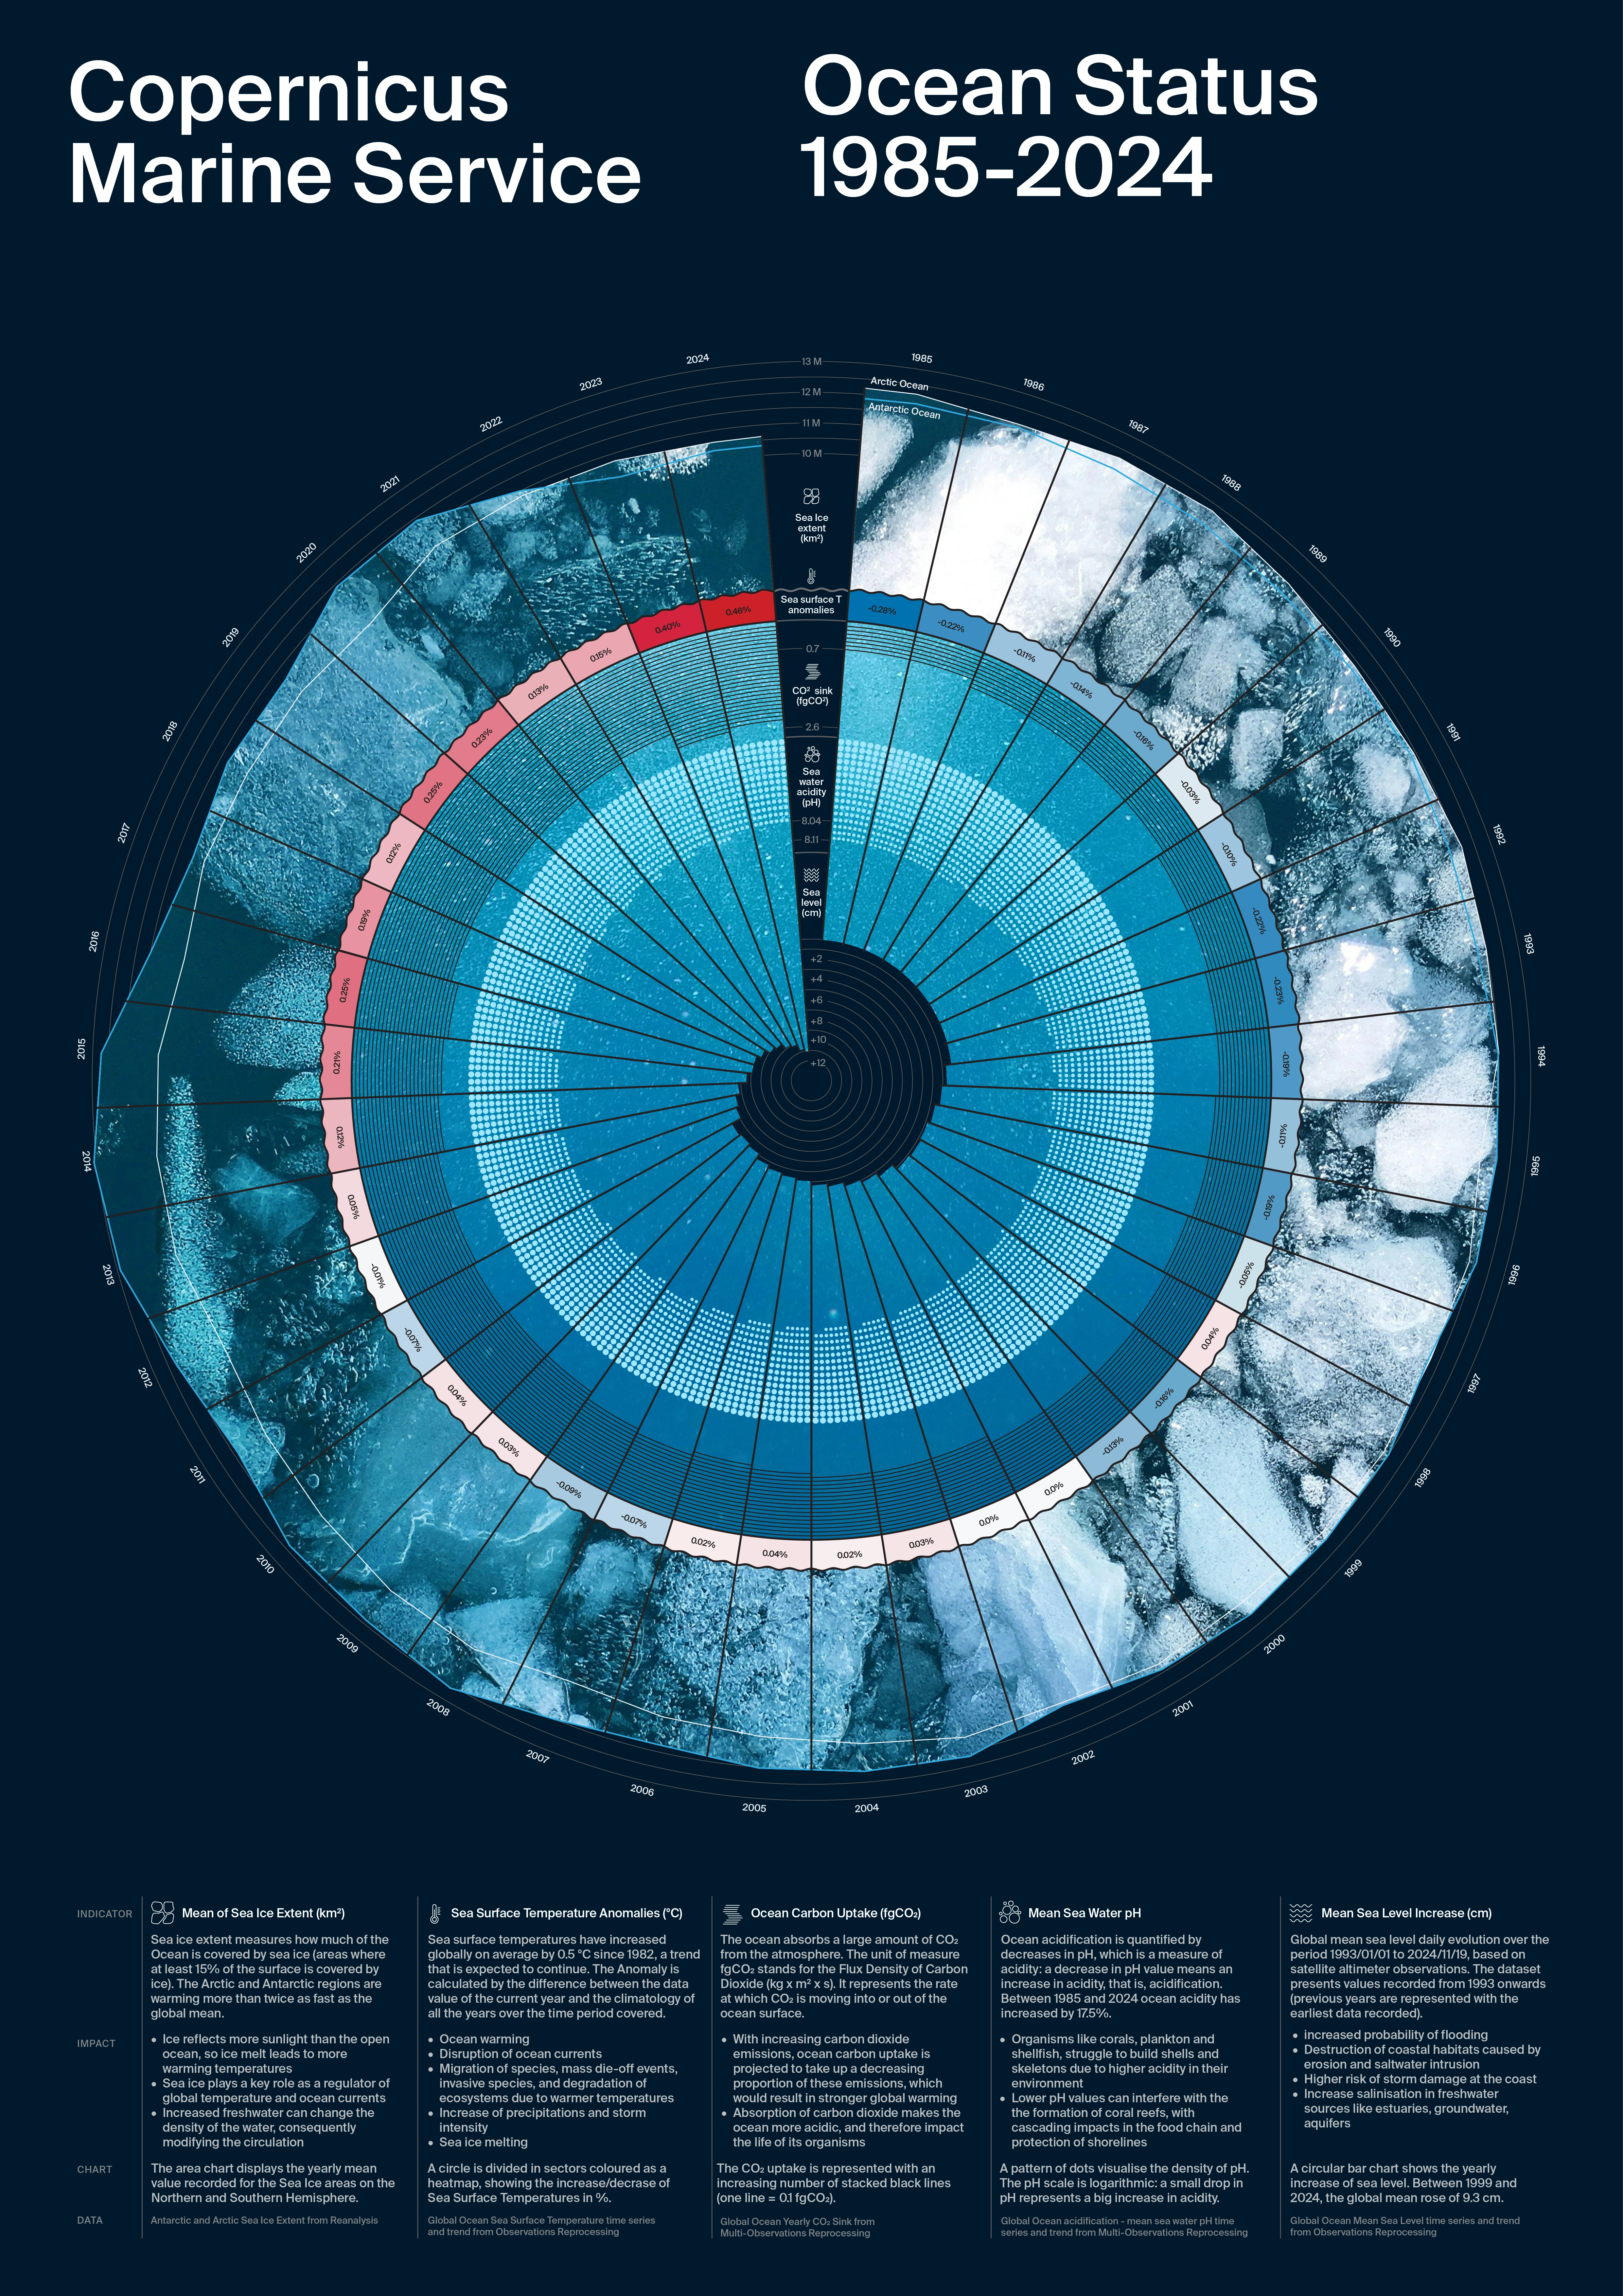
Poster
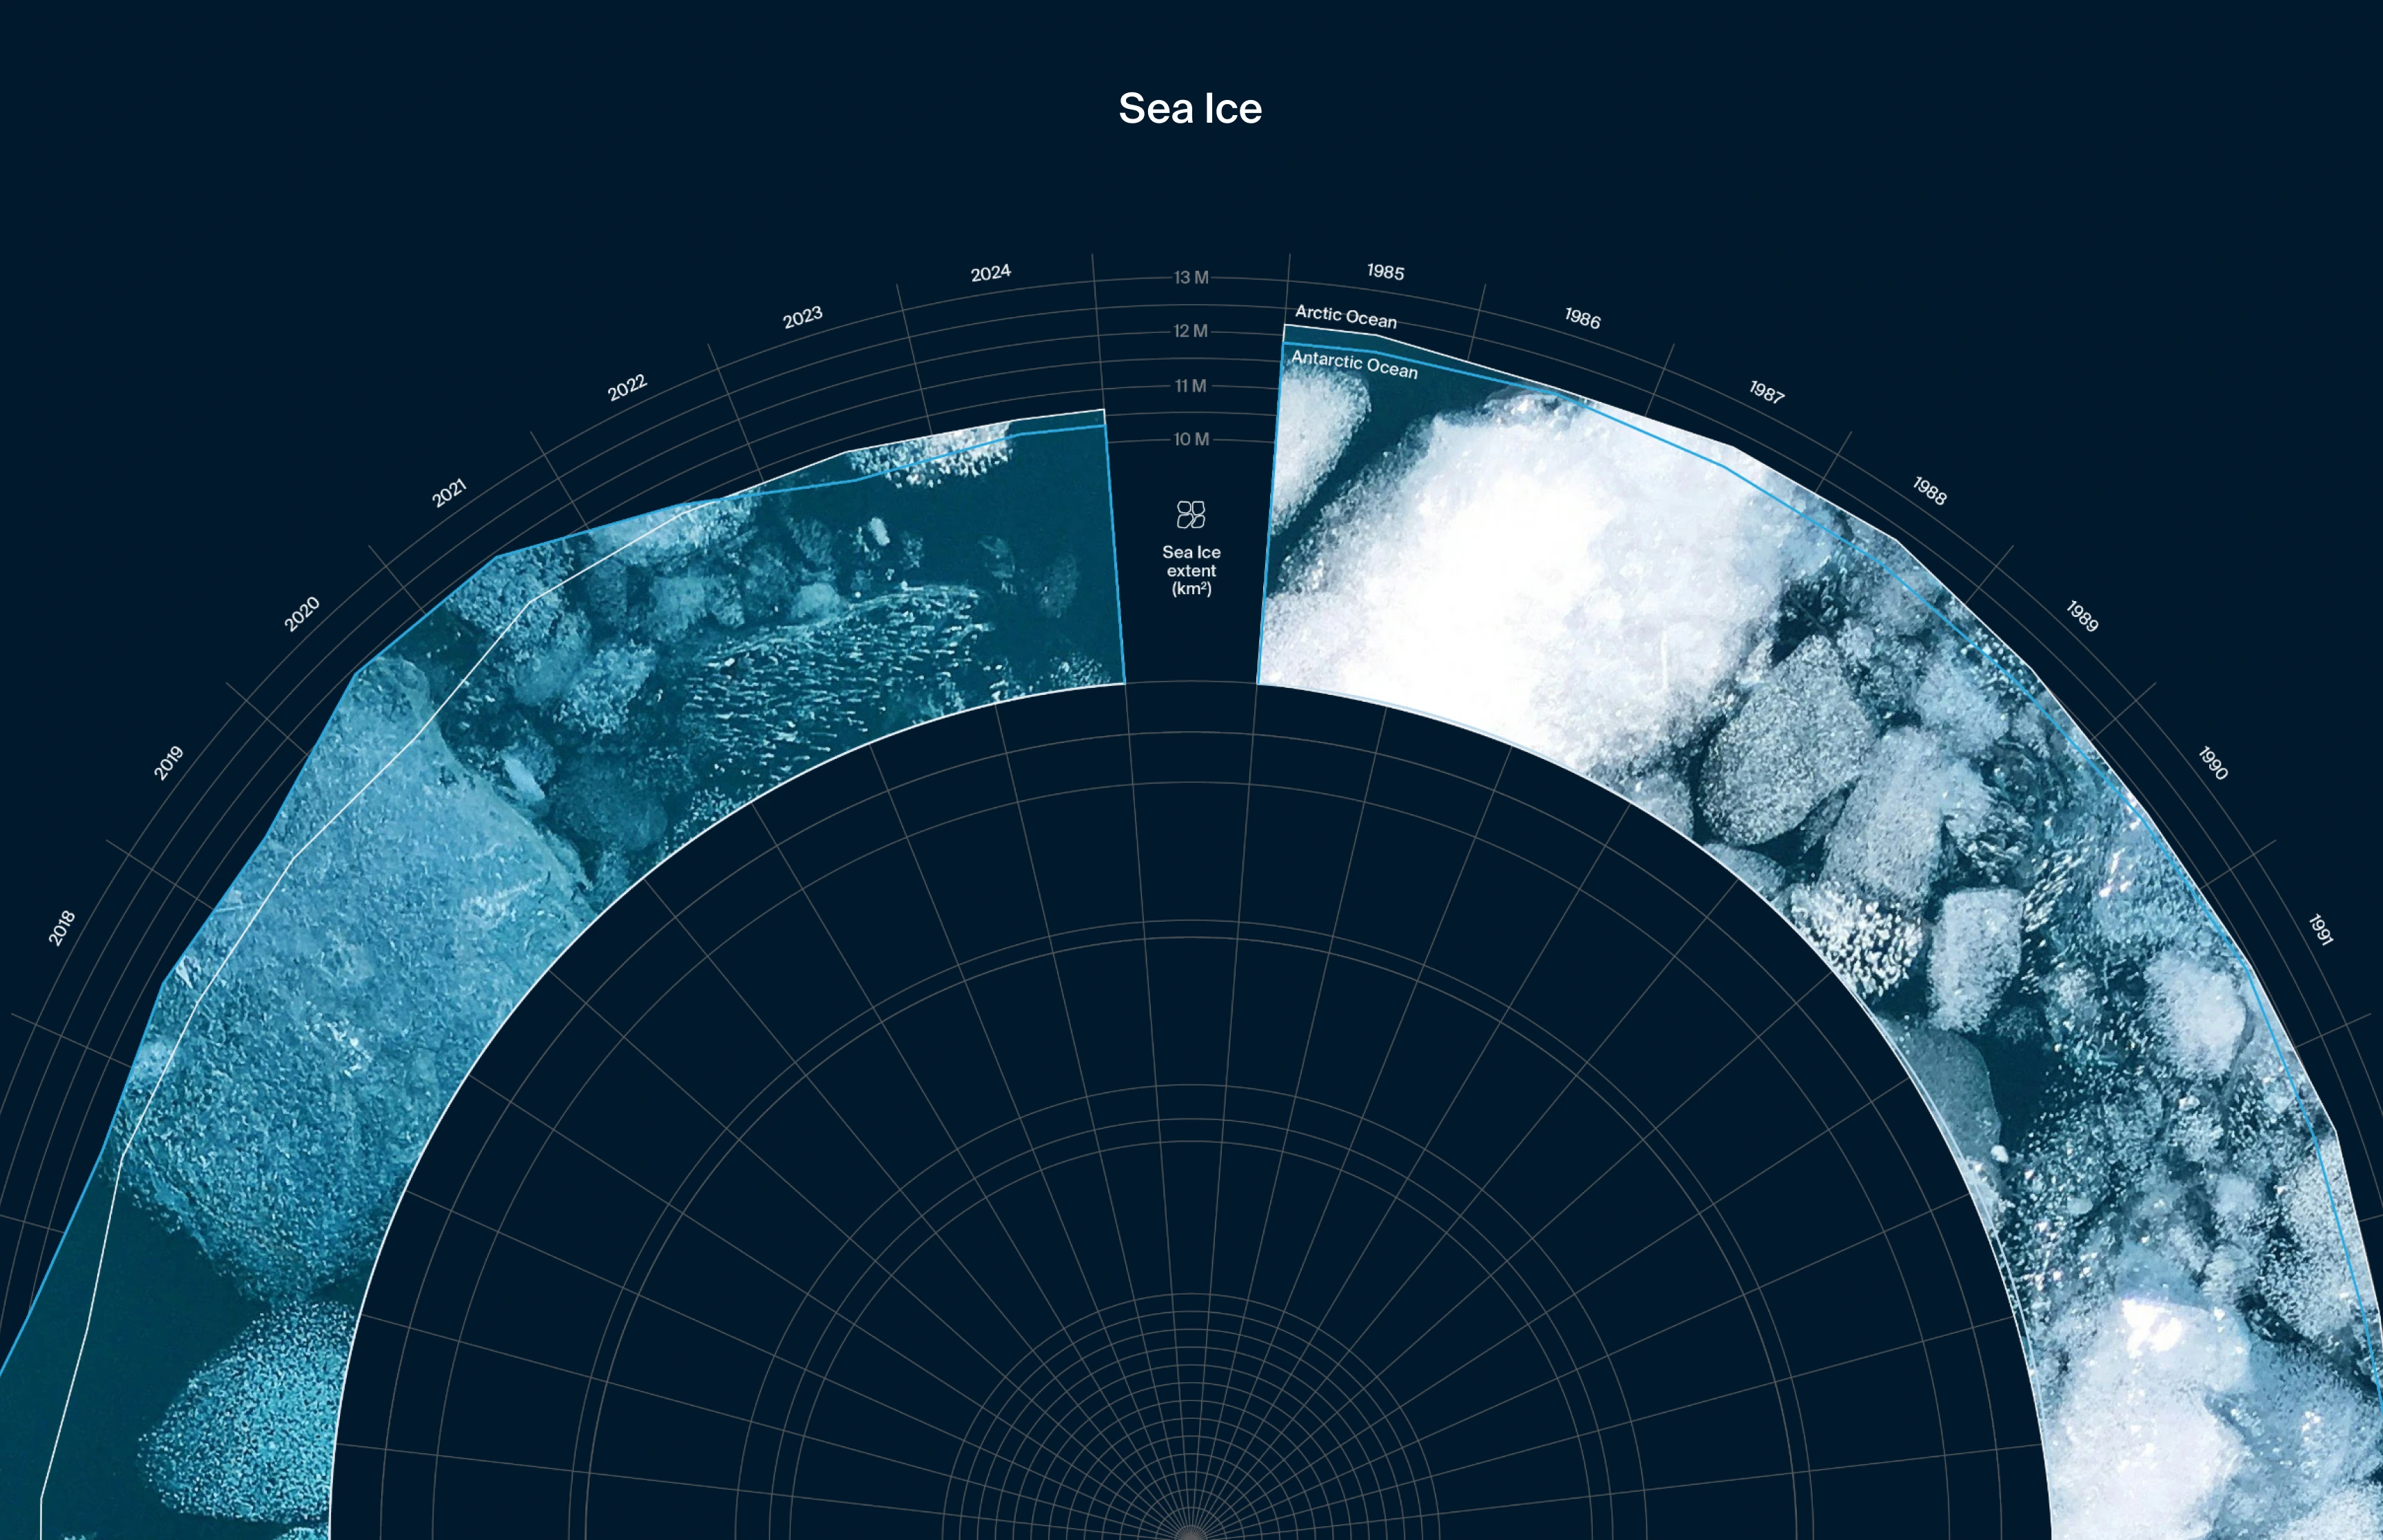
Arctic and Antarctic Sea Ice Extent
Starting from the outer ring, Arctic and Antarctic Sea Ice Extent data (measured in million km²) are displayed using an area chart filled with a photo of floating ice blocks.
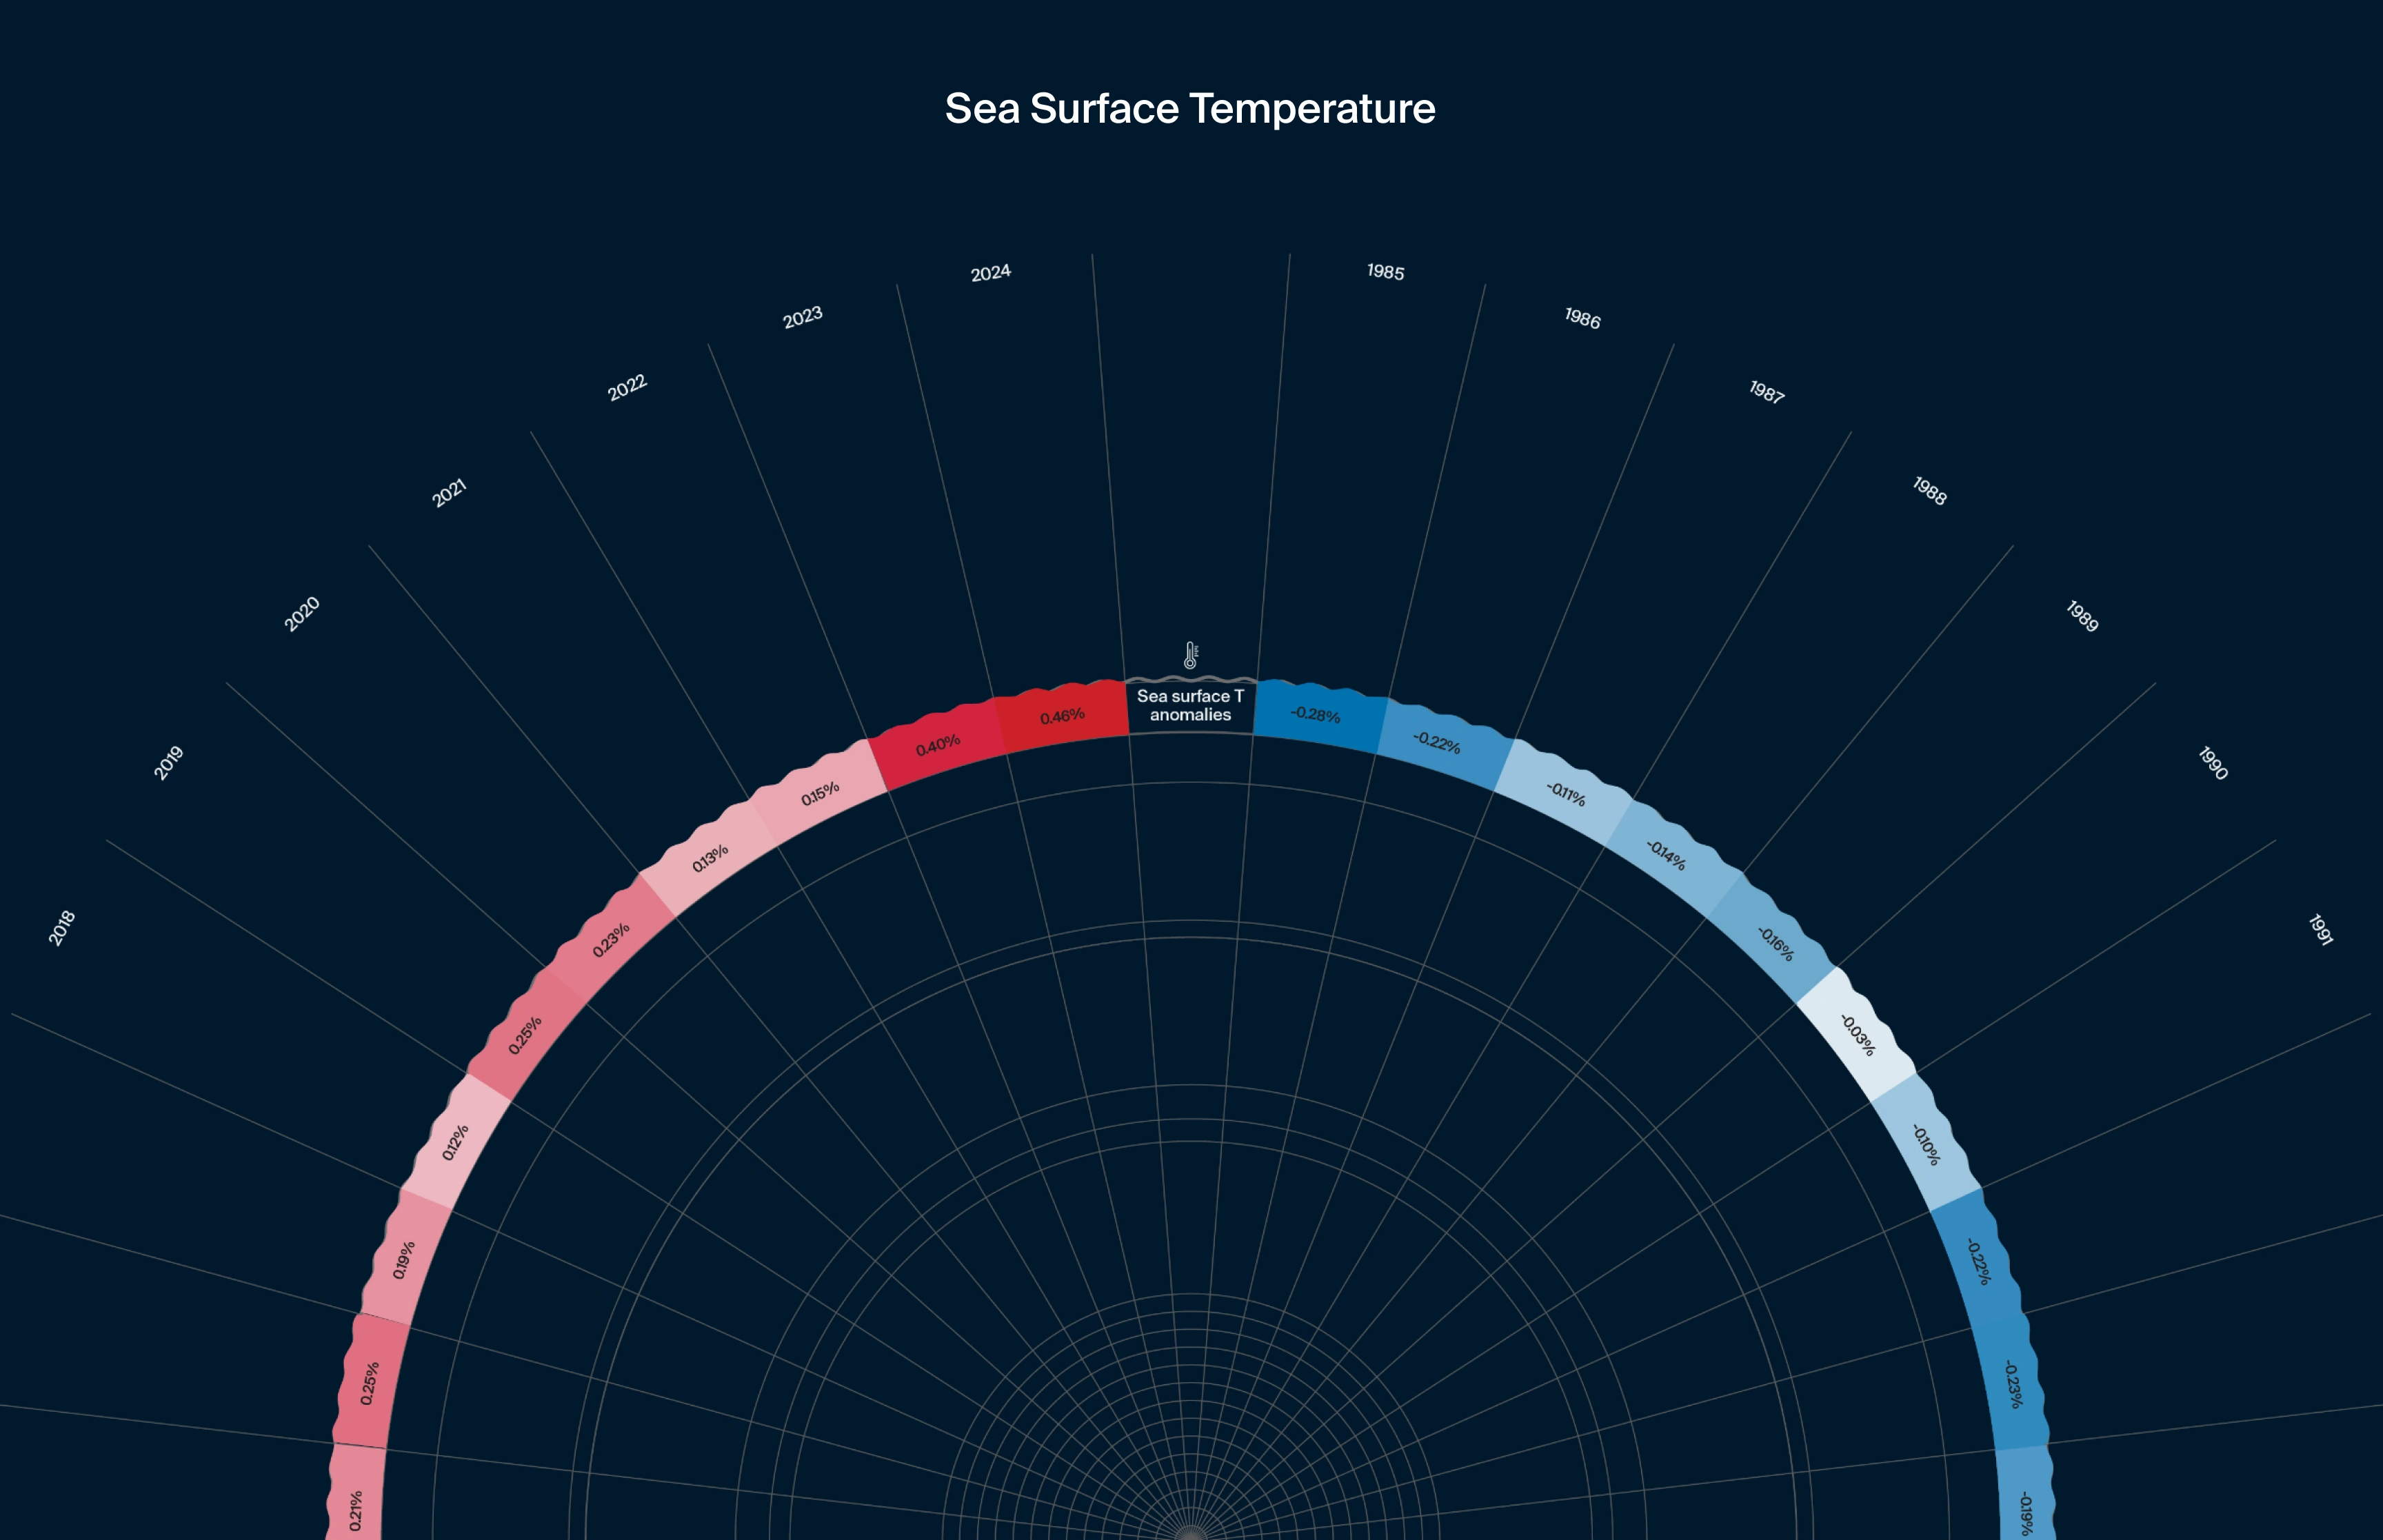
Sea Surface Temperature
Moving inward, Sea Surface Temperature anomalies are shown as a heatmap donut chart. Each sector is coloured according to whether the recorded value is below or above the baseline.
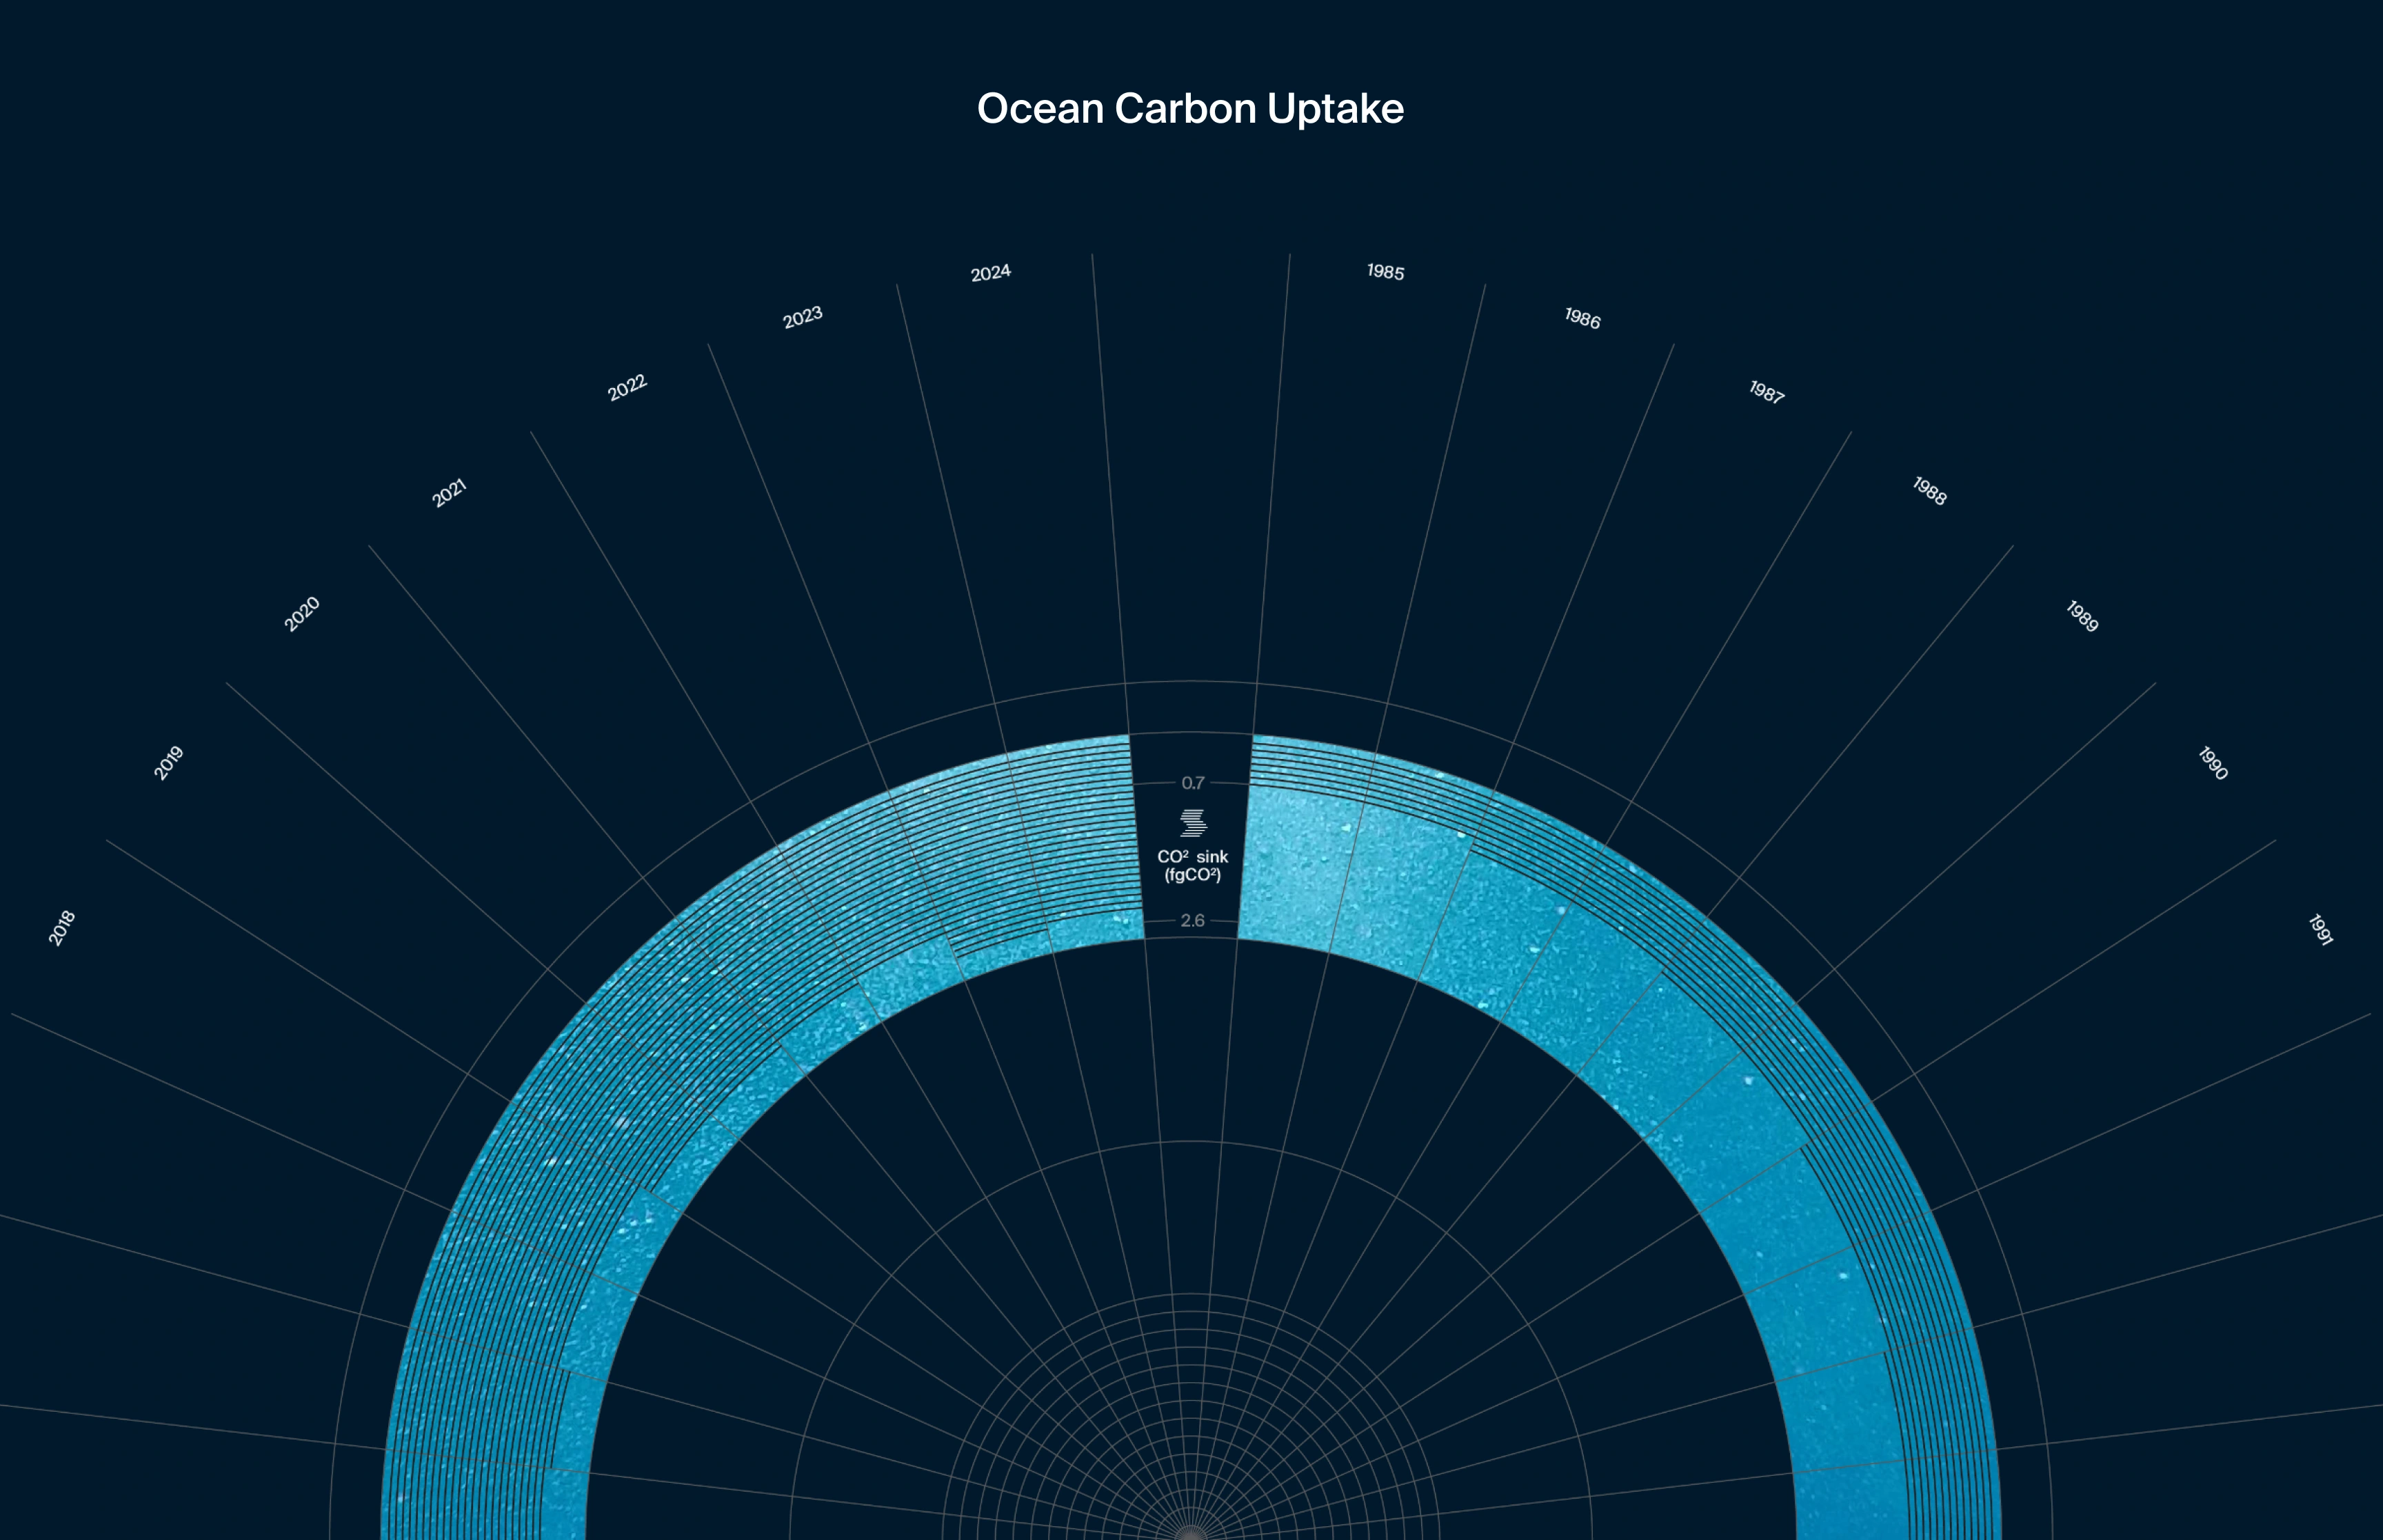
Ocean Carbon Uptake
The next section depicts the Ocean Carbon Uptake. An image of underwater bubbles is partially overlaid with concentric circular lines, each representing an increase of 0.1 fgCO₂. Together, these lines illustrate the rate at which the ocean absorbs carbon dioxide from the atmosphere.
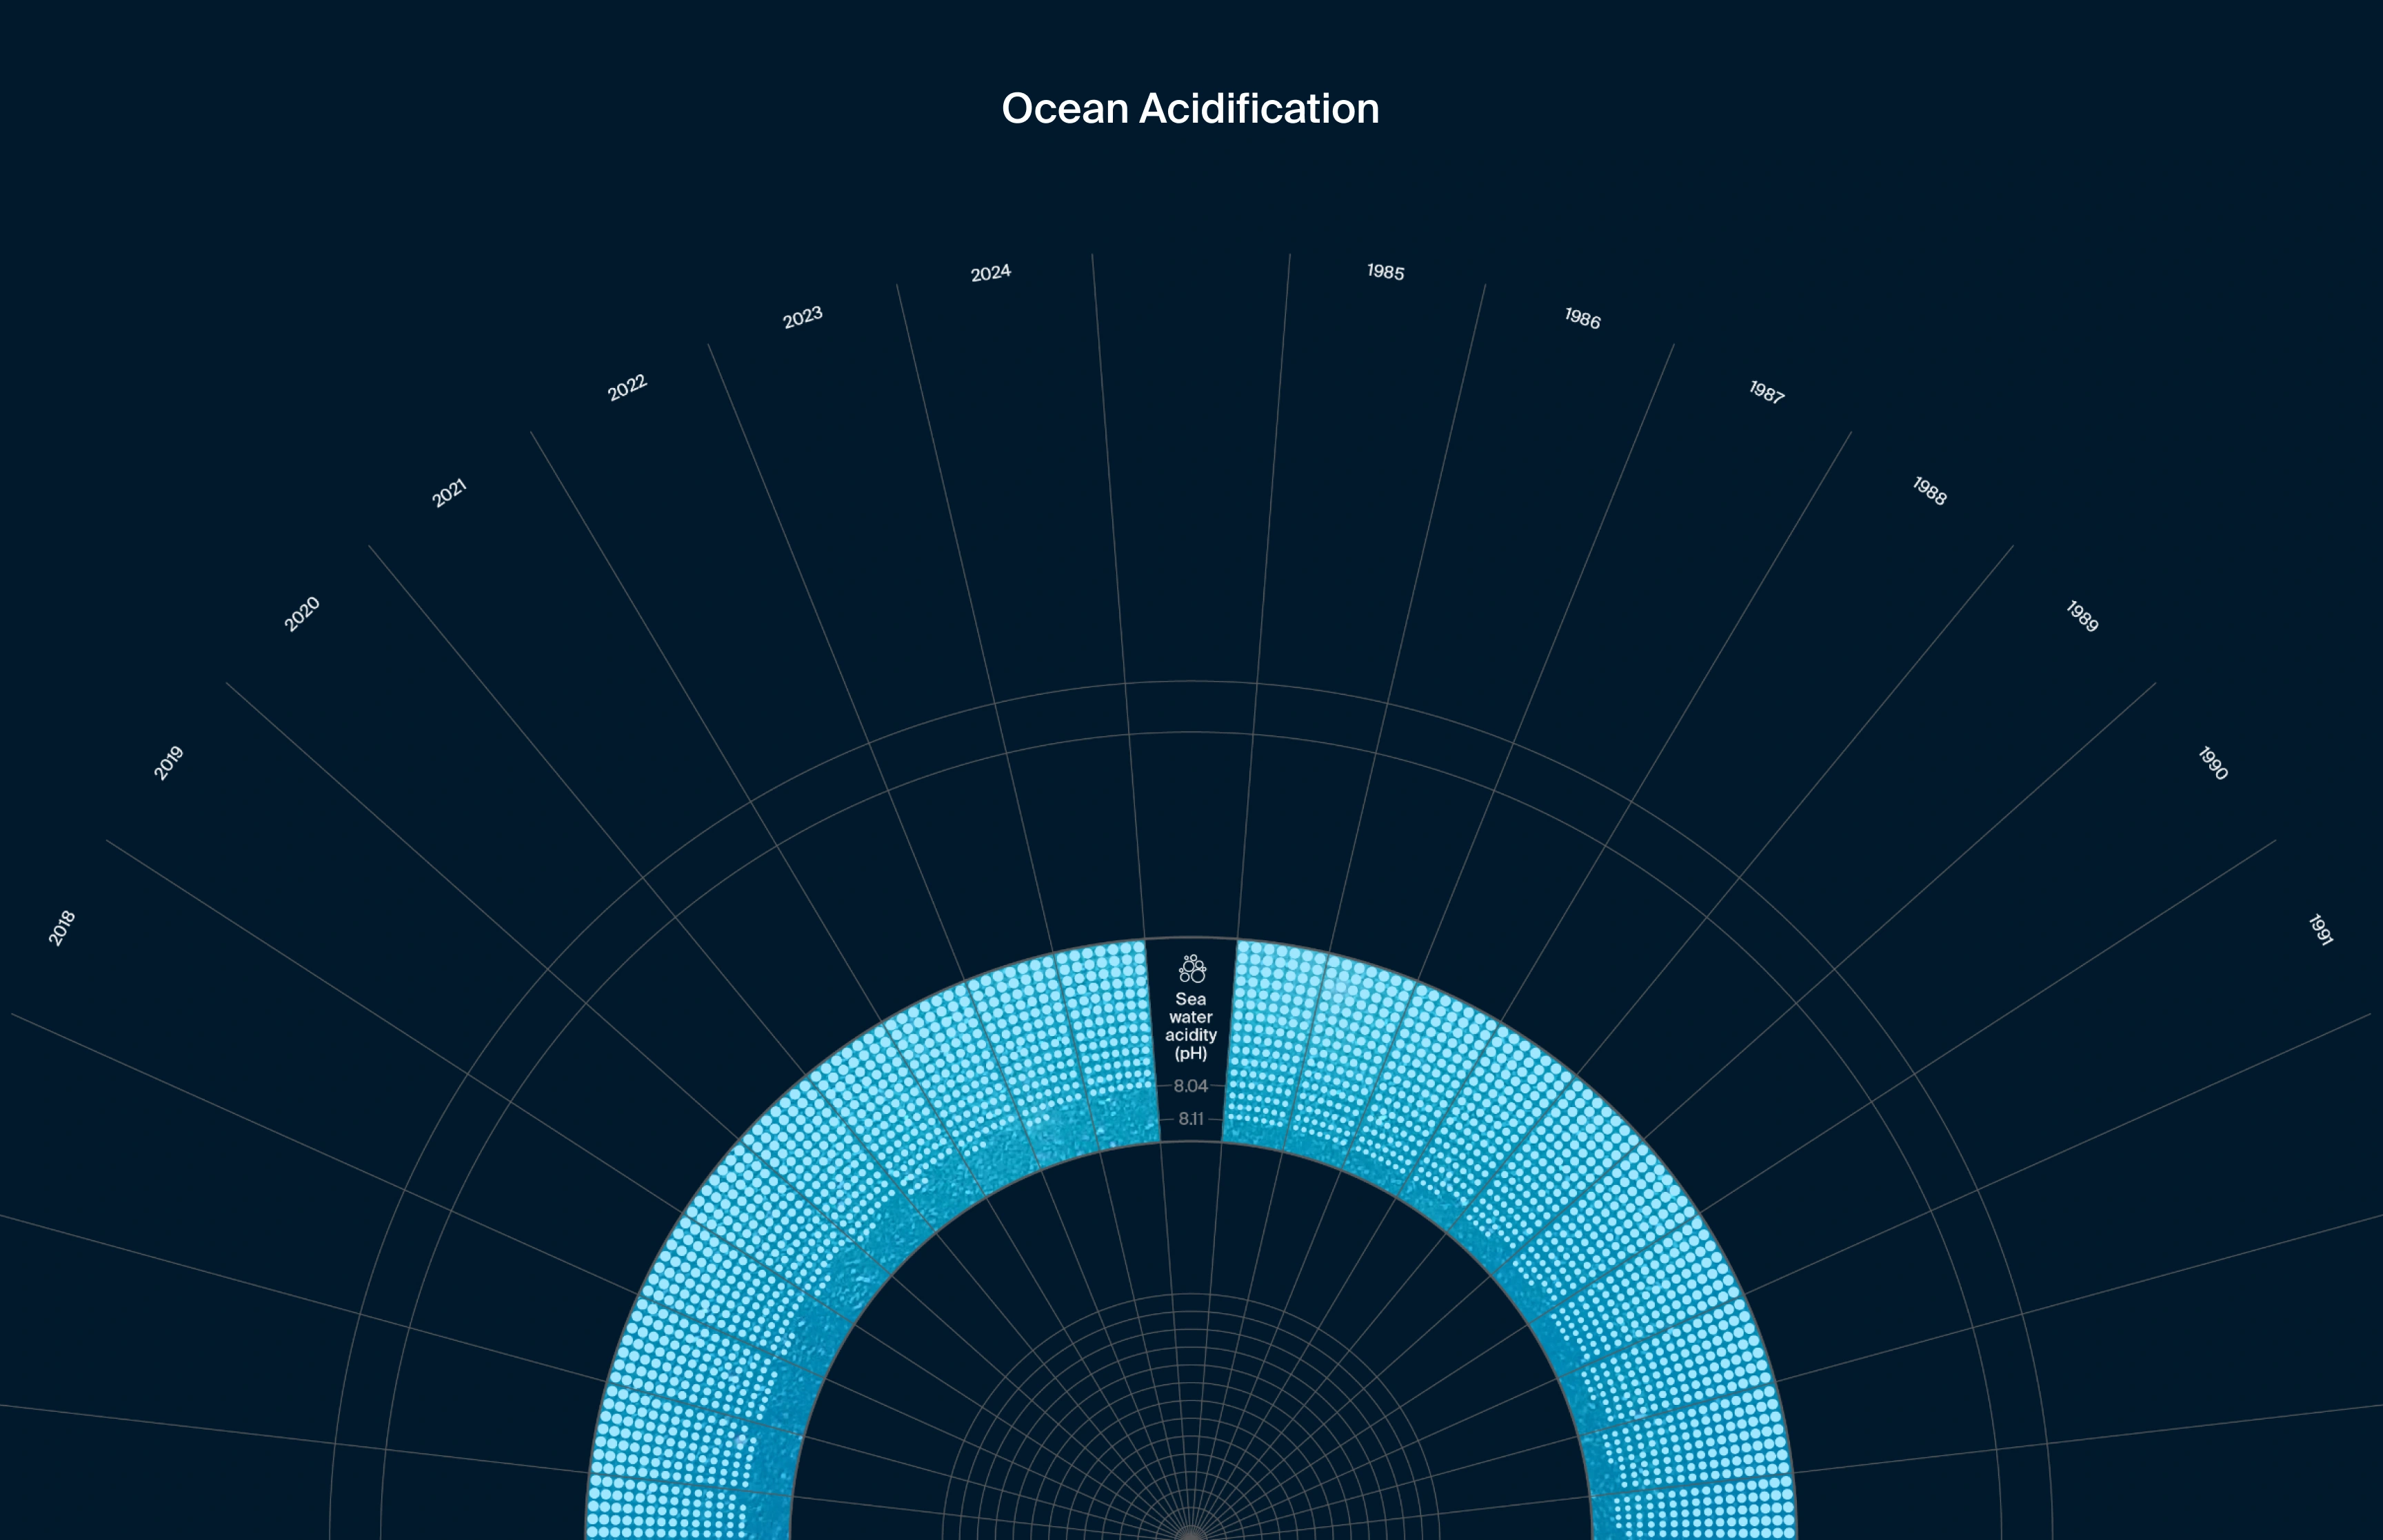
Mean Sea Water pH
As ocean carbon uptake rises, sea water pH decreases. Mean Sea Water pH is represented using a similar visual approach, but with circles instead of lines. This indicator highlights the ongoing process of ocean acidification, which has significant impact for marine ecosystems and biodiversity.
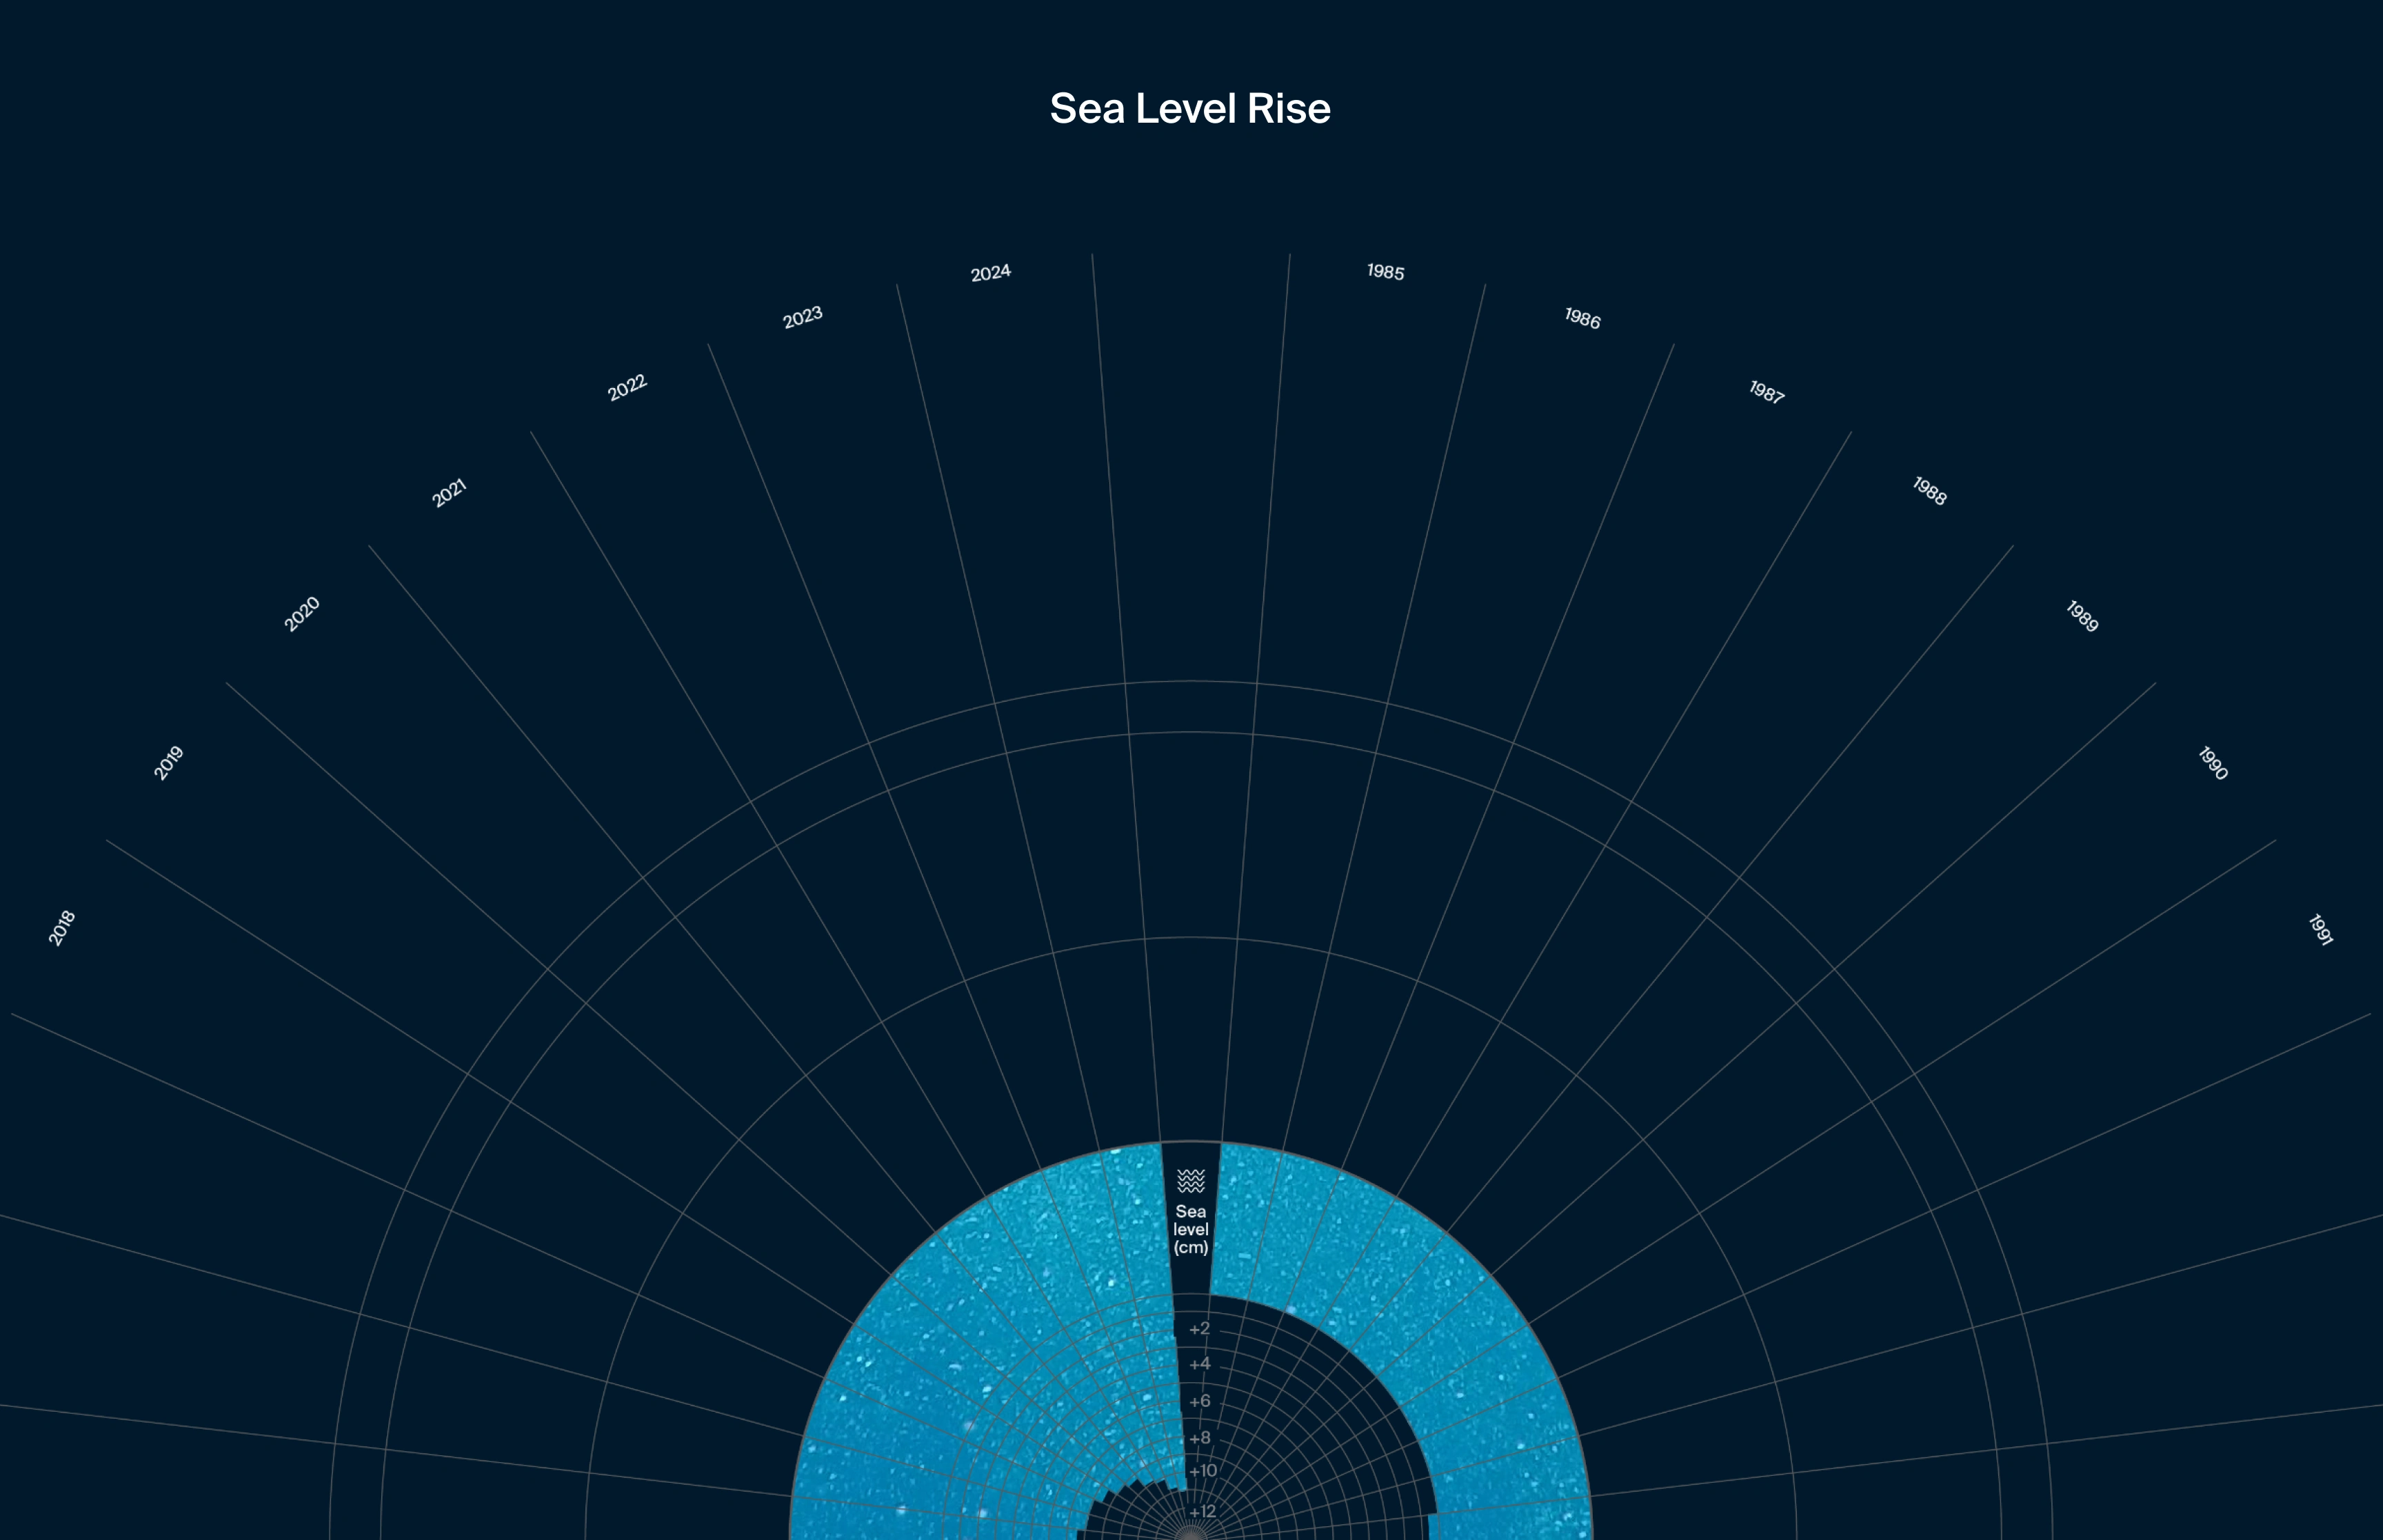
Mean Sea Level Increase
The innermost ring represents Mean Sea Level Increase (cm) using a circular bar chart. Since the available data begin in 1993, values for preceding years are displayed at a constant height to maintain continuity within the visualization.
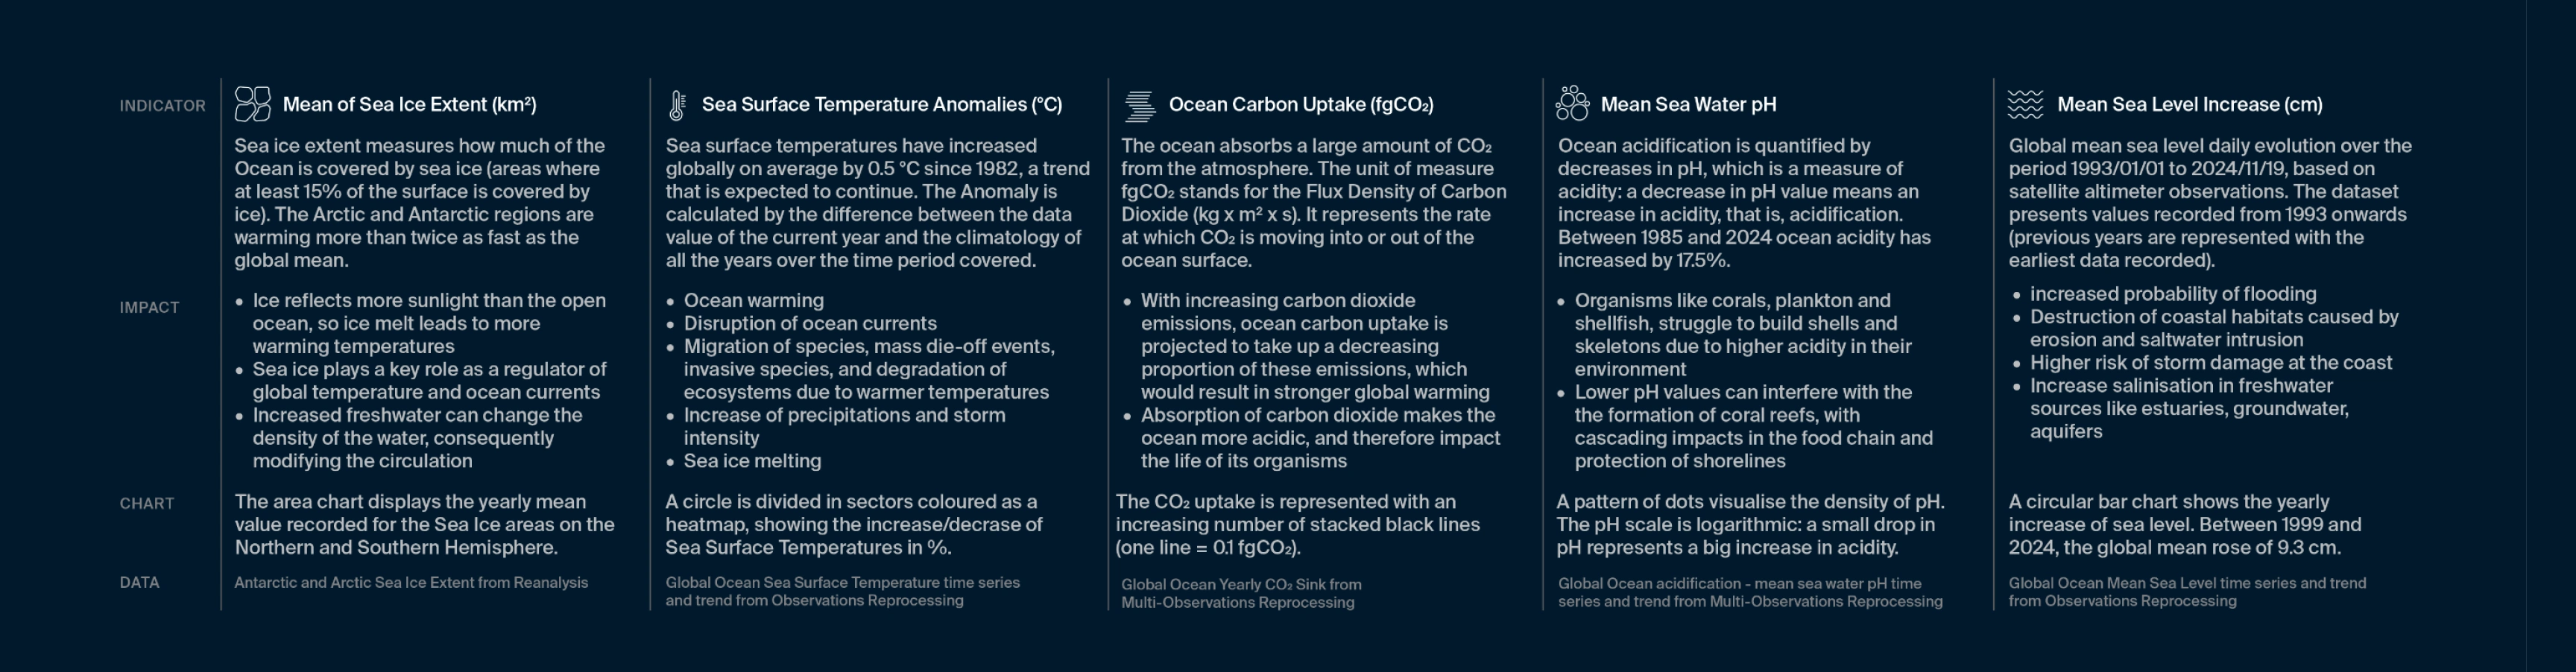
Legend
At the bottom of the poster, each indicator is accompanied by an icon, a short description, its environmental impact, the visual model used, and the source data.
Sources:
Sea Surface Temperature: https://marine.copernicus.eu/ocean-climate-portal/sea-surface-temperature
Overall, the data visualization is designed to reveal the differences between historical and recent ocean conditions. The circular structure also allows the design to scale easily as new years of data become available. Additionally, the layout can be adapted to display grouped periods, such as 5 or 10-year intervals, as small multiples for comparative analysis.
Like this project
Posted Aug 31, 2026
Ocean Status is an annual calendar that presents sea data through 5 indicators, together composing 40 years of recorded observations by Copernicus.
Likes
1
Views
9