Excel-Based Personal Finance Tracker Development
Oluchi Umeh
Personal Finance Tracker
Project Overview
This Personal Finance Tracker is a comprehensive Excel-based dashboard designed to help users monitor and manage their income, expenses, and savings efficiently. Built using Power Pivot, Power Query, and interactive slicers, this project simulates a real-world scenario where multiple financial data sources are integrated, modeled, and visualized to provide actionable insights. This is not just an Excel sheet—it's a dynamic financial management tool.
Why This Project Matters
In today’s world, being able to tell a story with data is key. This tracker is more than just numbers—it's a clear narrative of income sources, spending habits, and savings goals. As a Data Analyst, I wanted to demonstrate:
My ability to structure data from scratch
Build meaningful relationships via a data model
Present insights in a clear, interactive dashboard format
Solve a real-world problem with storytelling and analytics
Tools & Skills Used
Microsoft Excel
Power Pivot
Power Query
PivotTables & PivotCharts
Slicers for interactivity
Data Modeling
Data Storytelling
Project Objectives
Track and analyze personal finances
Build a professional dashboard for non-technical users
Create a scalable and dynamic reporting system
Simulate business analysis experience through personal finance
Project Structure
Data Collection
I manually structured five main datasets:
Income Table: Tracks all income sources, amounts, and dates
Expenses Table: Logs spending categories, vendors, and payment methods
Savings Table: Includes savings category, institution, and amounts
Date Table: Supports time-based analysis
Category Table: Standardizes classification for income, expenses, and savings
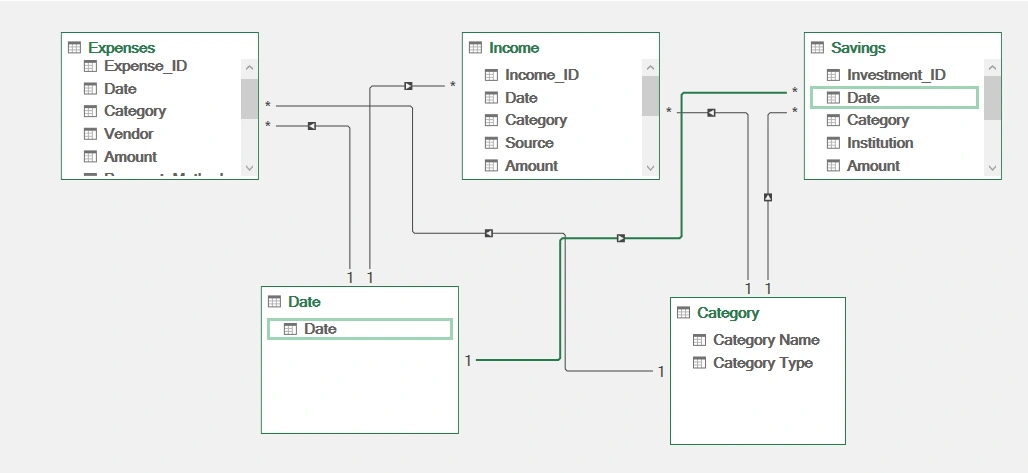
Data Modeling
Using Power Pivot, I:
Established relationships across the five tables using primary keys
Created a star schema model to enable efficient querying and filtering
Linked slicers like Category Type, Date, and Category Name to drive the dashboard's interactivity
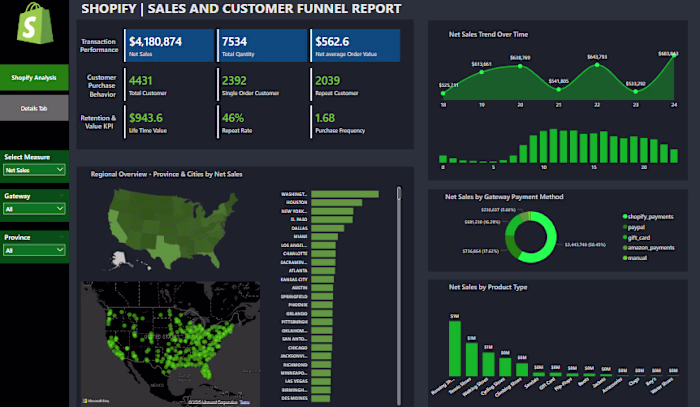
Dashboard Creation
I created two key sheets:
Dashboard Sheet Total income, expenses, and savings cards
Pie chart of income by category
Tree map of expenses by category
Bar chart of savings by category
Trend lines showing monthly income, expenses, and savings
Slicers for category type, date range, and category names
Details Sheet Deep dive into sources of income, vendors, and institutions
Payment method breakdowns
Additional pie and bar charts for clarity
Fully interactive for deeper storytelling
Insights Discovered
My savings rate is 83%, which indicates strong financial discipline
Most income comes from salary and freelancing
Highest expenses are on food and entertainment
Top savings went into real estate and bank deposits
There is a monthly pattern to both income and expenses that can help budgeting decisions
Key Takeaways
Learned how to structure and model data in Excel like a mini-database
Created interactive and accessible dashboards suitable for non-technical stakeholders
Improved data storytelling through visuals, summaries, and insights
Reinforced my understanding of self-service BI using Excel
Like this project
Posted Jun 12, 2025
Developed an Excel-based personal finance tracker with interactive dashboards using Power Pivot and Power Query.
Likes
1
Views
2