Shopify Sales & Customer Funnel Dashboard
Oluchi Umeh
Shopify Sales & Customer Funnel Dashboard
Visualizing E-commerce Performance with Power BI
Overview
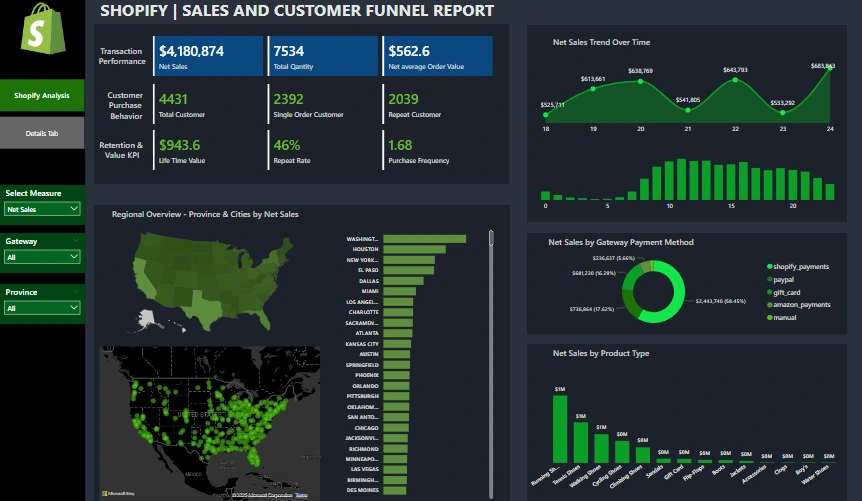
This project showcases an end-to-end business intelligence solution built with Power BI, using Shopify’s e-commerce dataset. The goal was to analyze sales performance, understand customer behavior, evaluate purchase patterns, and highlight business growth opportunities through interactive dashboards and data storytelling.
Objectives
The project was designed to:
Analyze key metrics such as Net Sales, Order Value, Customer Segments, and Purchase Frequency.
Understand customer lifecycle behavior (single vs repeat customers).
Identify sales trends over time, top-performing products, and geographic hotspots.
Explore payment behavior through various gateway methods.
Provide stakeholders with interactive filters to drill into specific segments like provinces, gateways, and time periods.
Things to Know (Before Exploring)
This dashboard answers questions like:
How much revenue is the business generating, and from where?
Are customers making repeat purchases or just buying once?
What’s the time value of a customer?
Which payment methods and products generate the most sales?
Which locations drive the most traffic and purchases?
What’s the purchase behavior by time and gateway?
If you're an e-commerce manager, analyst, or executive, this dashboard provides all the insights you need to drive strategy.
Dashboard Preview
Tools & Technologies Used
Power BI Desktop: For creating interactive reports and dashboards.
Power Query: Used to clean, filter, and transform raw data.
DAX: Custom measures and KPIs (like Net Sales, Average Order Value, Purchase Frequency, Repeat Rate, etc.).
Insights Gained
High Customer Lifetime Value ($943) suggests loyal and valuable customers.
46% Repeat Rate is a strong indicator of customer satisfaction and retention.
Geographic Hotspots: Major cities like Washington, Houston, and San Diego led in net sales.
Shopify Payments dominated the payment gateways, followed by PayPal.
Sales Consistency: Net sales remained relatively stable with some seasonal trends.
Top Product Types: Certain products significantly outperformed others, informing inventory strategy.
What I Did
Cleaned and transformed raw data using Power Query.
Created calculated columns and KPIs using DAX.
Designed a dark-themed dashboard that’s professional, interactive, and presentation-ready.
Focused on storytelling with data, letting users explore the entire customer journey from transaction to retention.
About Me
I'm a data analyst passionate about transforming raw datasets into compelling insights. My skills span Excel, SQL, Power BI, and Python, with a keen focus on business impact and user-friendly dashboards.
Like this project
Posted Jun 12, 2025
Built a Power BI dashboard to analyze Shopify's sales and customer behavior.