GitSnap | Browser Extension

Franklin Ohaegbulam


GitSnap
GitHub Repositories Metrics Visualization Browser Extension
Project Overview
Duration: 2 weeks
Role: Chrome Extension Developer
Technologies: HTML, CSS, JavaScript, Apache ECharts, Chrome Extension APIs
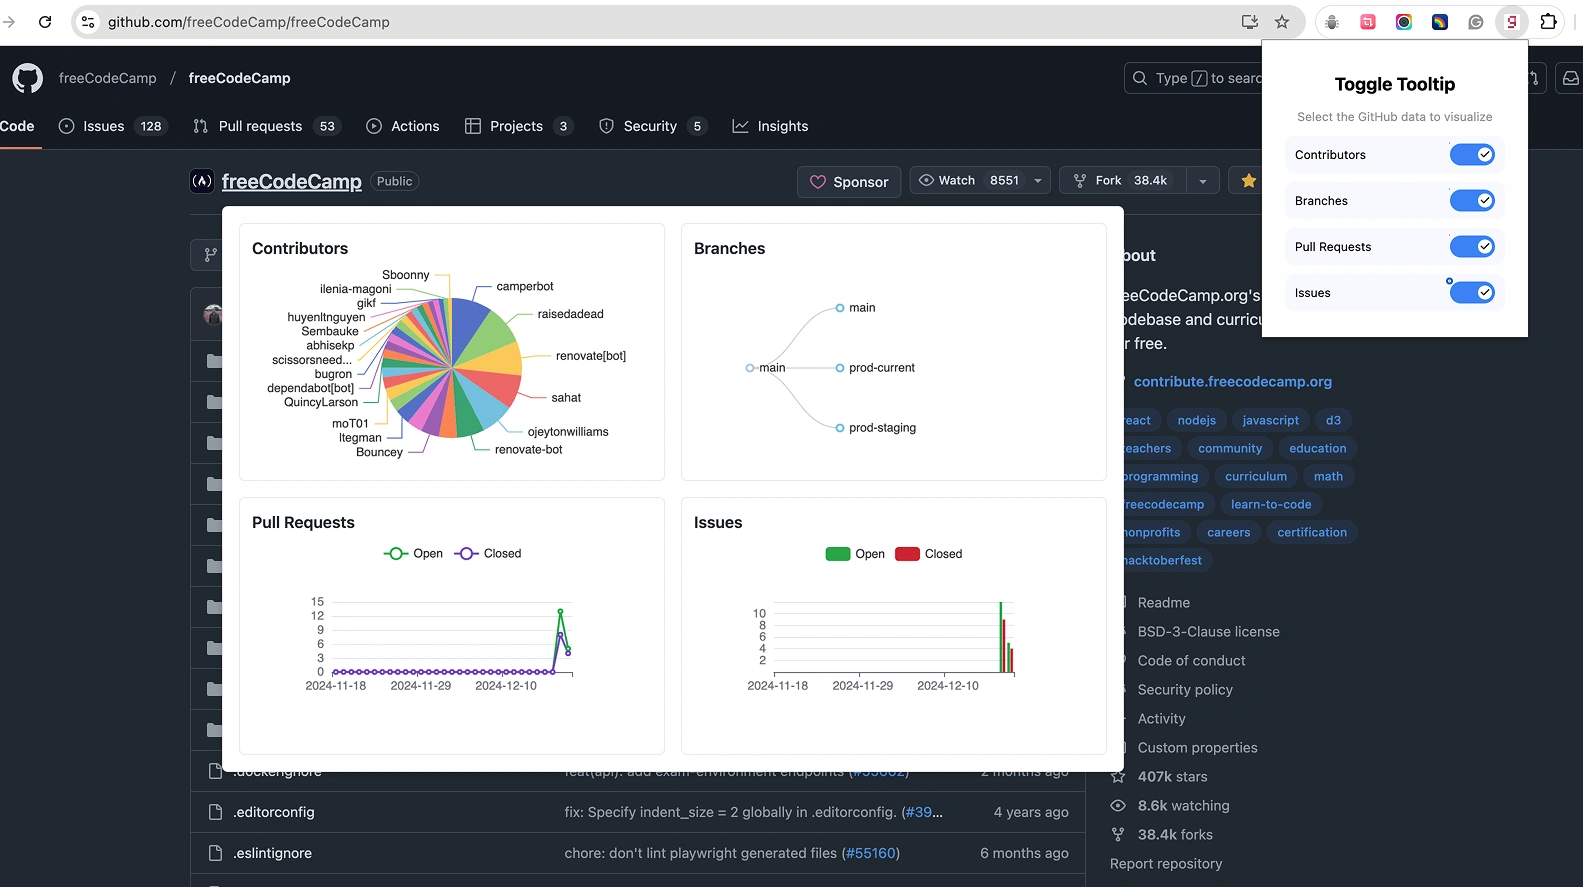
GitSnap is a Chrome extension that transforms GitHub repository data into interactive visual insights directly inside GitHub. Instead of navigating through multiple tabs or external analytics tools, developers can hover over any repository to understand the contributor activity, pull request stats, issue progress, and branch structures.
The goal is to make open-source repositories easier to understand at a glance while keeping developers inside their existing GitHub workflow.
The Challenge
GitHub provides an enormous amount of repository data, but most of it is buried across multiple pages and tabs. Quickly evaluating whether a project is active, well-maintained, or worth contributing to often requires manually checking contributors, pull requests, issues, commits, and branches individually.
For developers exploring dozens of repositories every day, this creates unnecessary friction and interrupts productivity.
The challenge was to surface meaningful repository insights instantly without requiring users to leave the page or change how they already use GitHub.
My Role
I designed and developed GitSnap from the ground up, handling the complete product lifecycle from ideation to extension architecture and implementation.
Responsibilities included:
Designing the browser extension experience
Engineering the Chrome Extension architecture
Building the visualization engine
Integrating GitHub repository data
Optimizing rendering performance
Designing customizable chart interactions
The Solution
Whenever users hover over a repository link, GitSnap generates rich visual summaries powered by Apache ECharts, allowing developers to understand project metrics within seconds. Users can decide which repository metrics matter most by enabling or disabling the charts and graphs individually, to create personalized repository summaries.
Key Features
Interactive Repository Analytics
Repository metrics are transformed into visual charts that are significantly easier to understand.
Developers can instantly explore:
Contributor distribution
Pull request activity
Issue status
Branch relationships
without leaving the current page.
Contributor Insights
Visual breakdowns show how contributions are distributed across maintainers and contributors, making it easier to evaluate project activity and community engagement.
Instead of reading commit histories manually, users immediately understand who drives the project.
Pull Request Analytics
GitSnap visualizes pull request activity over the previous 30 days, helping users quickly identify:
Open pull requests
Merged pull requests
Closed pull requests
Issue Tracking Barchart
Issue activity is presented through interactive charts that highlight both open and resolved issues. This gives contributors immediate insight into the project, backlog size, and maintenance trends.
Branch Tree Structure
Repository branches are displayed as an interactive hierarchy, making complex branching strategies significantly easier to understand than traditional GitHub lists.

GitSnap landing page
Technical Implementation
Chrome Extension Architecture: GitSnap was built using the Chrome Extension APIs. This architecture allows the extension to inject repository insights directly into GitHub while maintaining fast response times and minimizing unnecessary resource usage.
Interactive Data Visualization: Integrated Apache ECharts to provide production-ready interactive visualizations with smooth animations, responsive layouts, and multiple chart types including:
Line charts
Pie charts
Tree diagrams
Bar charts
Performance Optimization: Repository data is processed only when users interact with repositories, reducing unnecessary rendering and ensuring the extension remains lightweight without slowing down page navigation.
The Challenges
My initial implementation explored D3.js due to its flexibility. However, its steeper learning curve and additional setup complexity slowed development, particularly for reusable interactive charts inside a browser extension.
Early versions suffered from communication issues between background scripts and content scripts, making certain interactions unreliable.
The Solutions
I migrated to Apache ECharts, which provided a mature visualization ecosystem, excellent documentation, optimized builds, and a broad collection of ready-to-use chart components.
I restructured the extension around Chrome's messaging system, clearly separating responsibilities between injected content scripts and background processes.
Results
Developers can assess repository activity within seconds without navigating across multiple GitHub pages.
A more maintainable architecture with faster communication, cleaner code organization, and more reliable interactions across GitHub pages.
An active user base with approximately 9 daily active users.
Like this project
Posted Dec 18, 2025
Built a Chrome extension that transforms GitHub repositories into interactive visualizations to analyze contributors, pull requests, issues, and branch stats.
Likes
1
Views
21
Timeline
Dec 20, 2024 - Jan 18, 2025
Clients
Open Source