Startify — SaaS Analytics Platform & UX UI Design
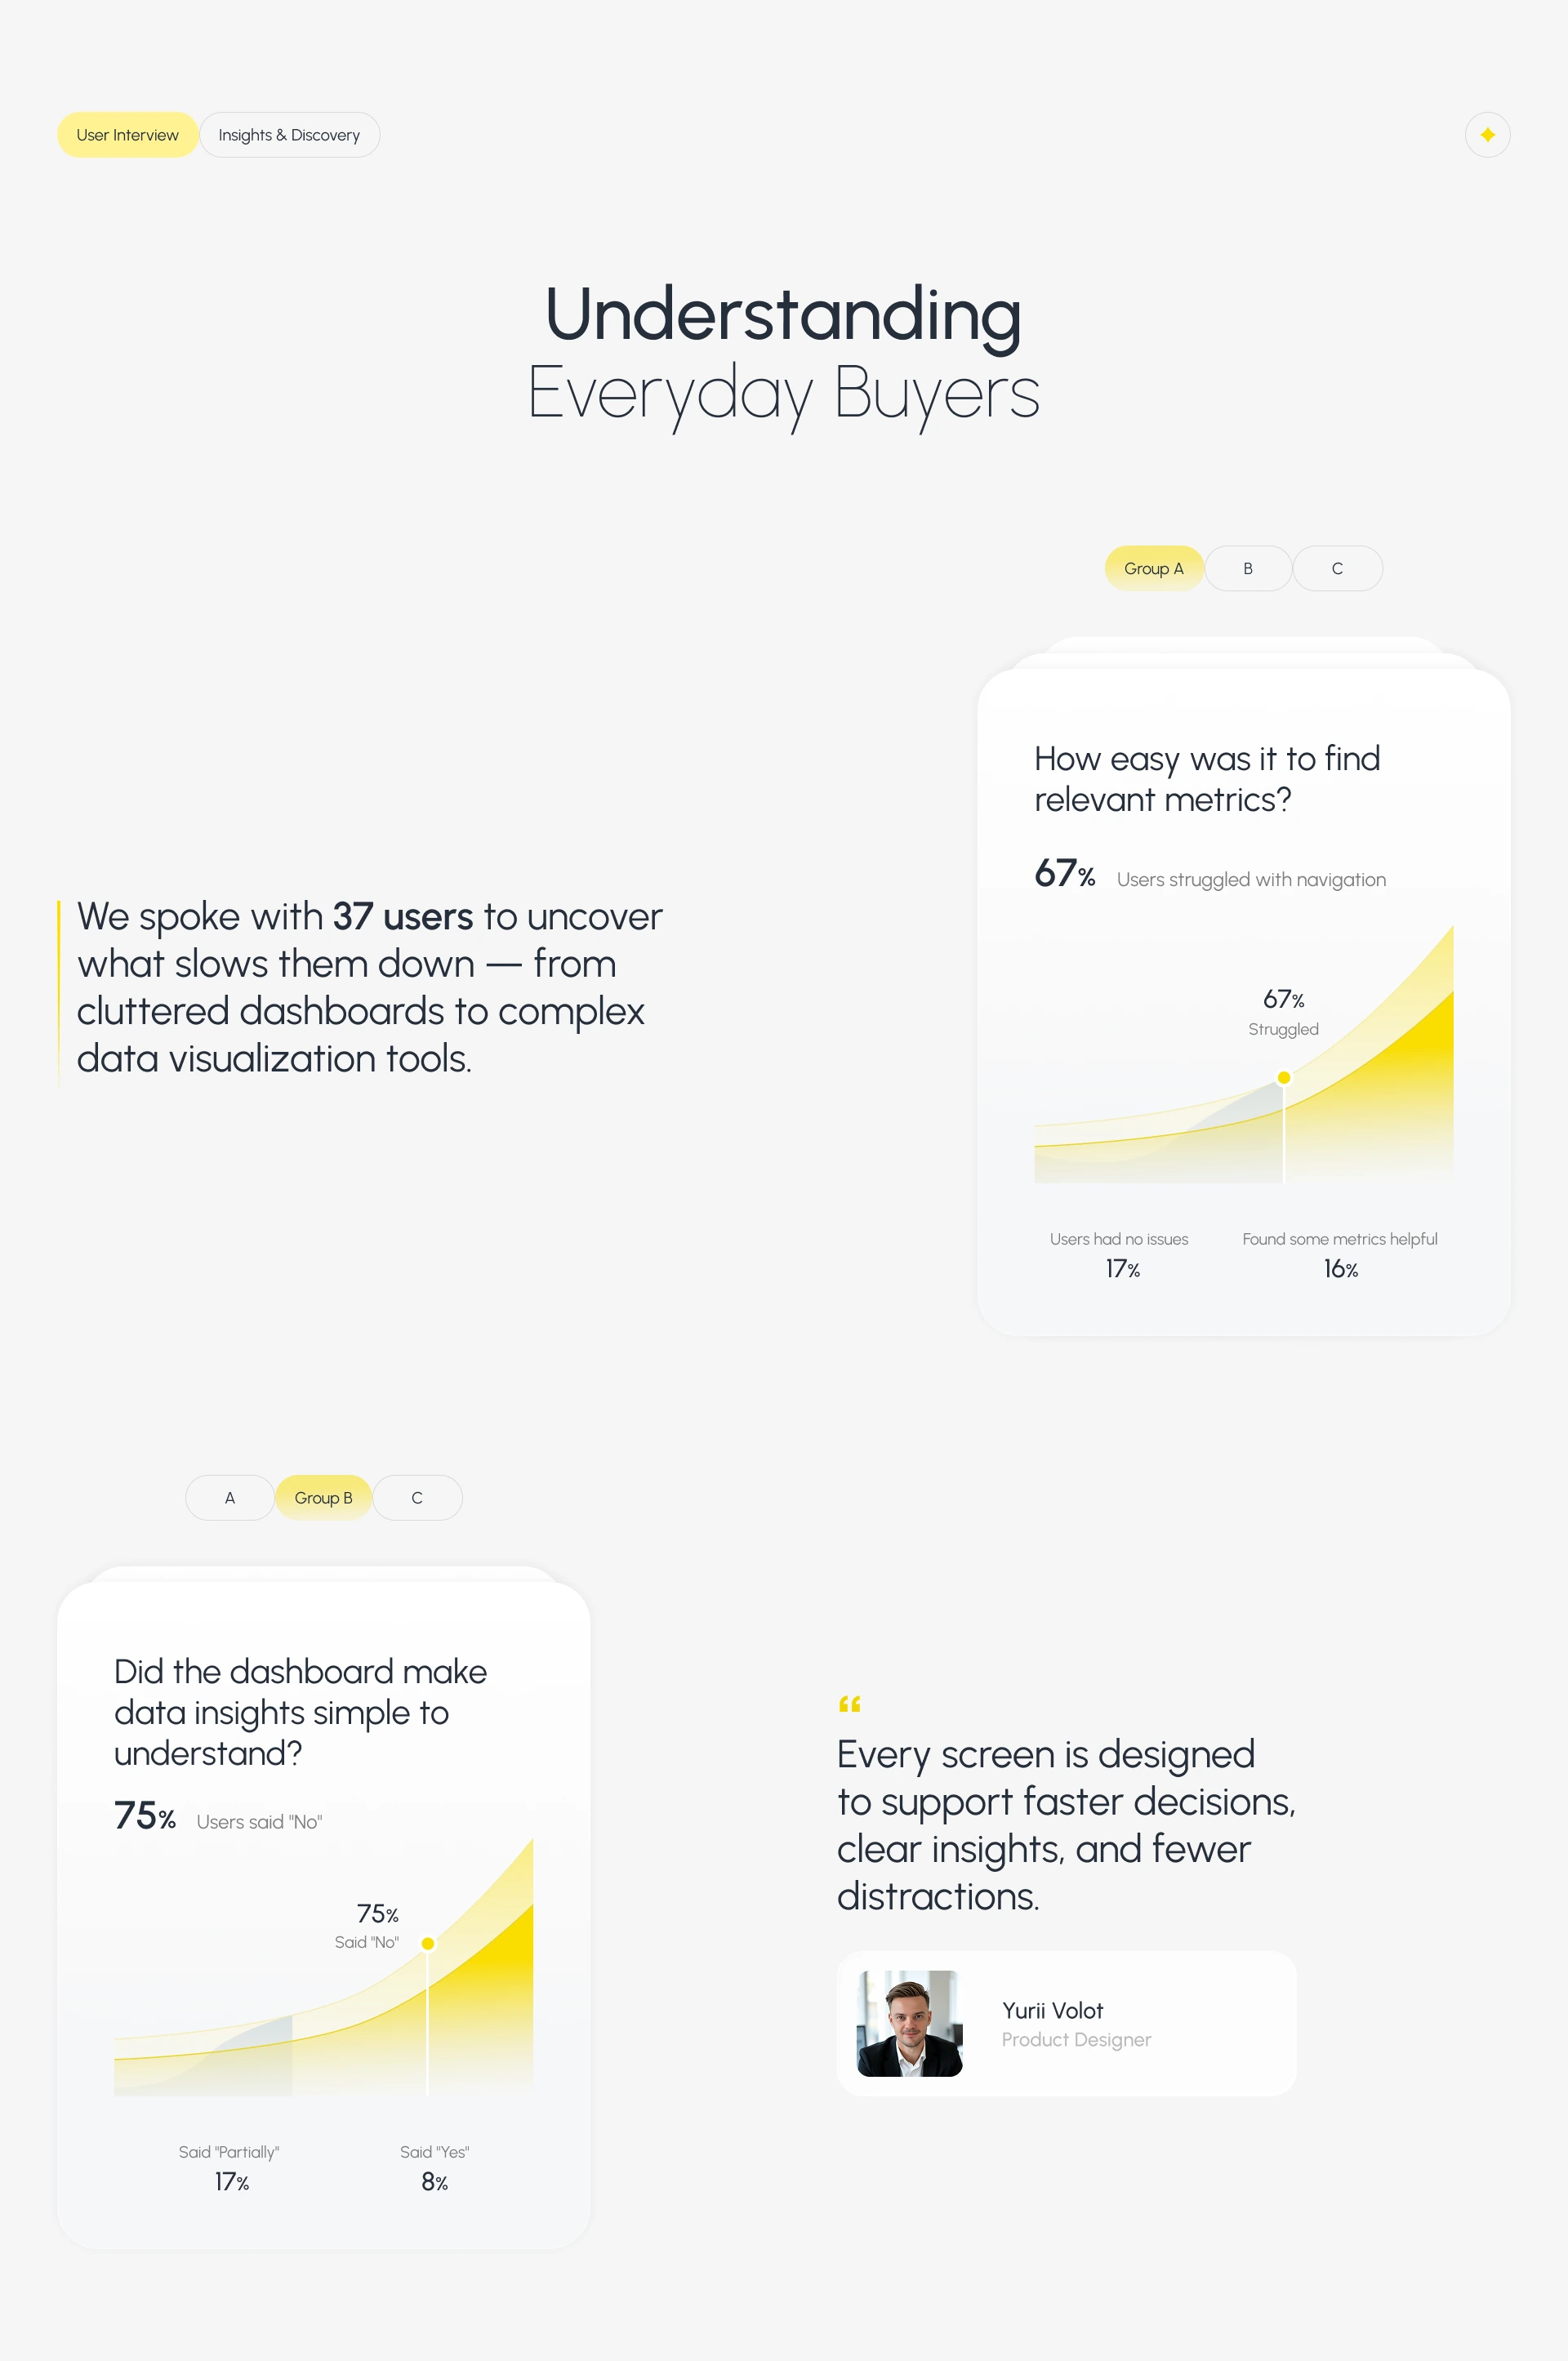
Yurii Volot
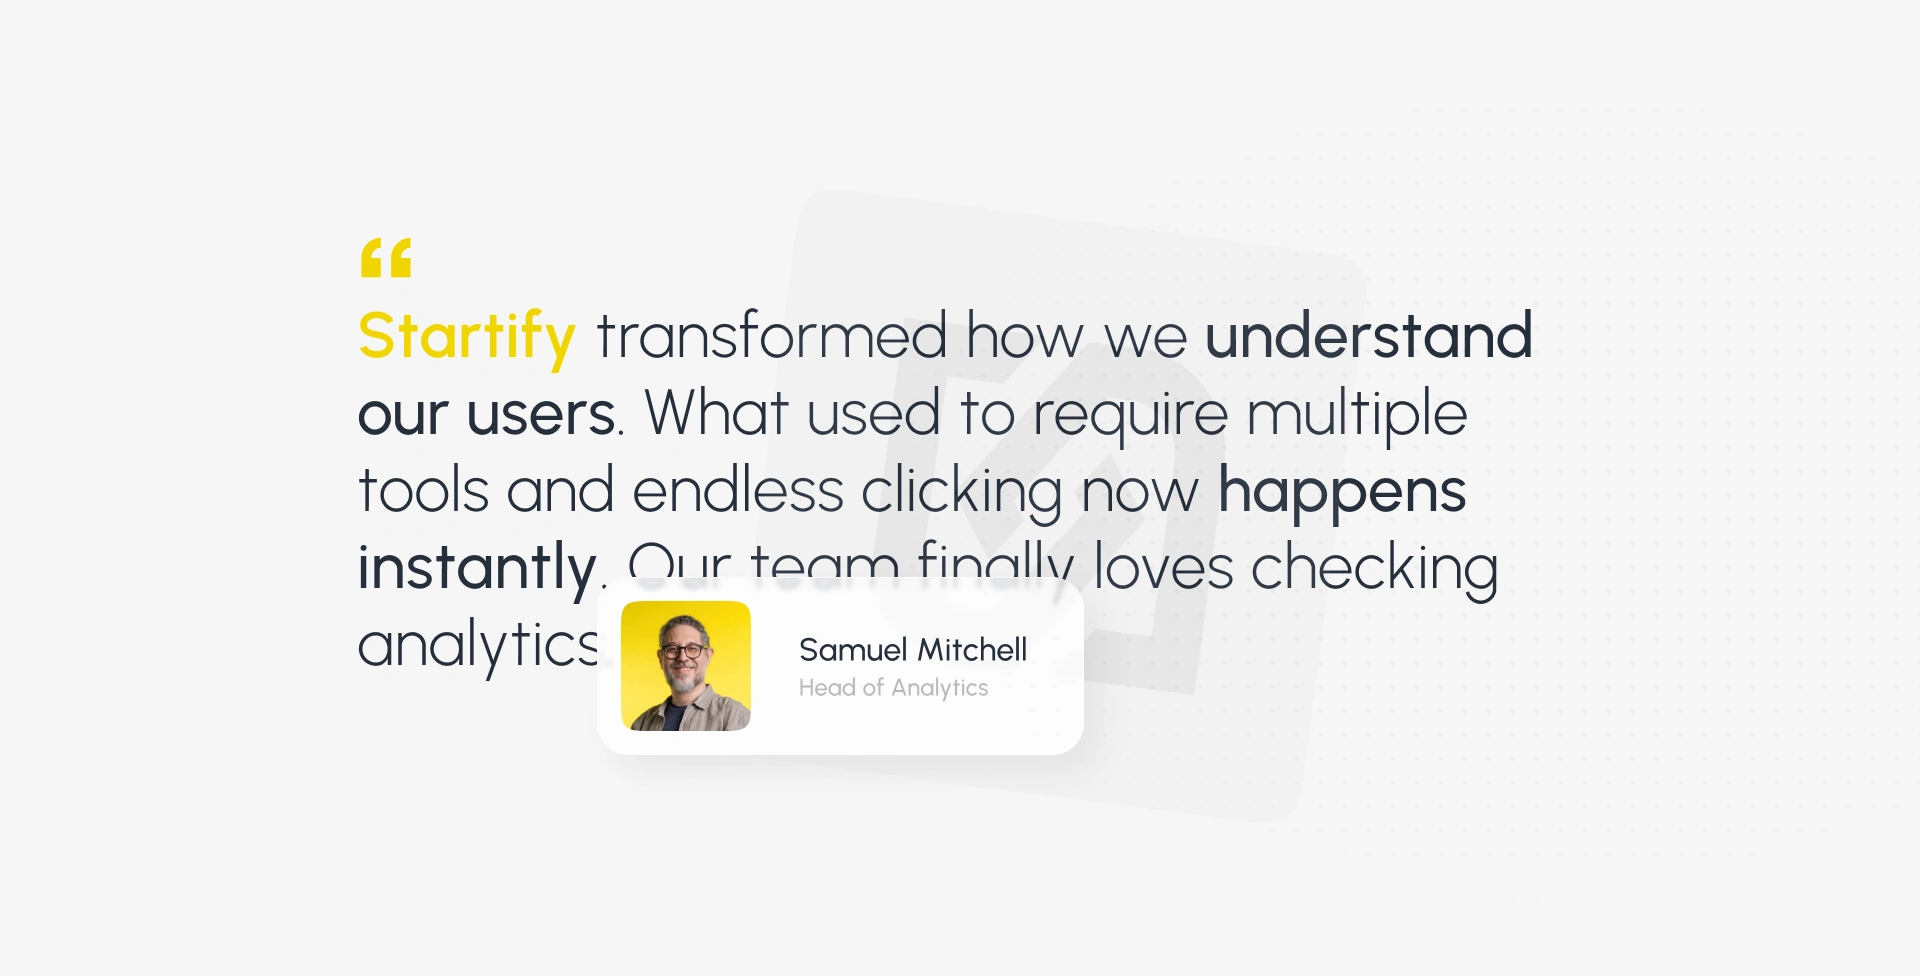
Startify transformed how we understand our users. What used to require multiple tools and endless clicking now happens instantly. Our team finally loves checking analytics.
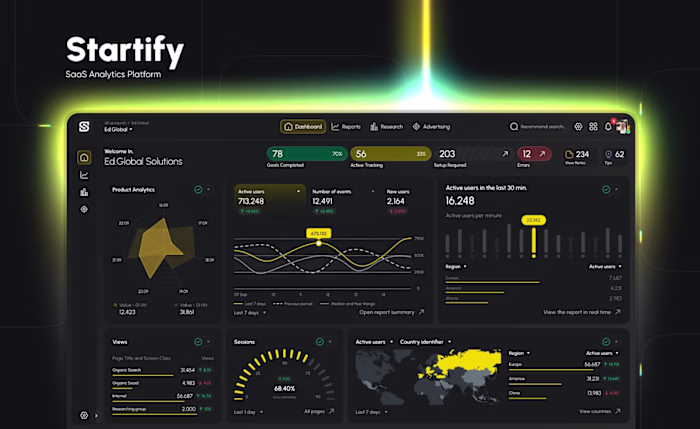
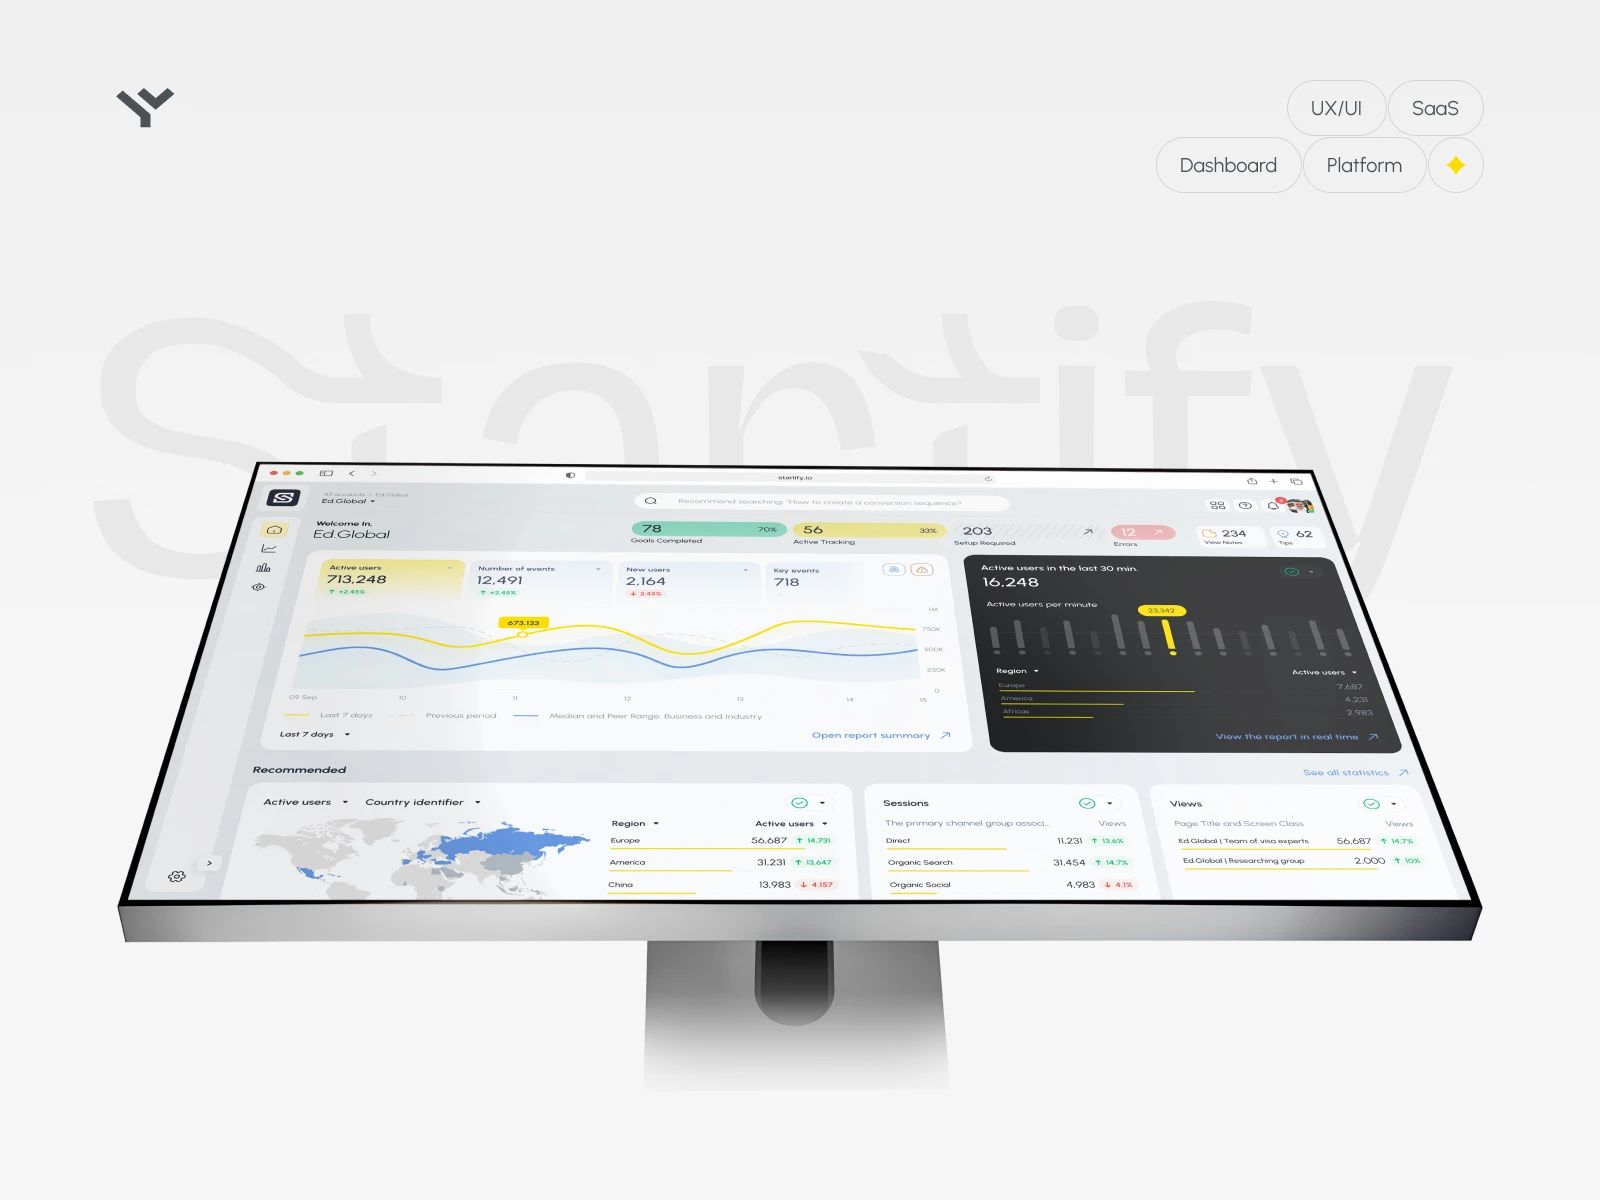
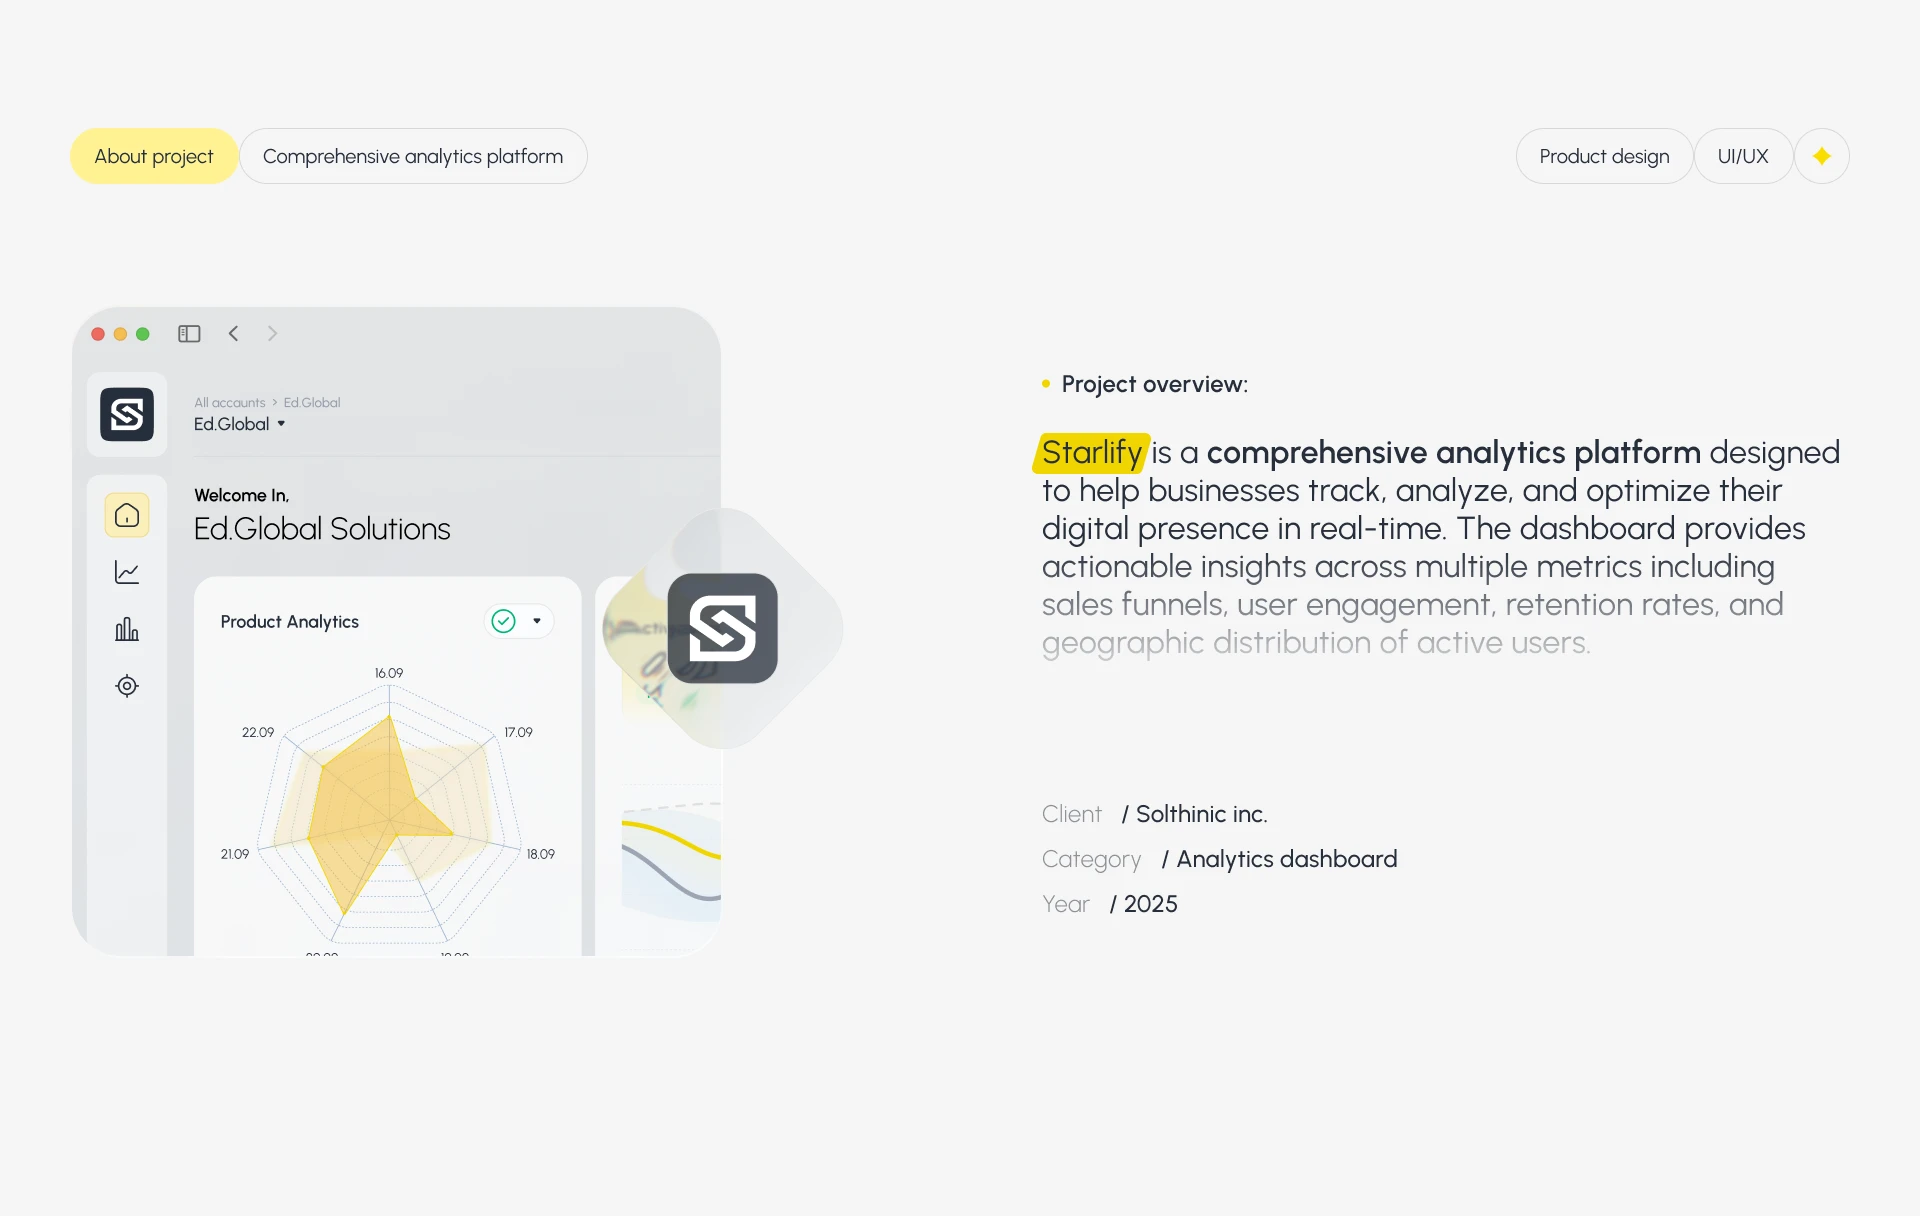
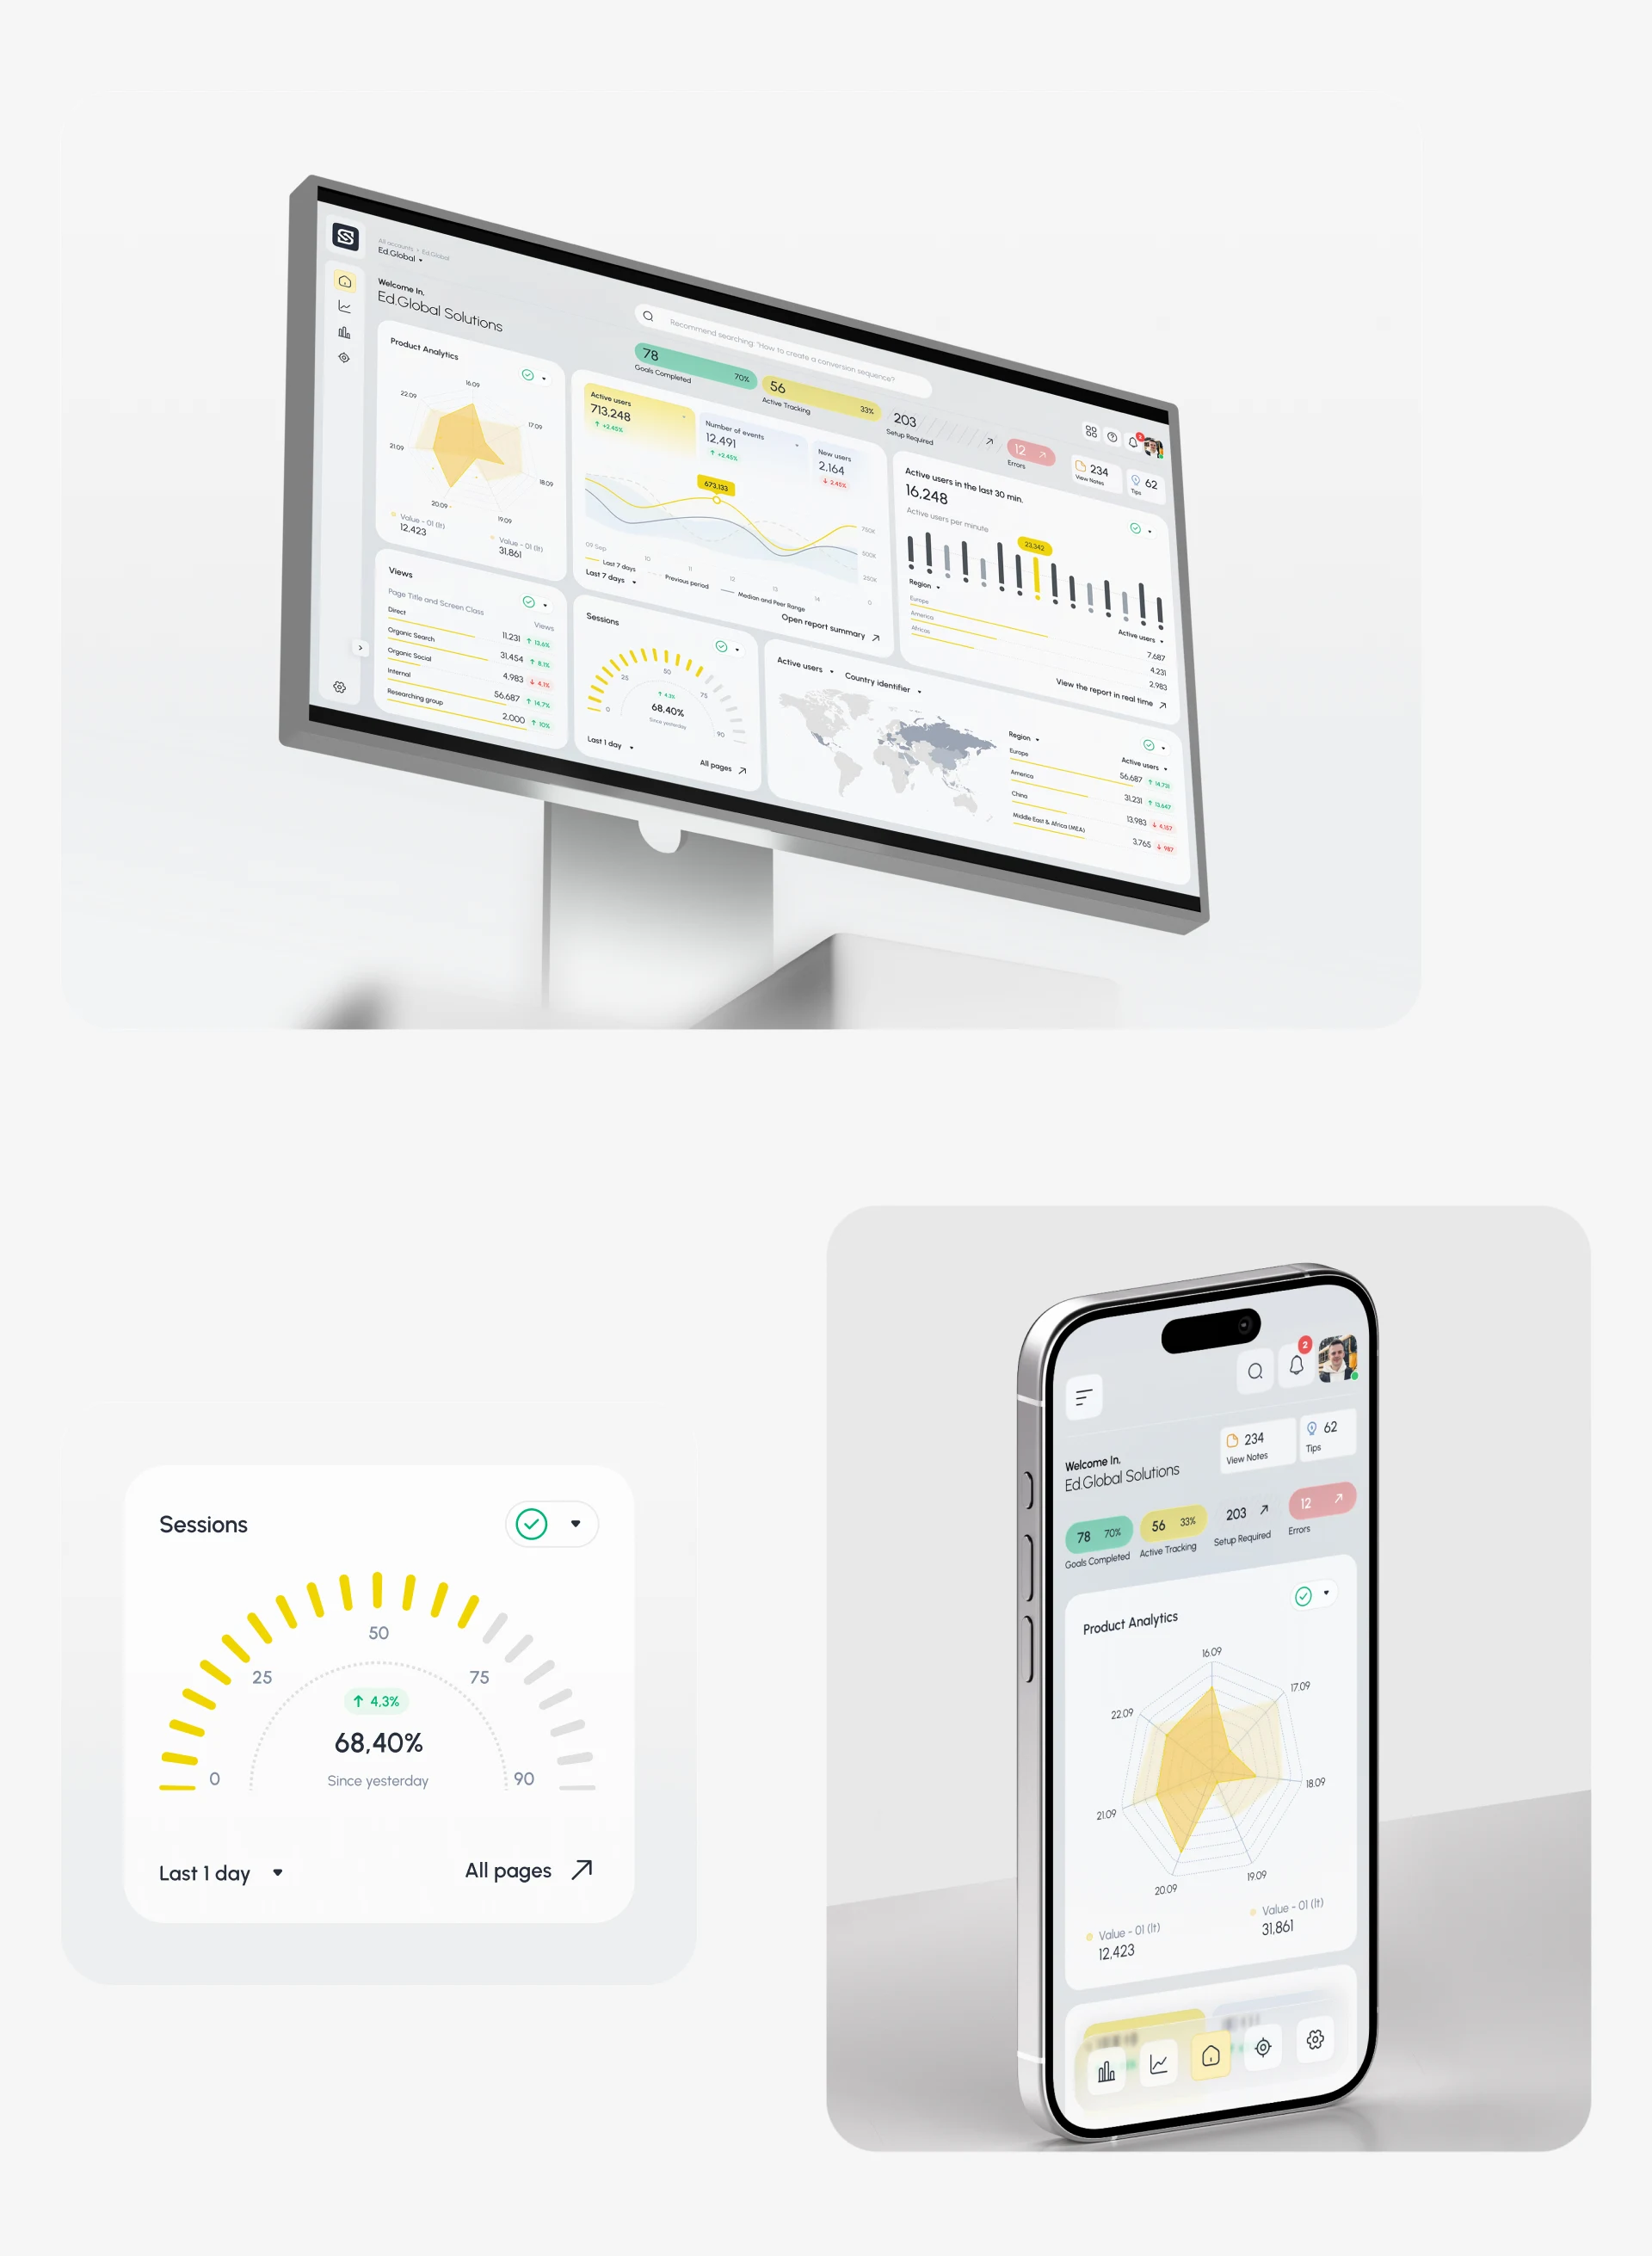
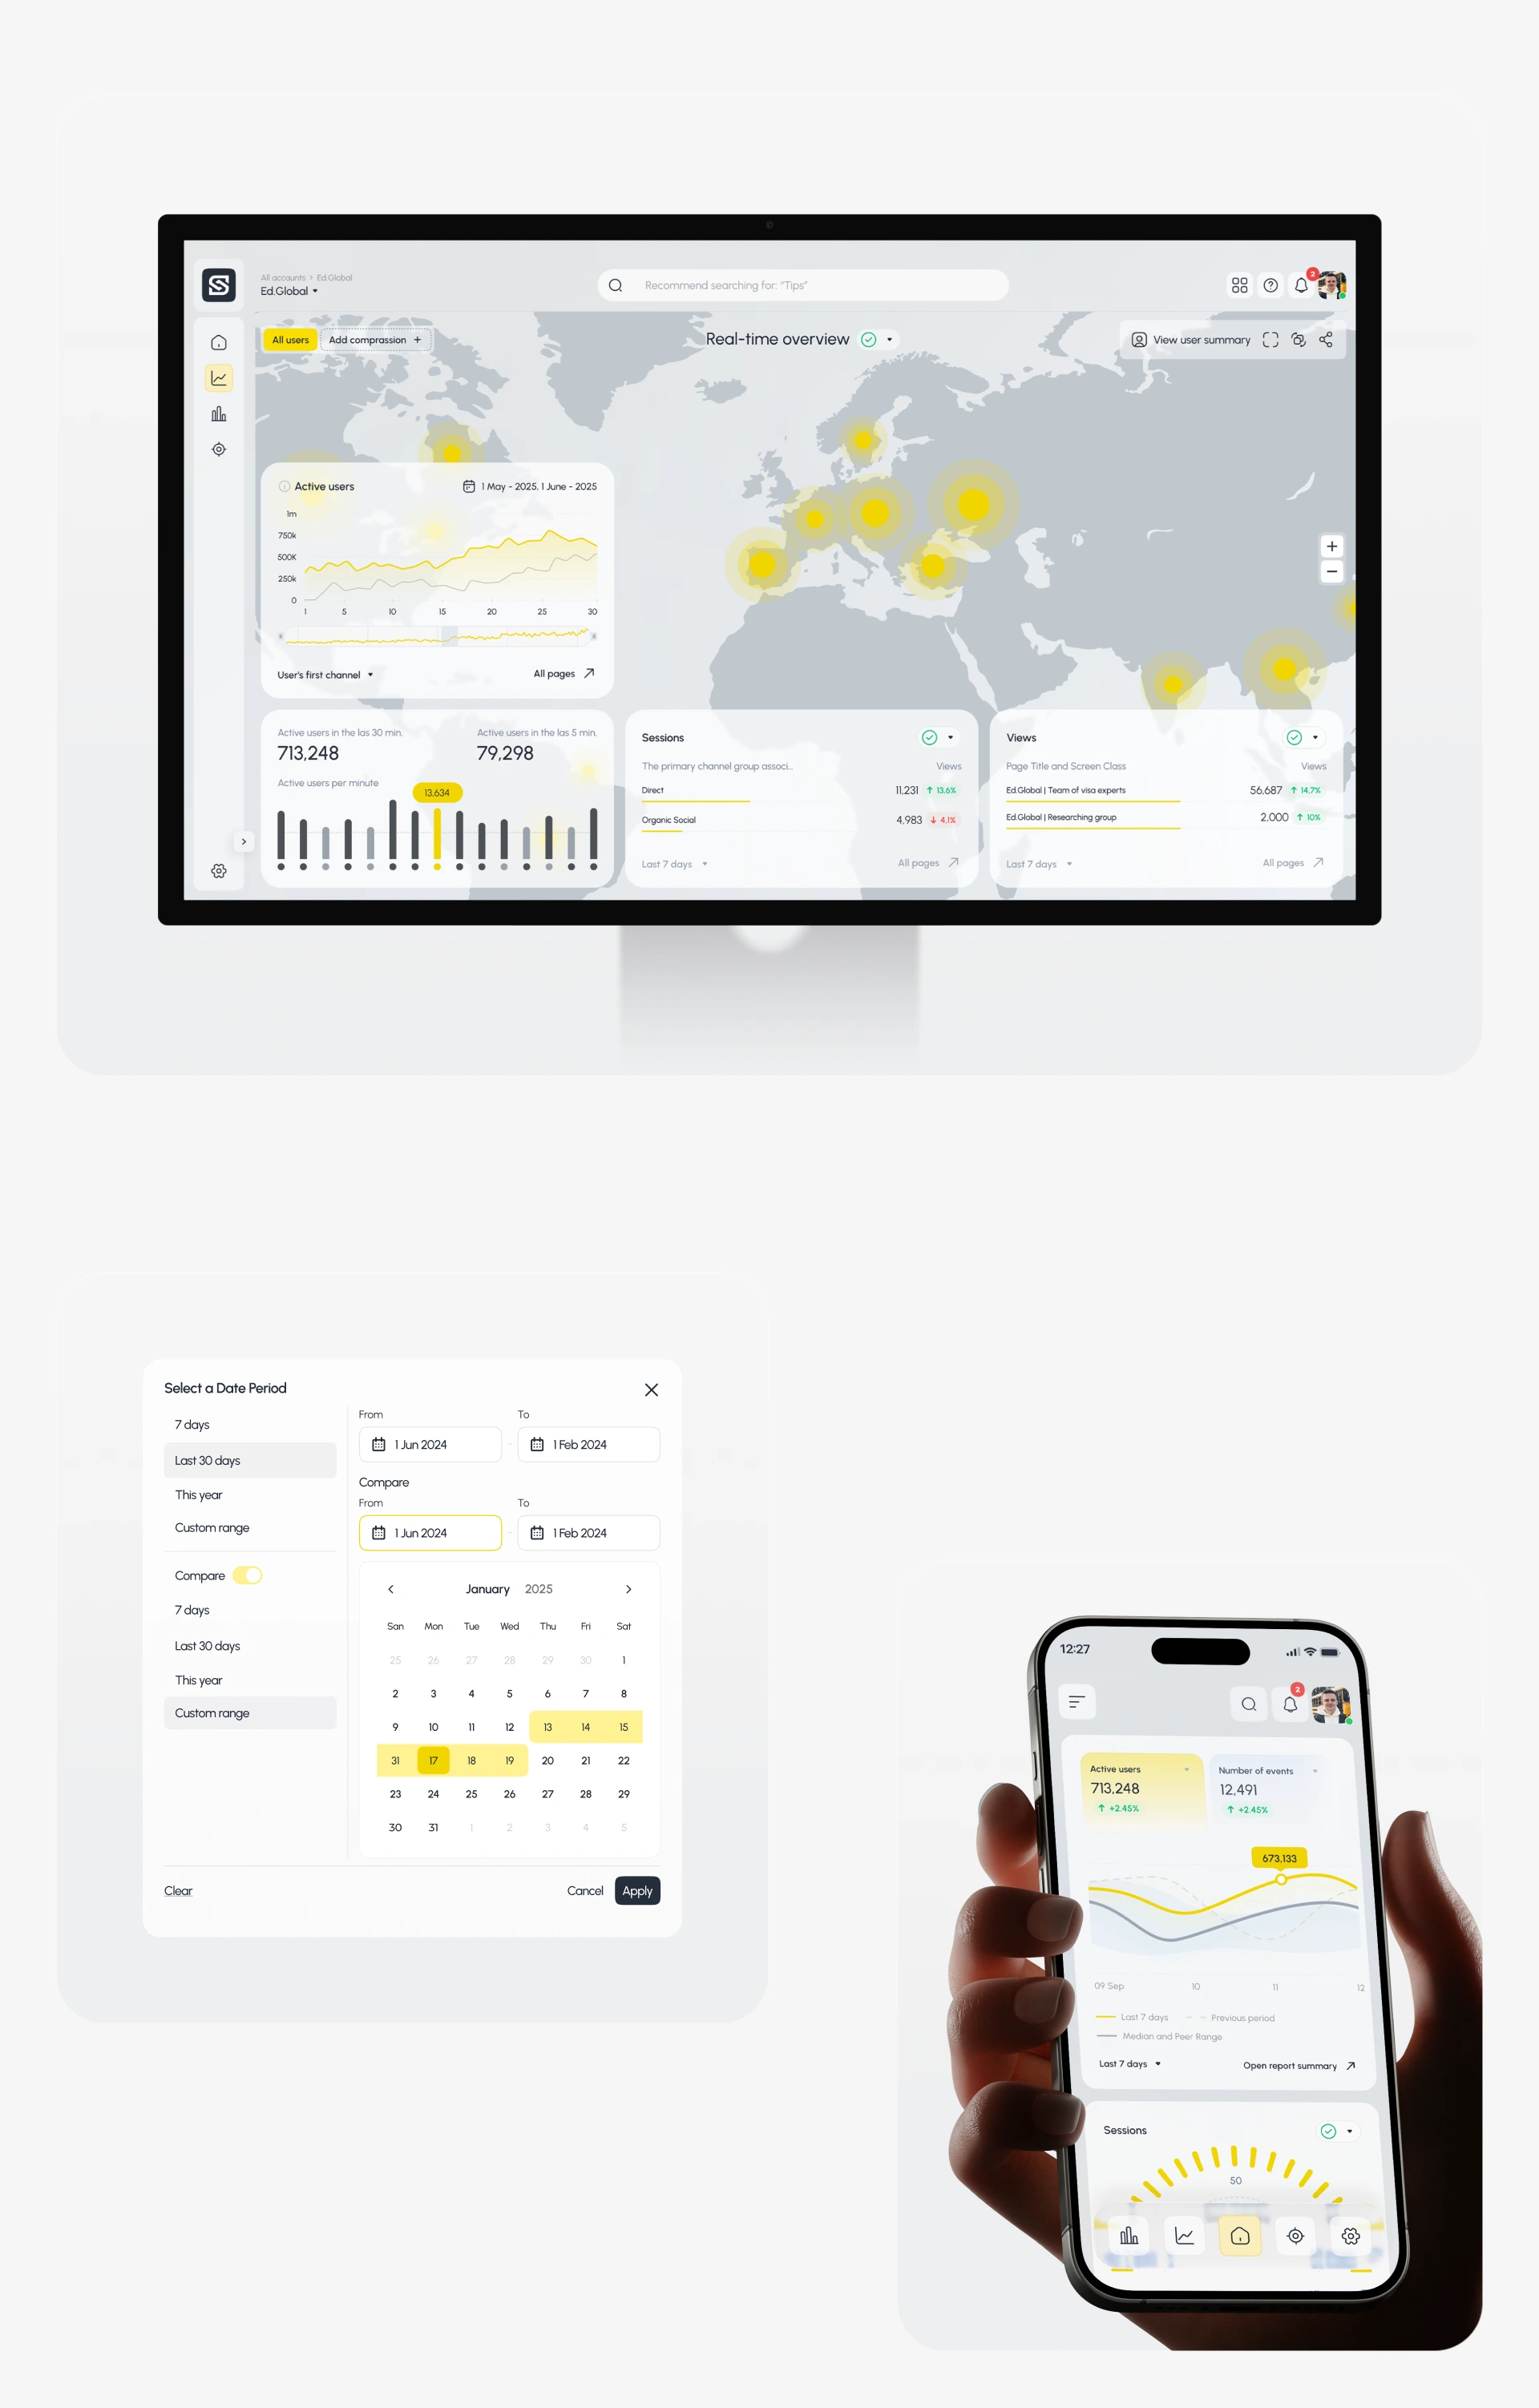
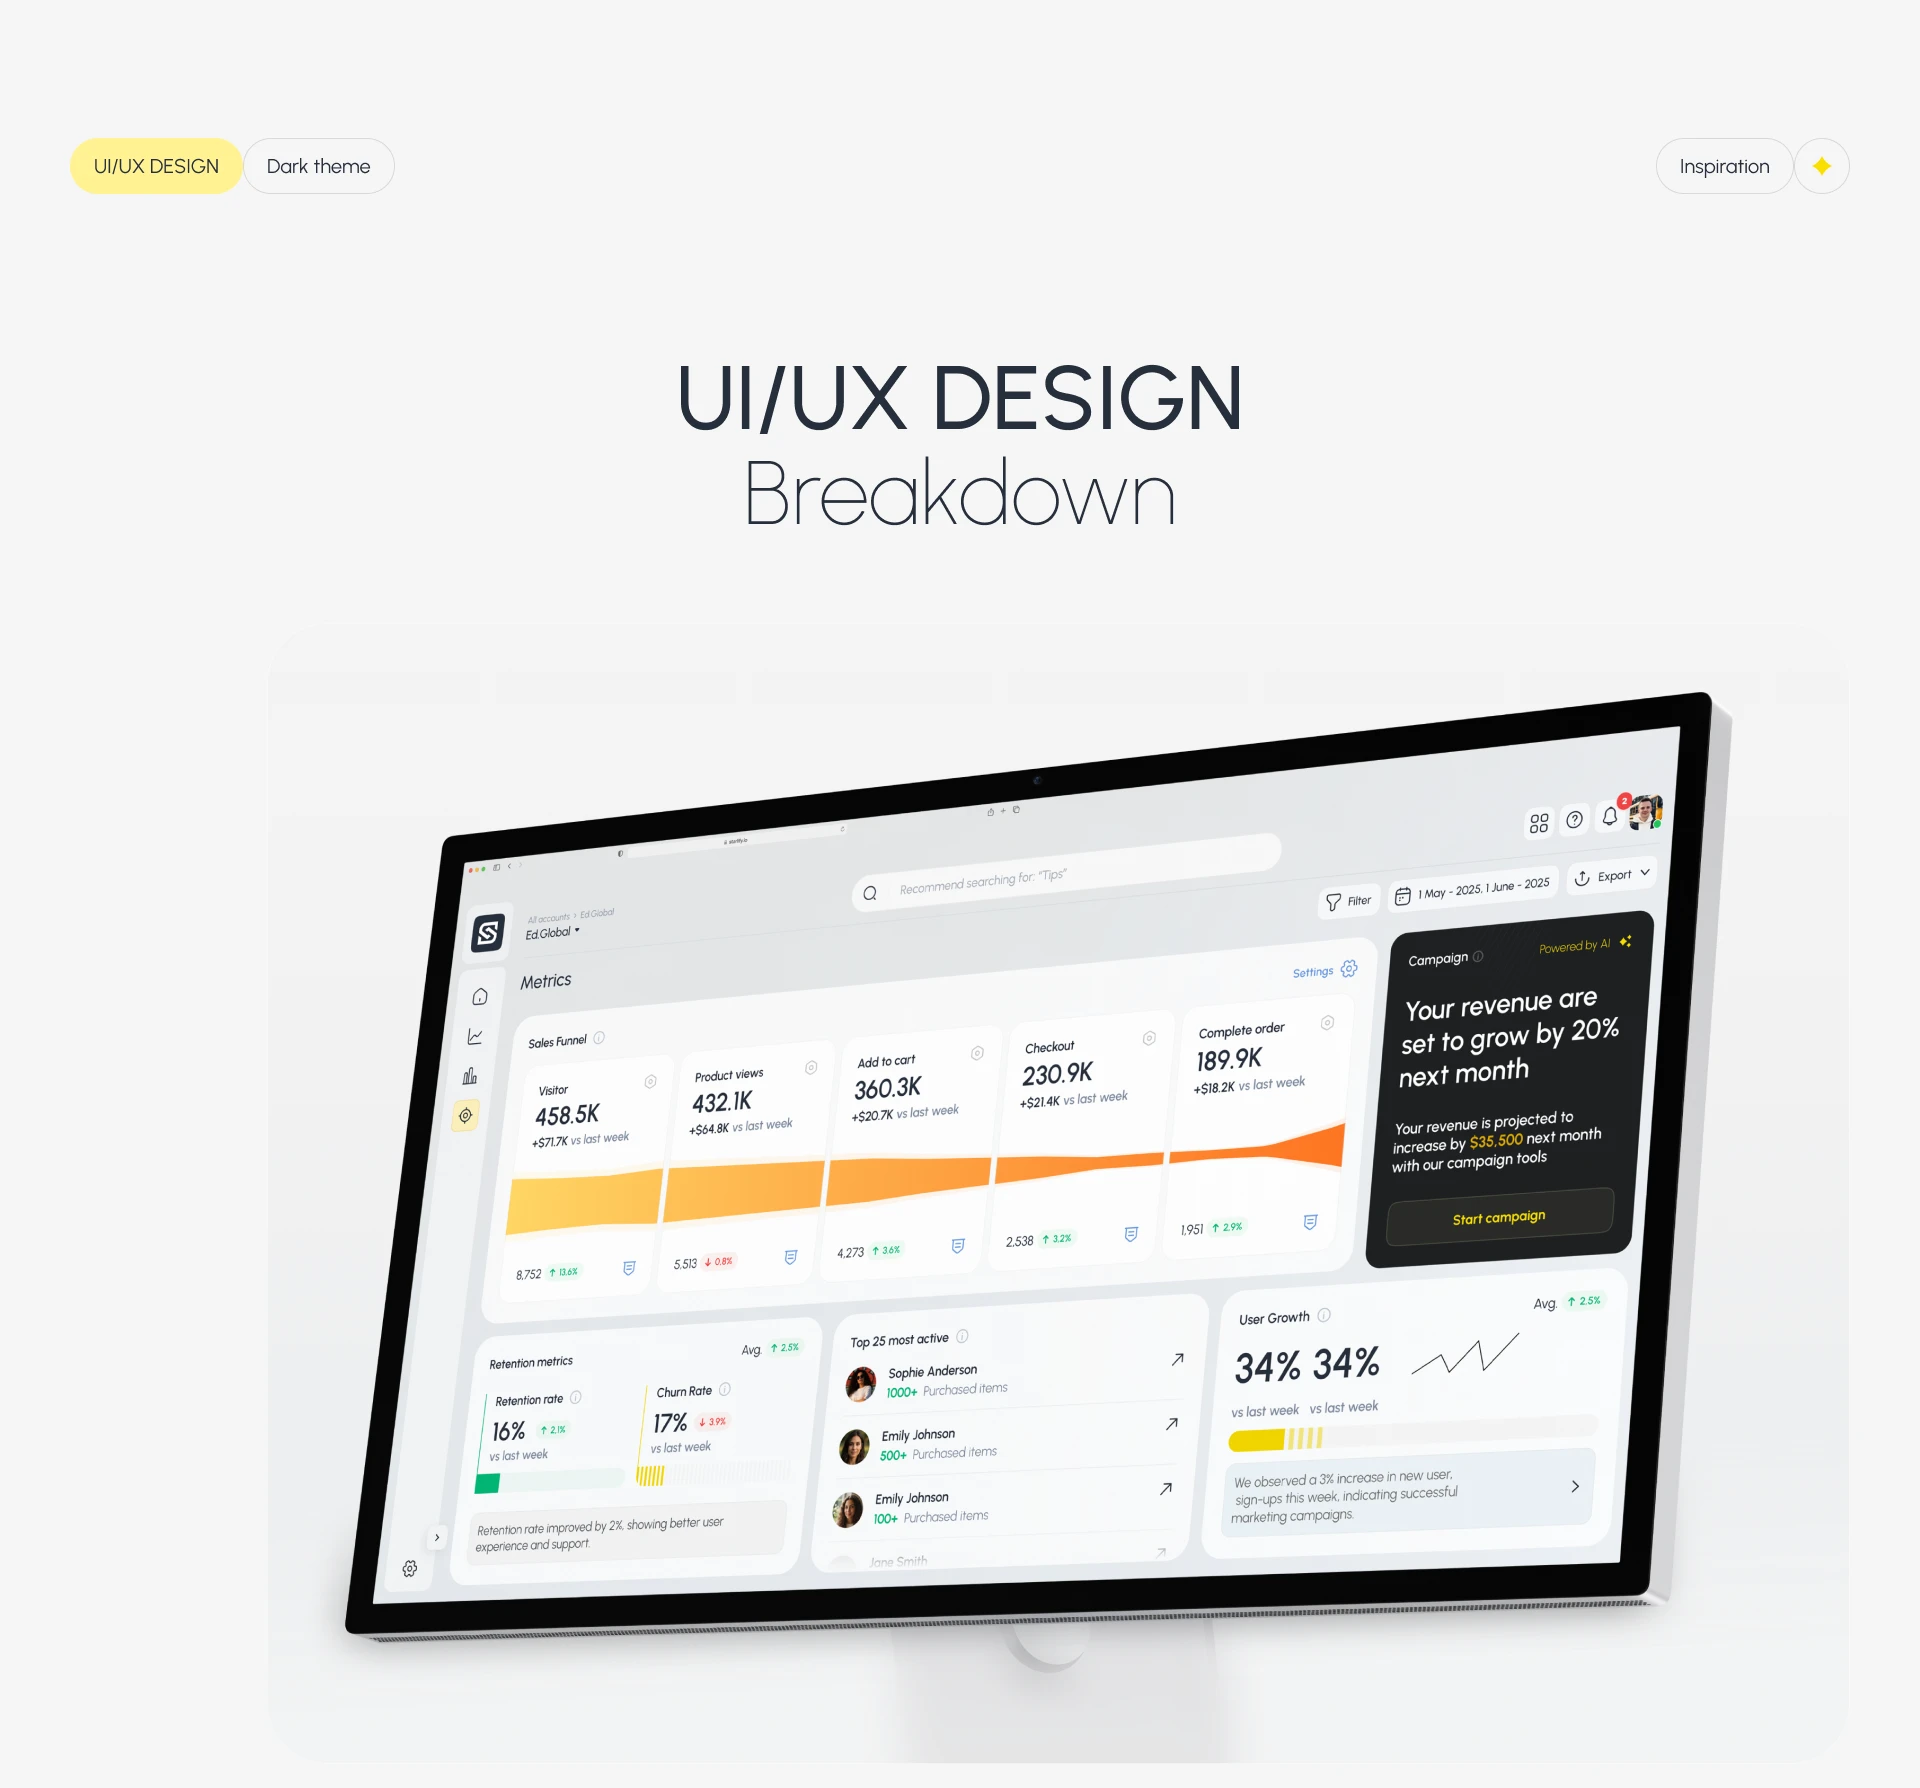
Starlify is a comprehensive analytics platform designed to help businesses track, analyze, and optimize their digital presence in real-time. The dashboard provides actionable insights across multiple metrics including sales funnels, user engagement, retention rates, and geographic distribution of active users.

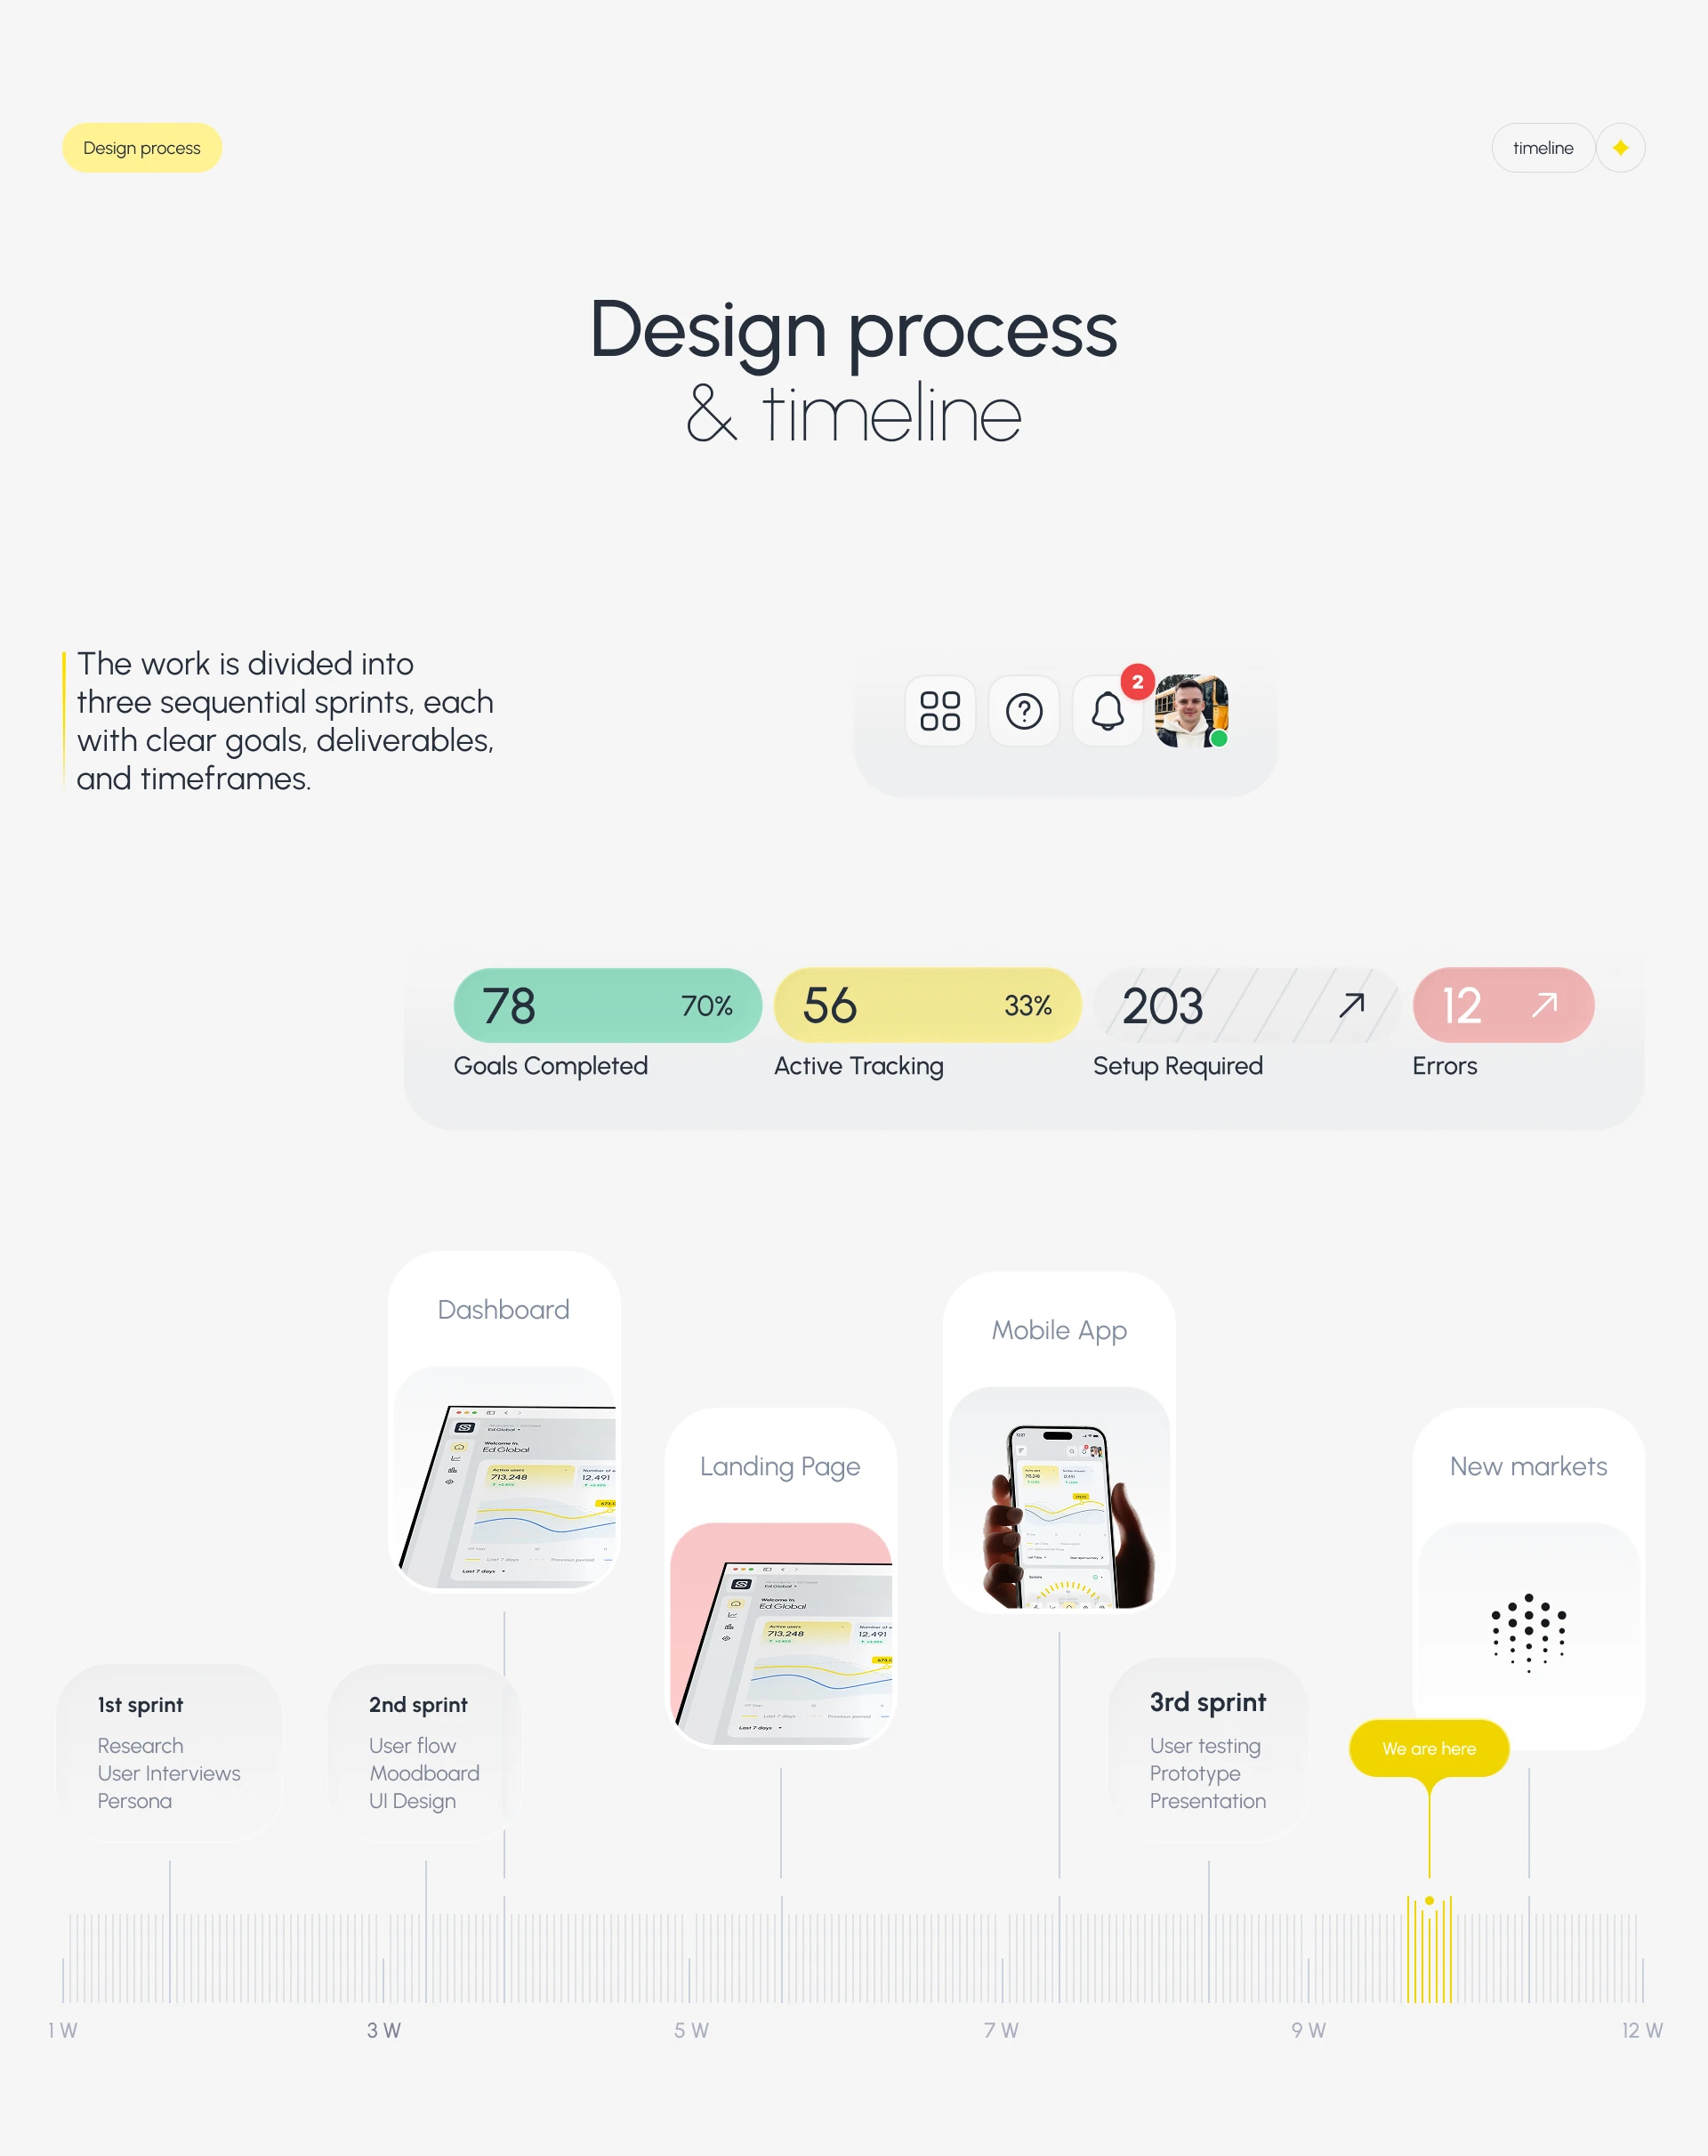
The work is divided into three sequential sprints, each with clear goals, deliverables, and timeframes.
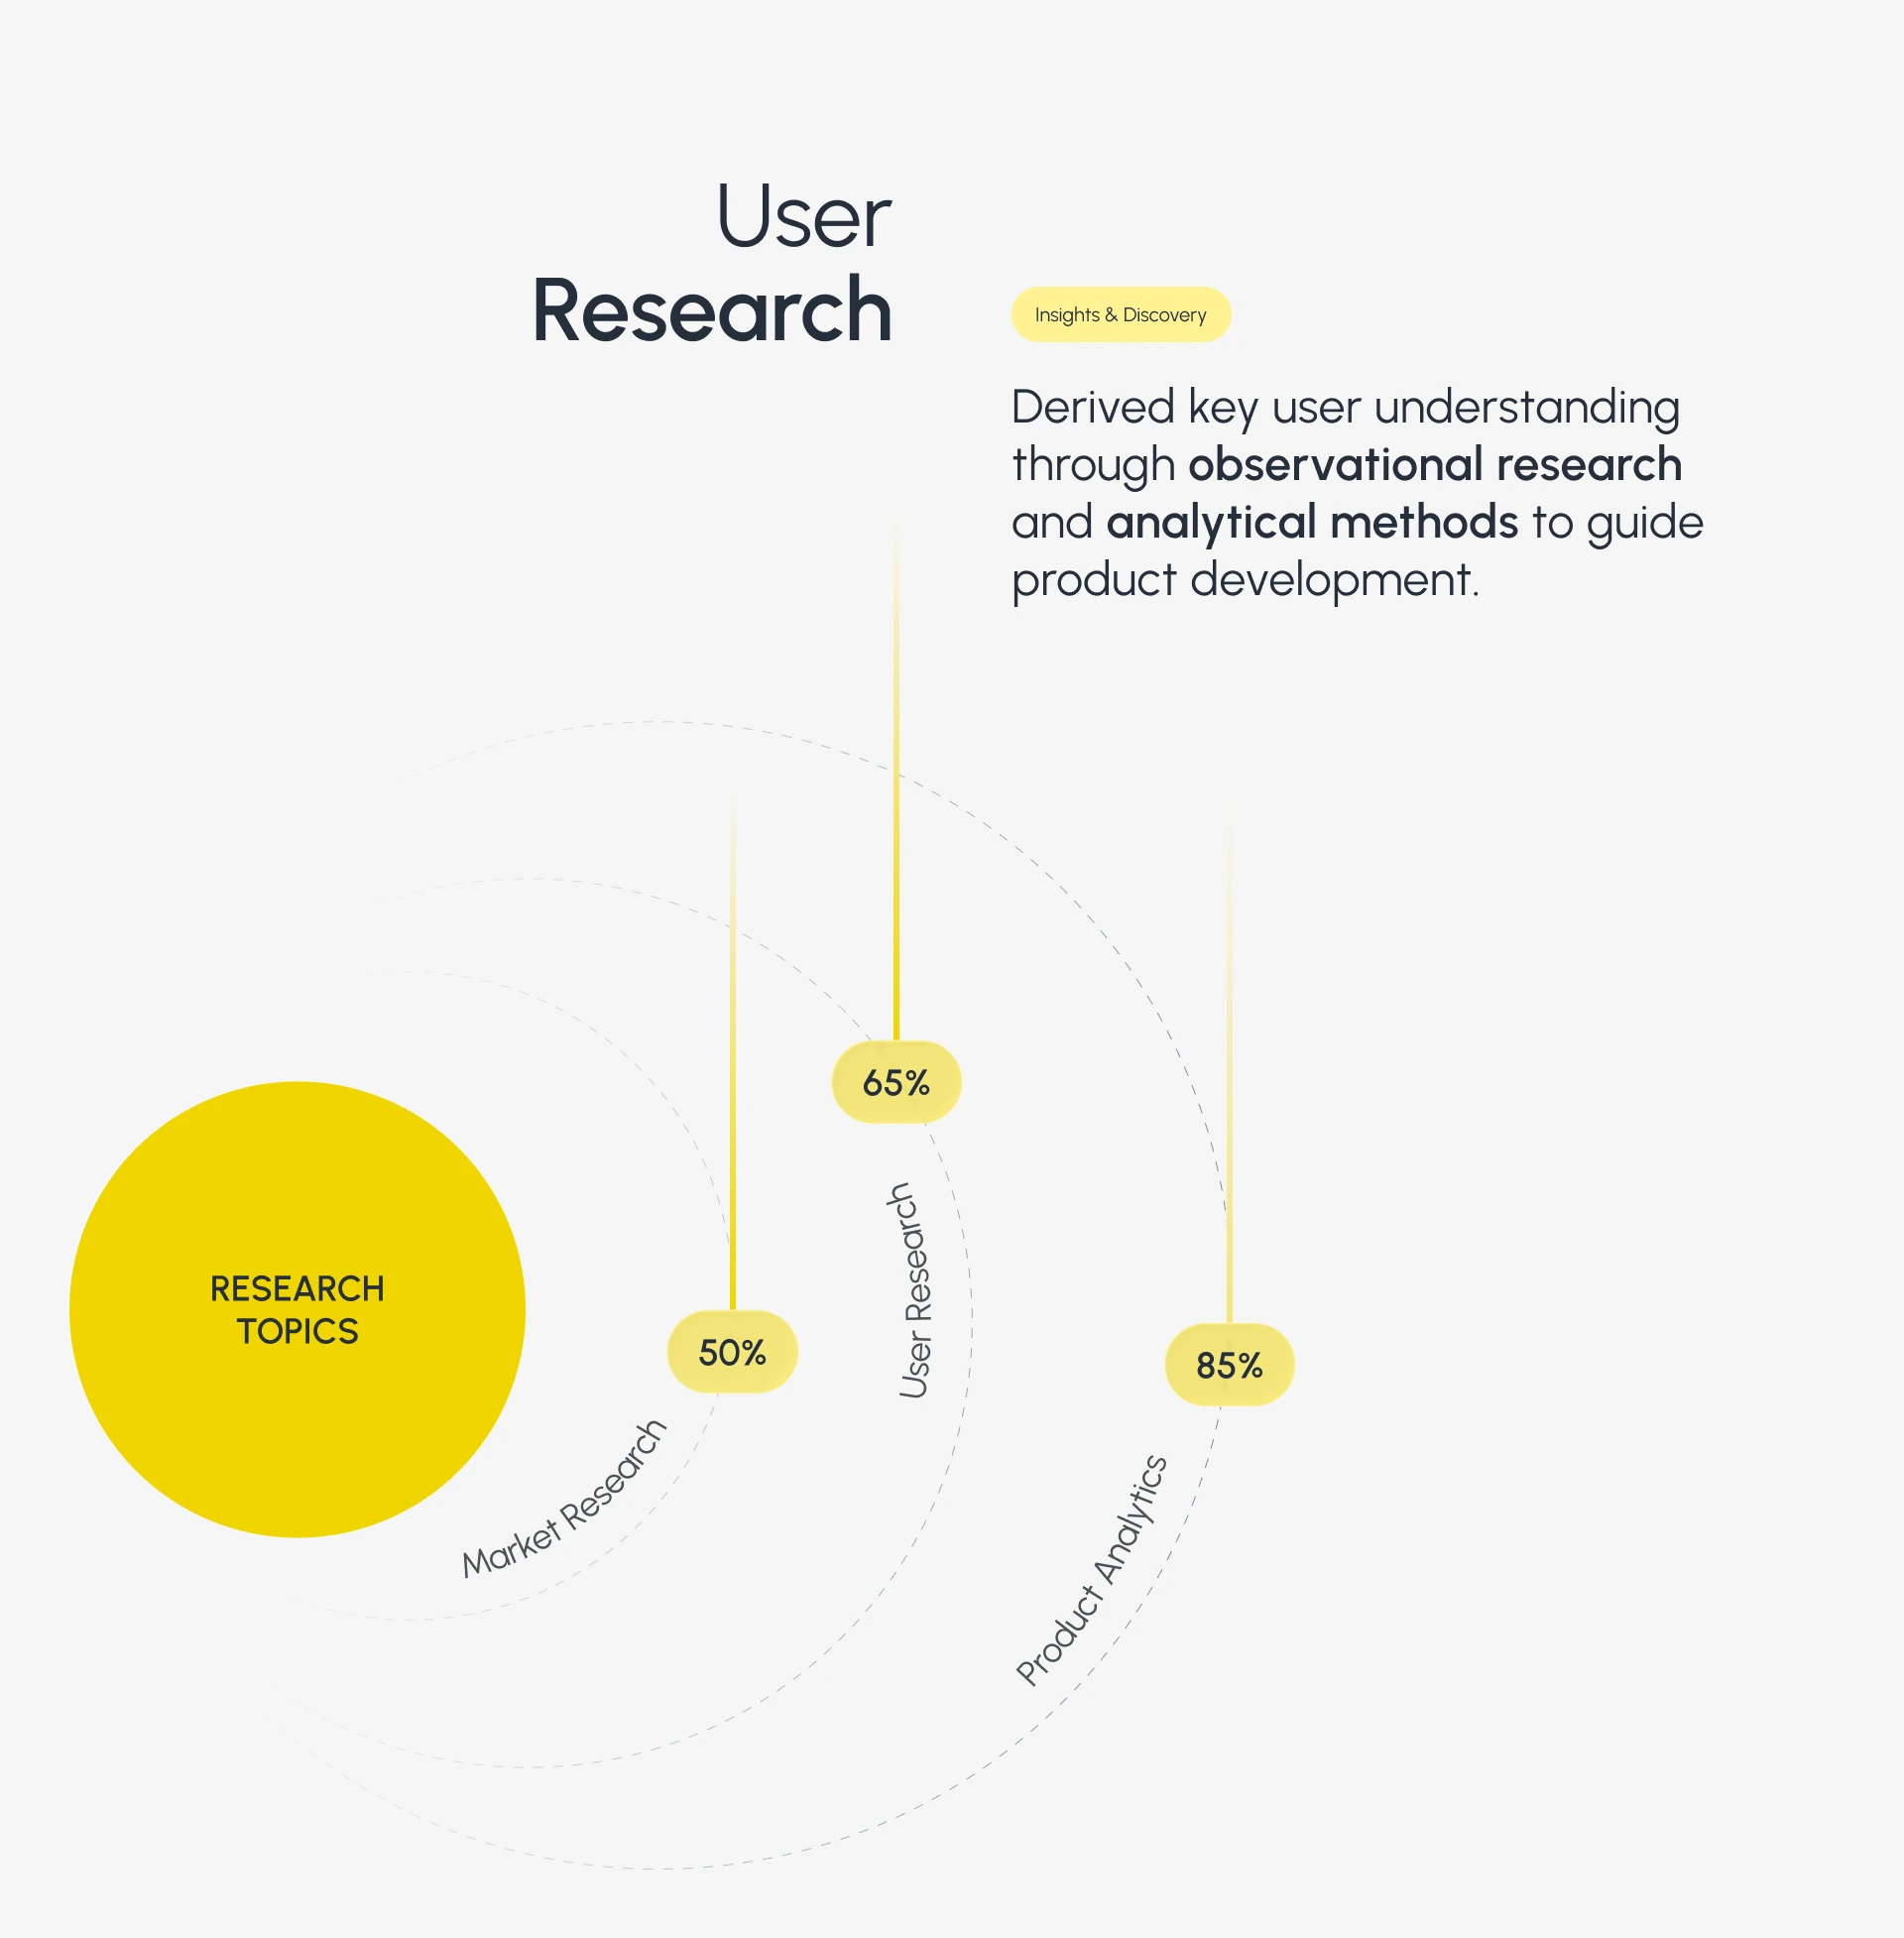
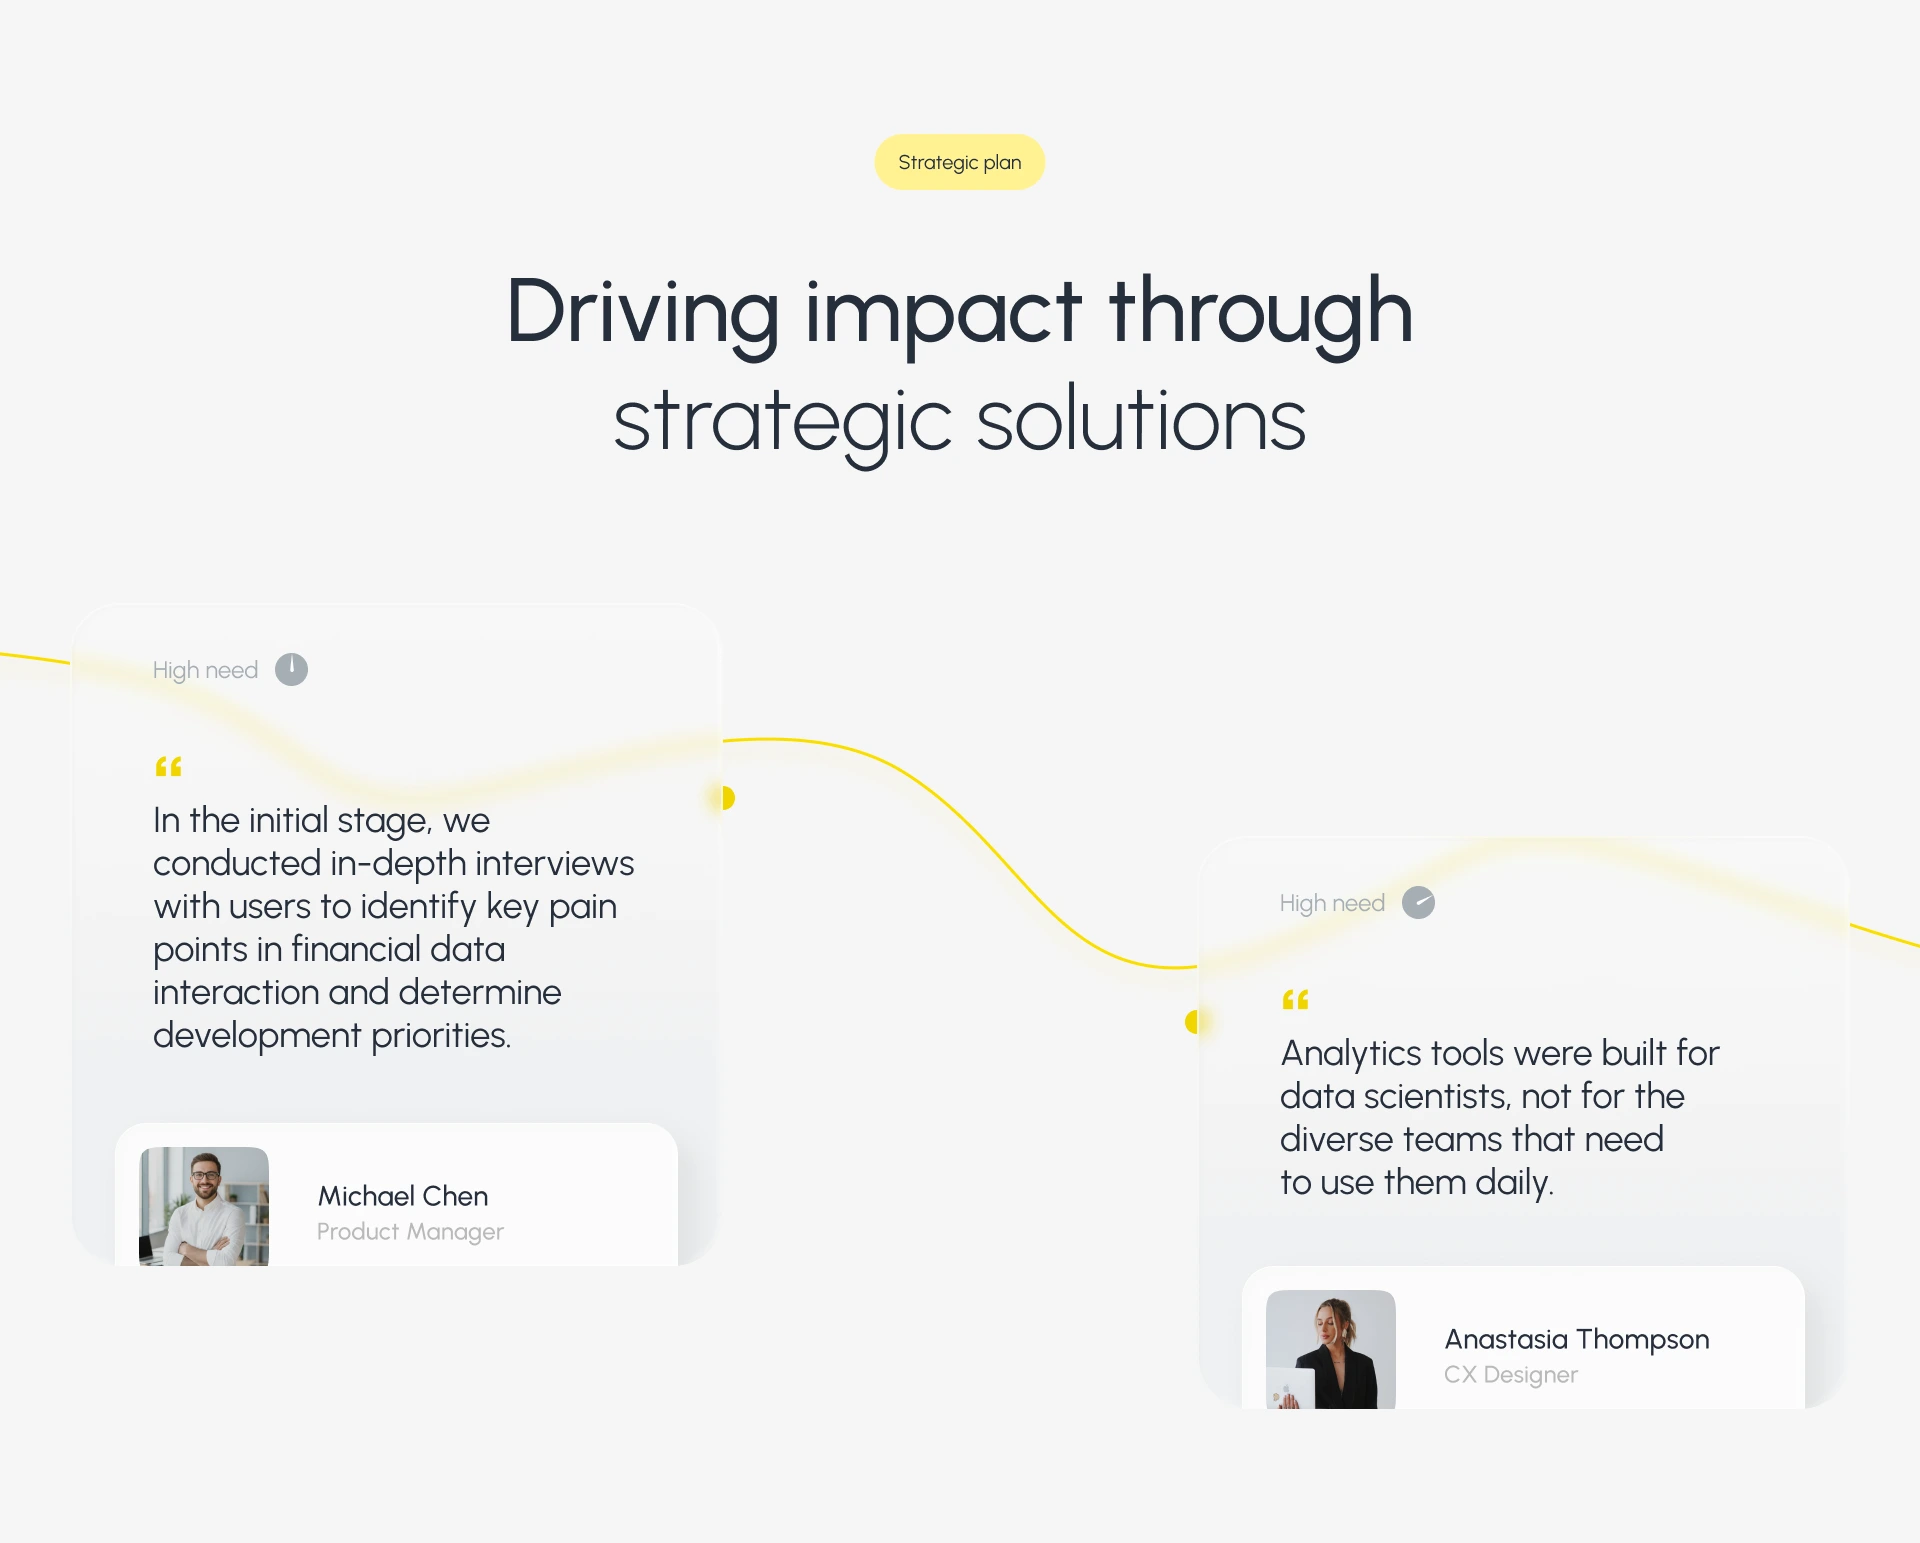
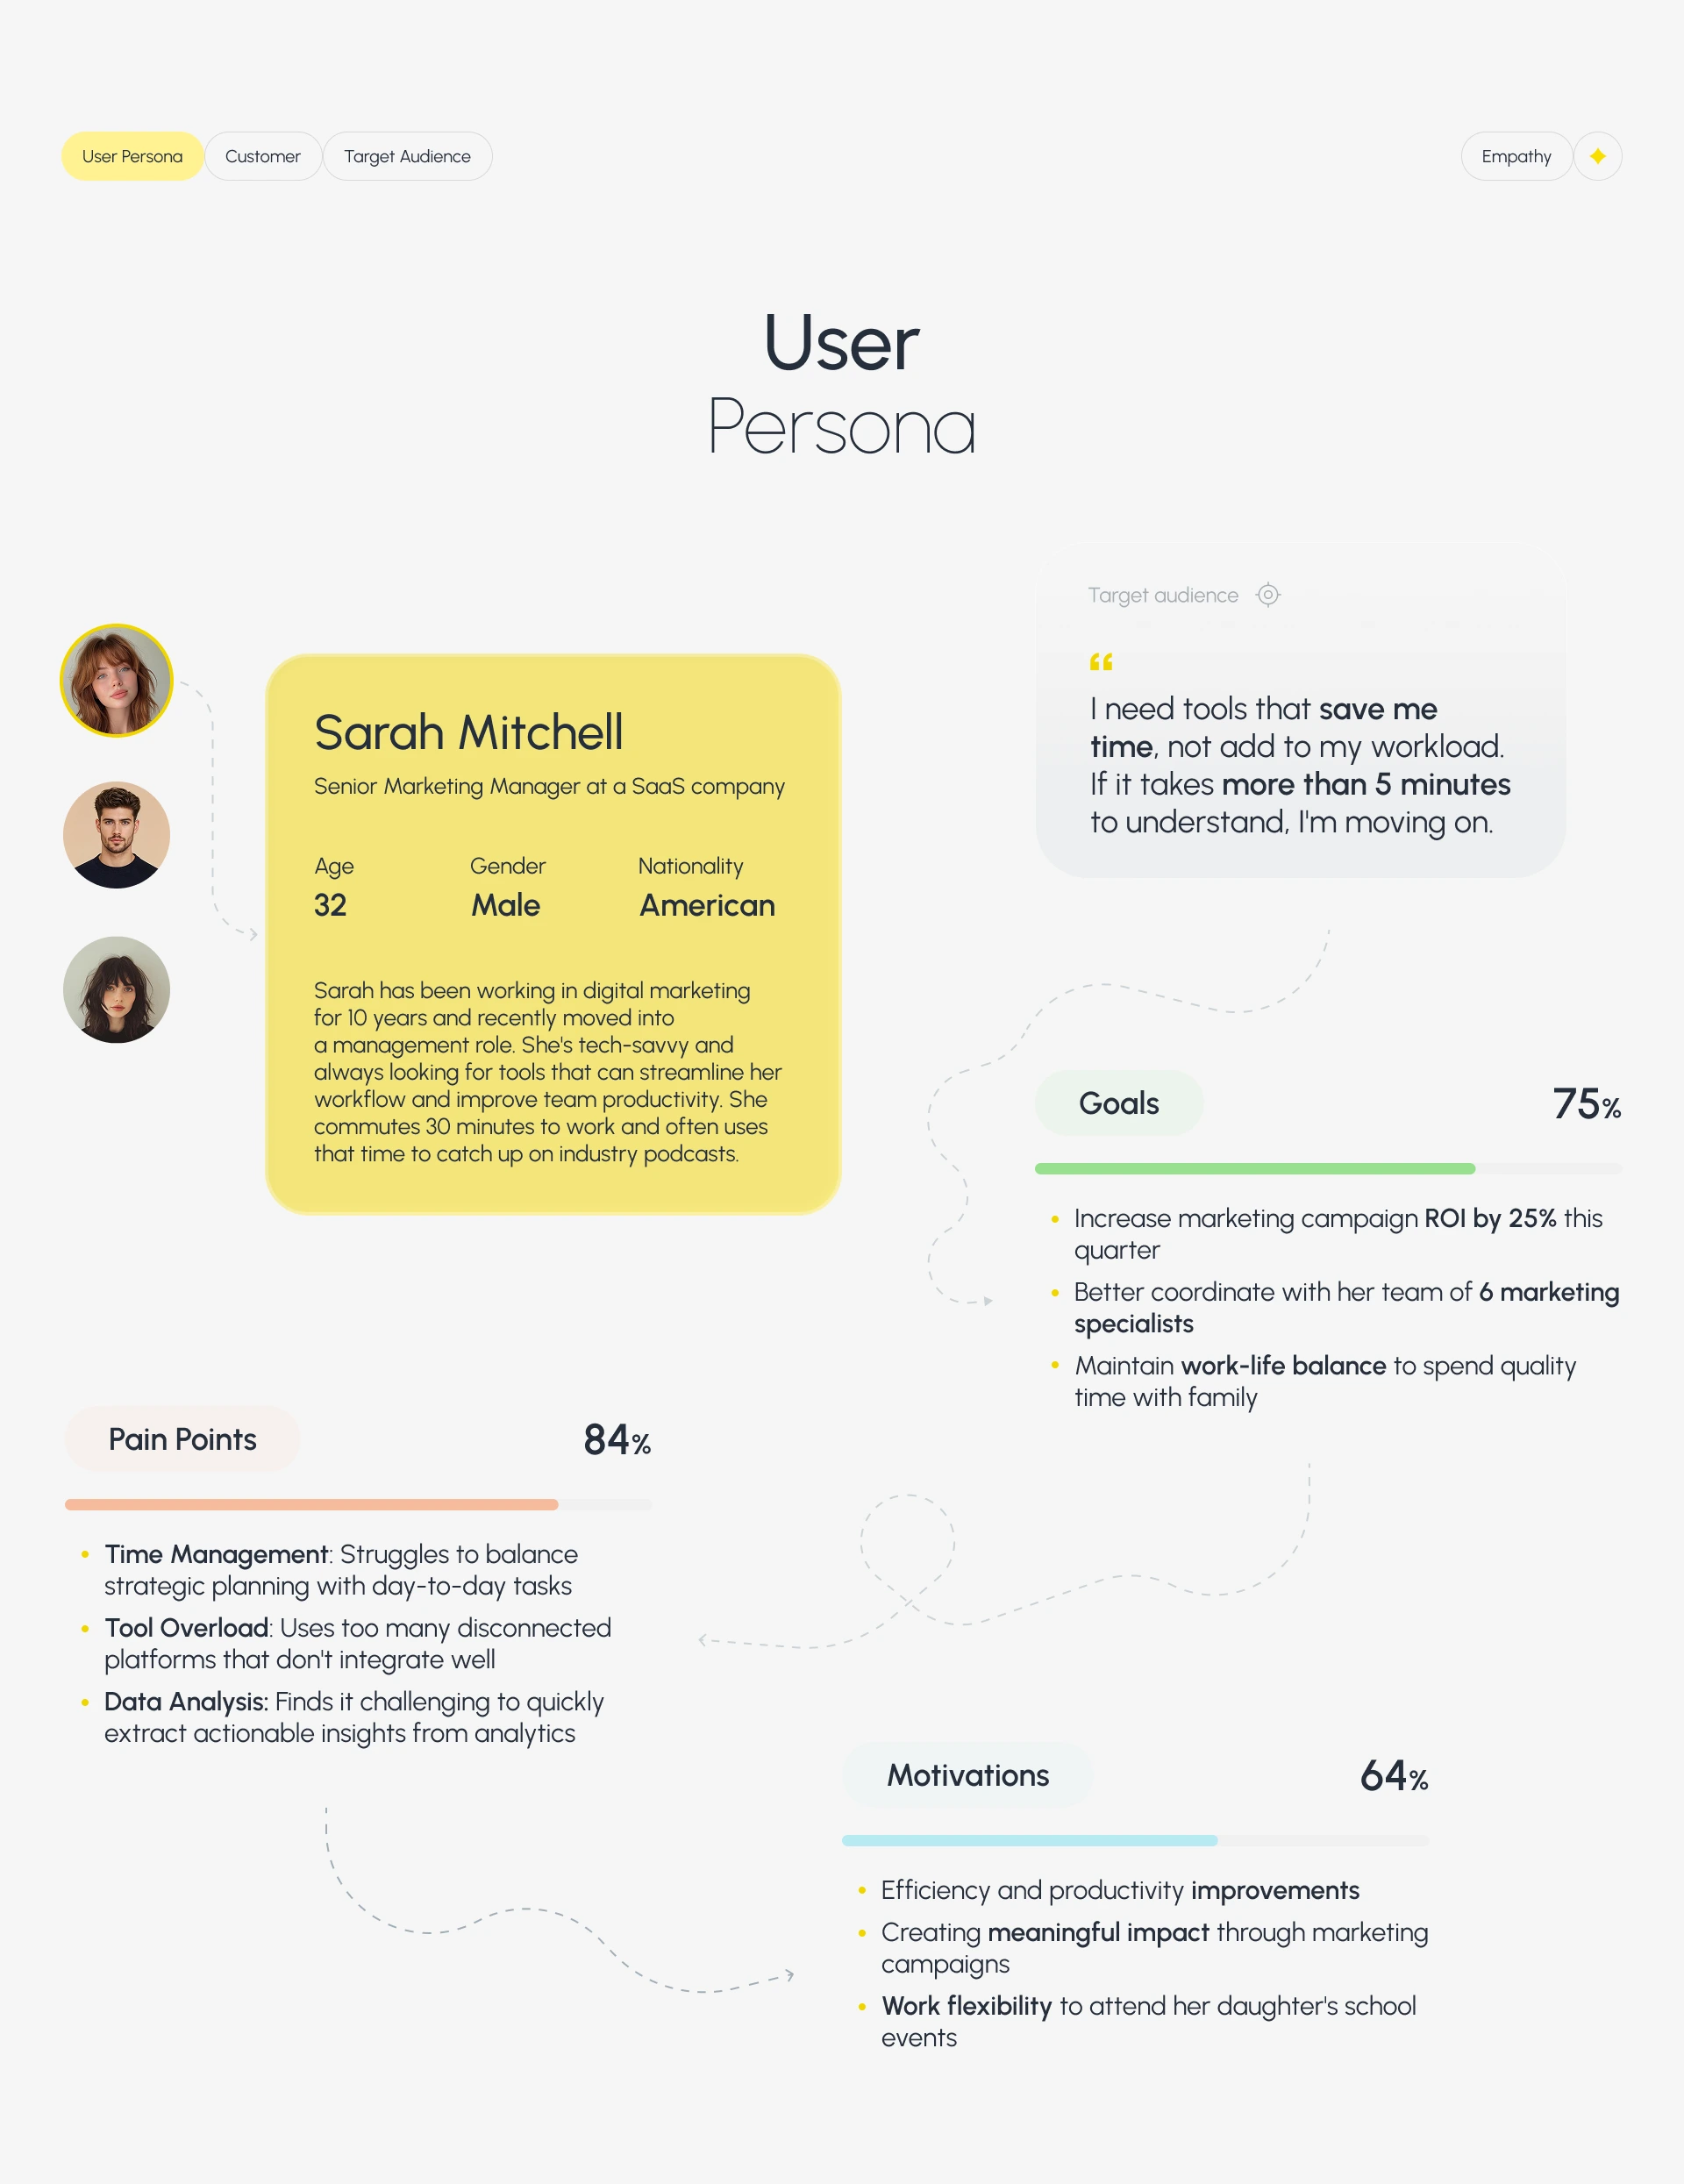
Derived key user understanding through observational research and analytical methods to guide product development.

We spoke with 37 users to uncover what slows them down — from cluttered dashboards to complex data visualization tools.
Every screen is designed
to support faster decisions, clear insights, and fewer distractions.
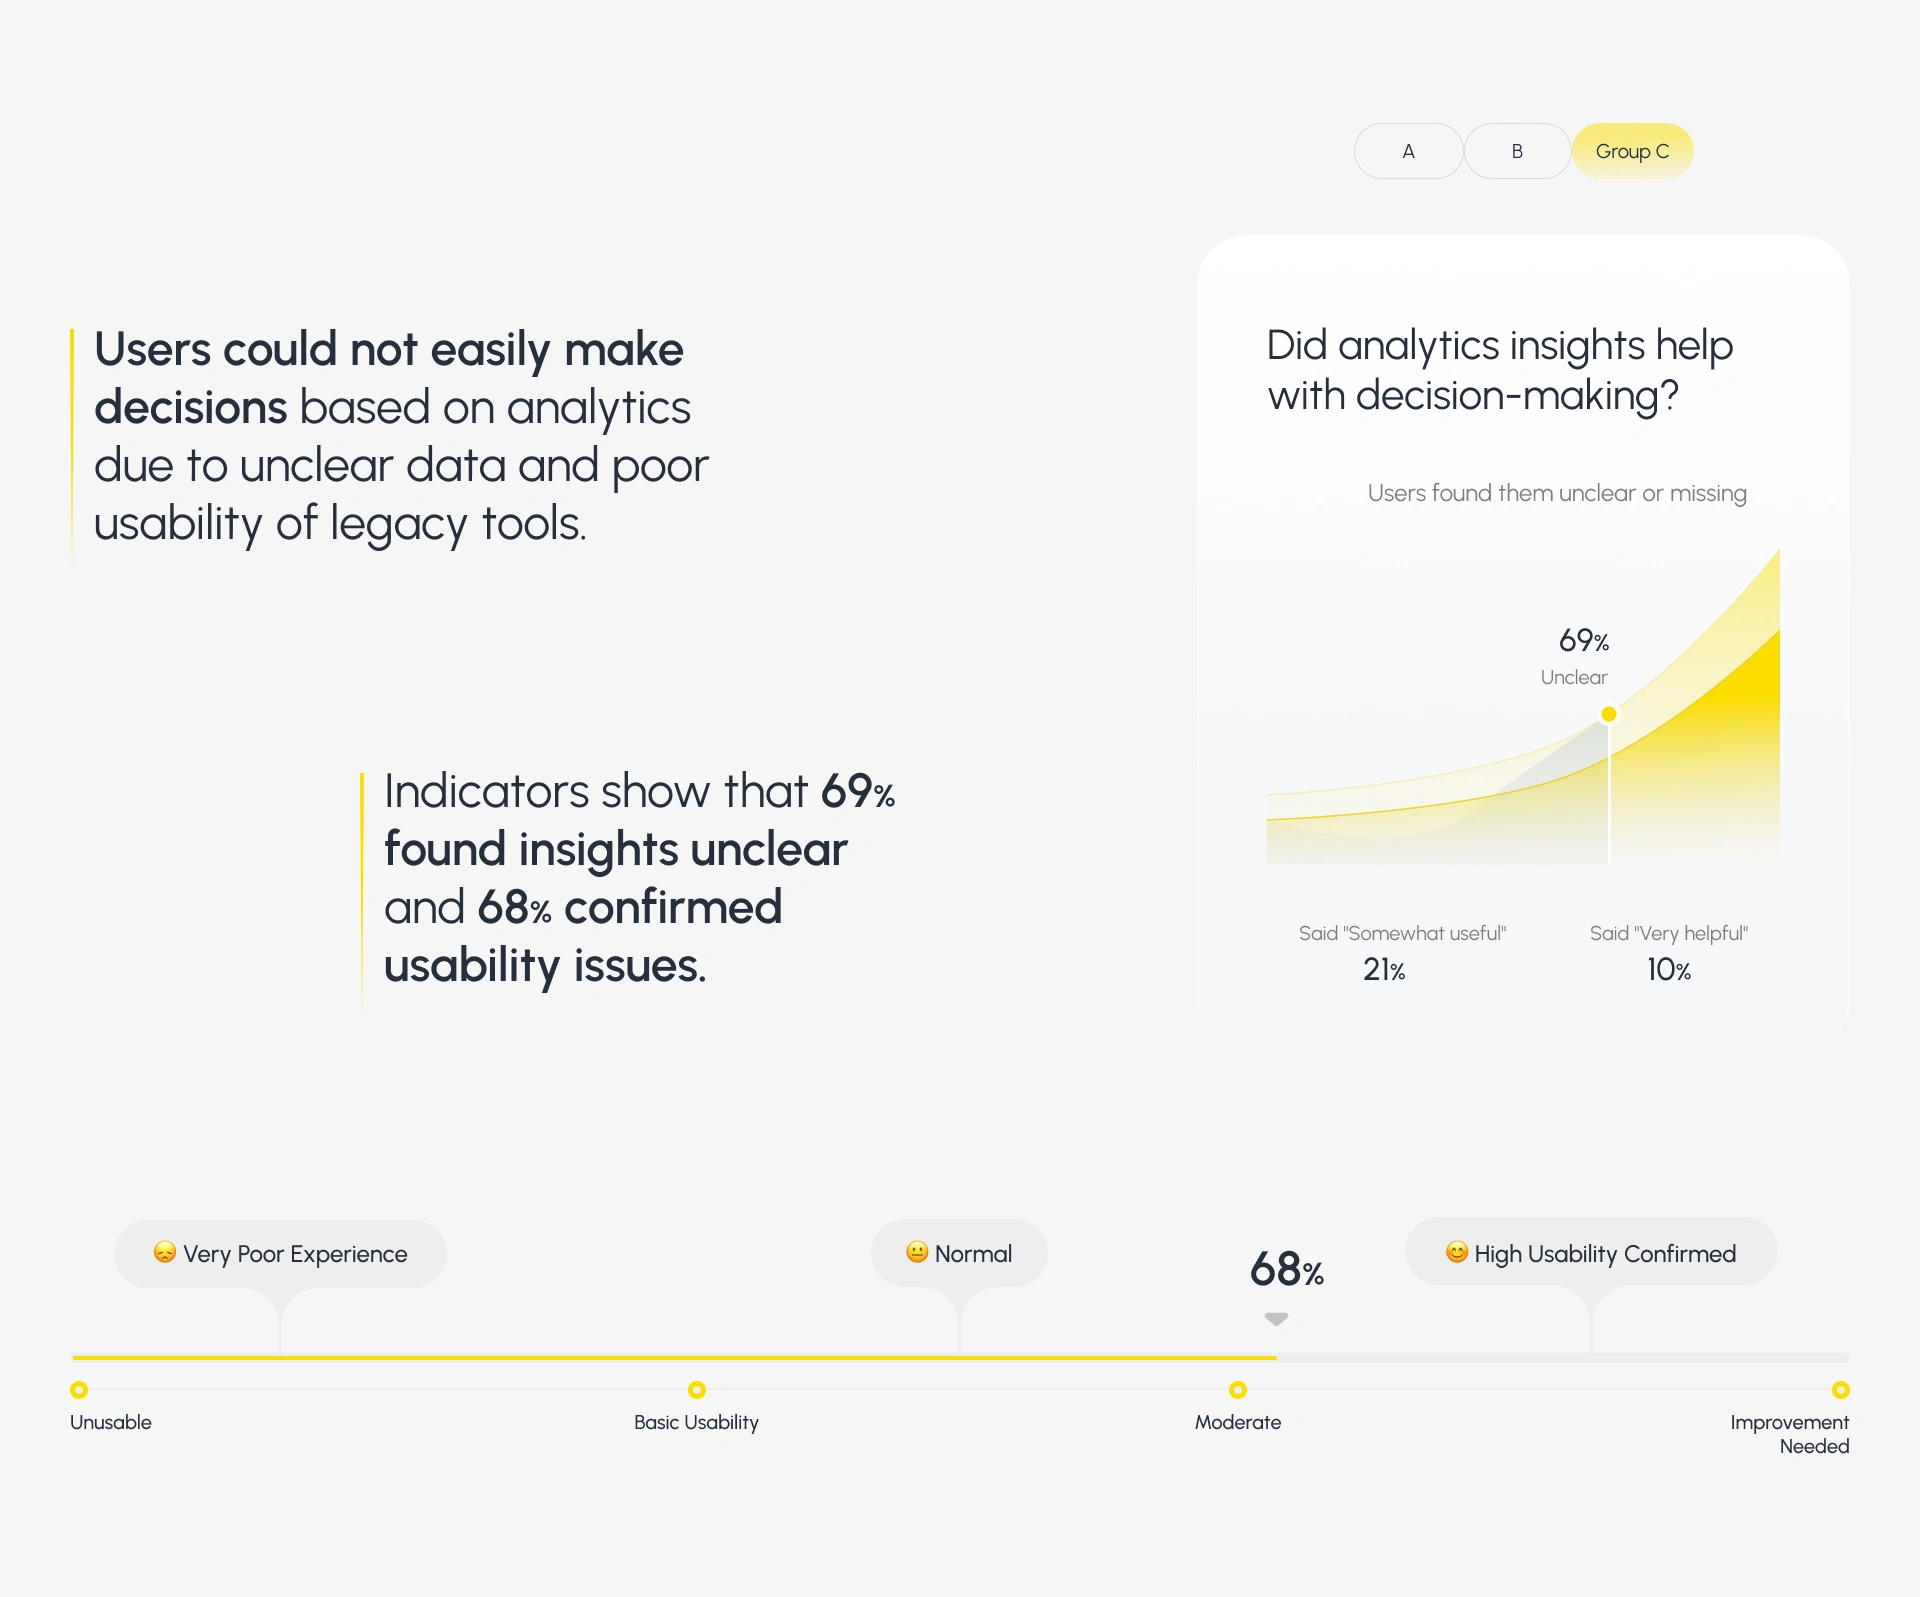
Users could not easily make decisions based on analytics due to unclear data and poor usability of legacy tools.
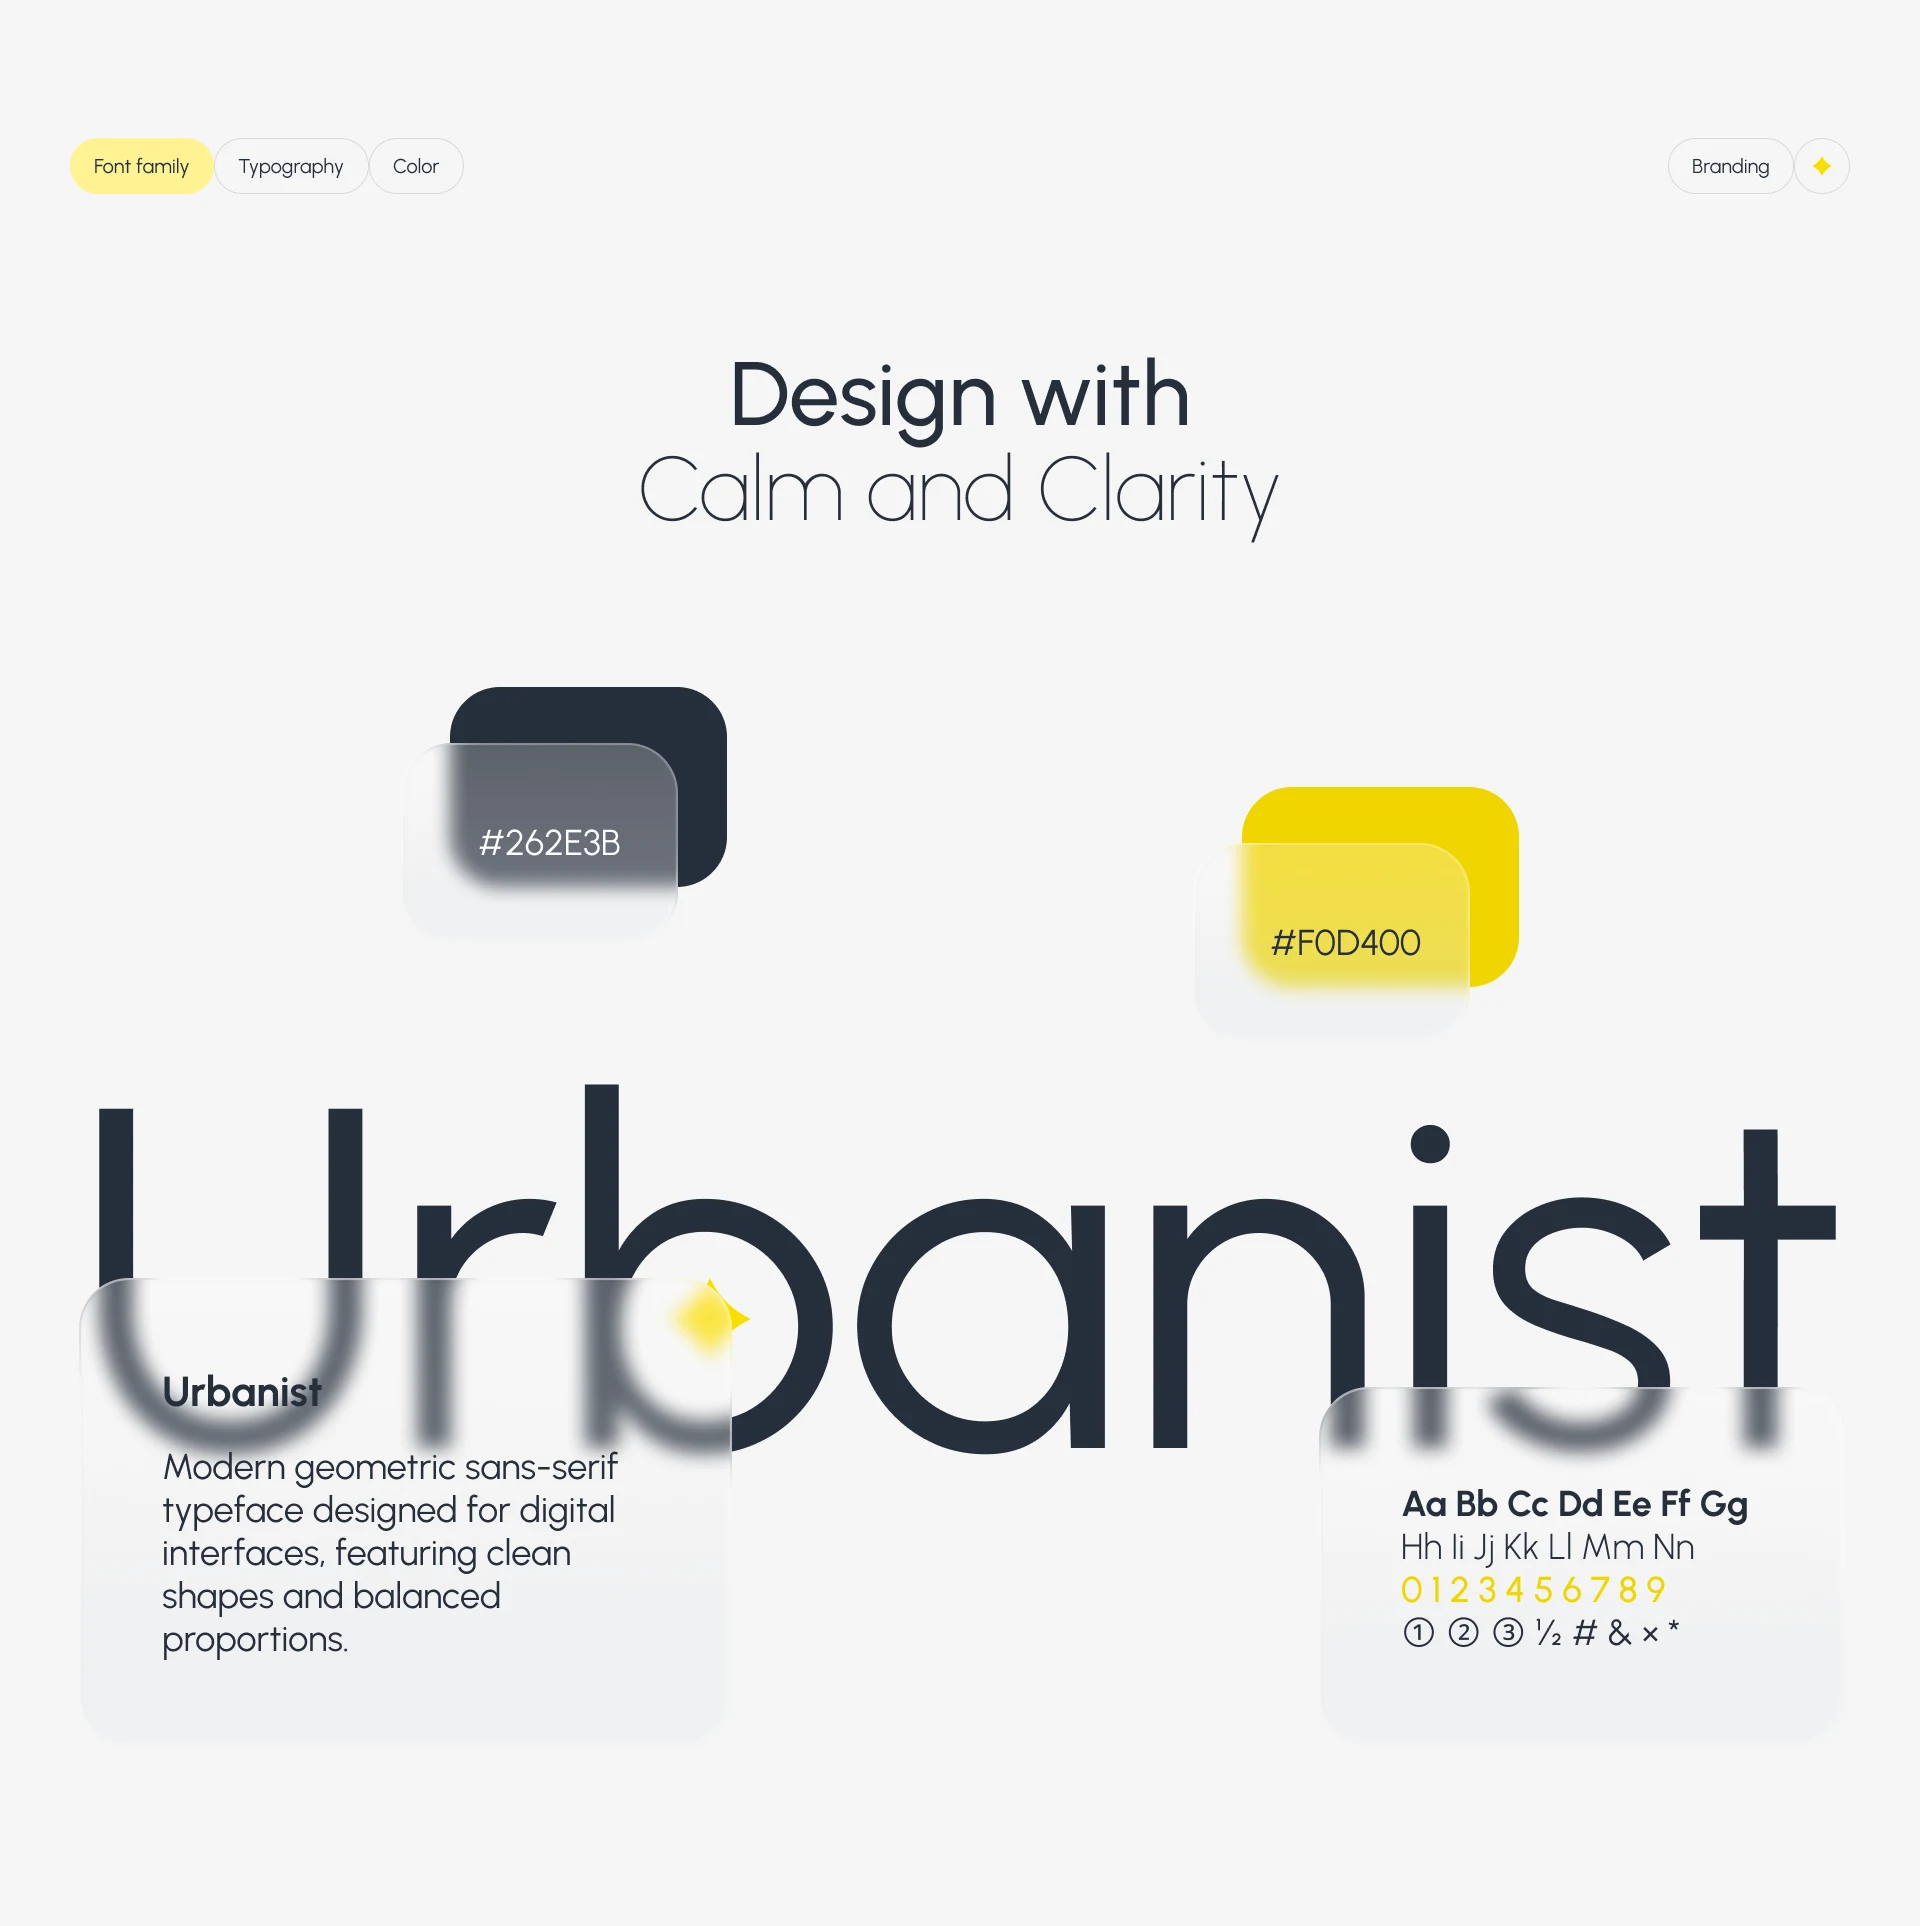
This logo showcases a sleek, geometric design with a bold
and minimal aesthetic, emphasizing precision, clarity, and visual balance across all scales.
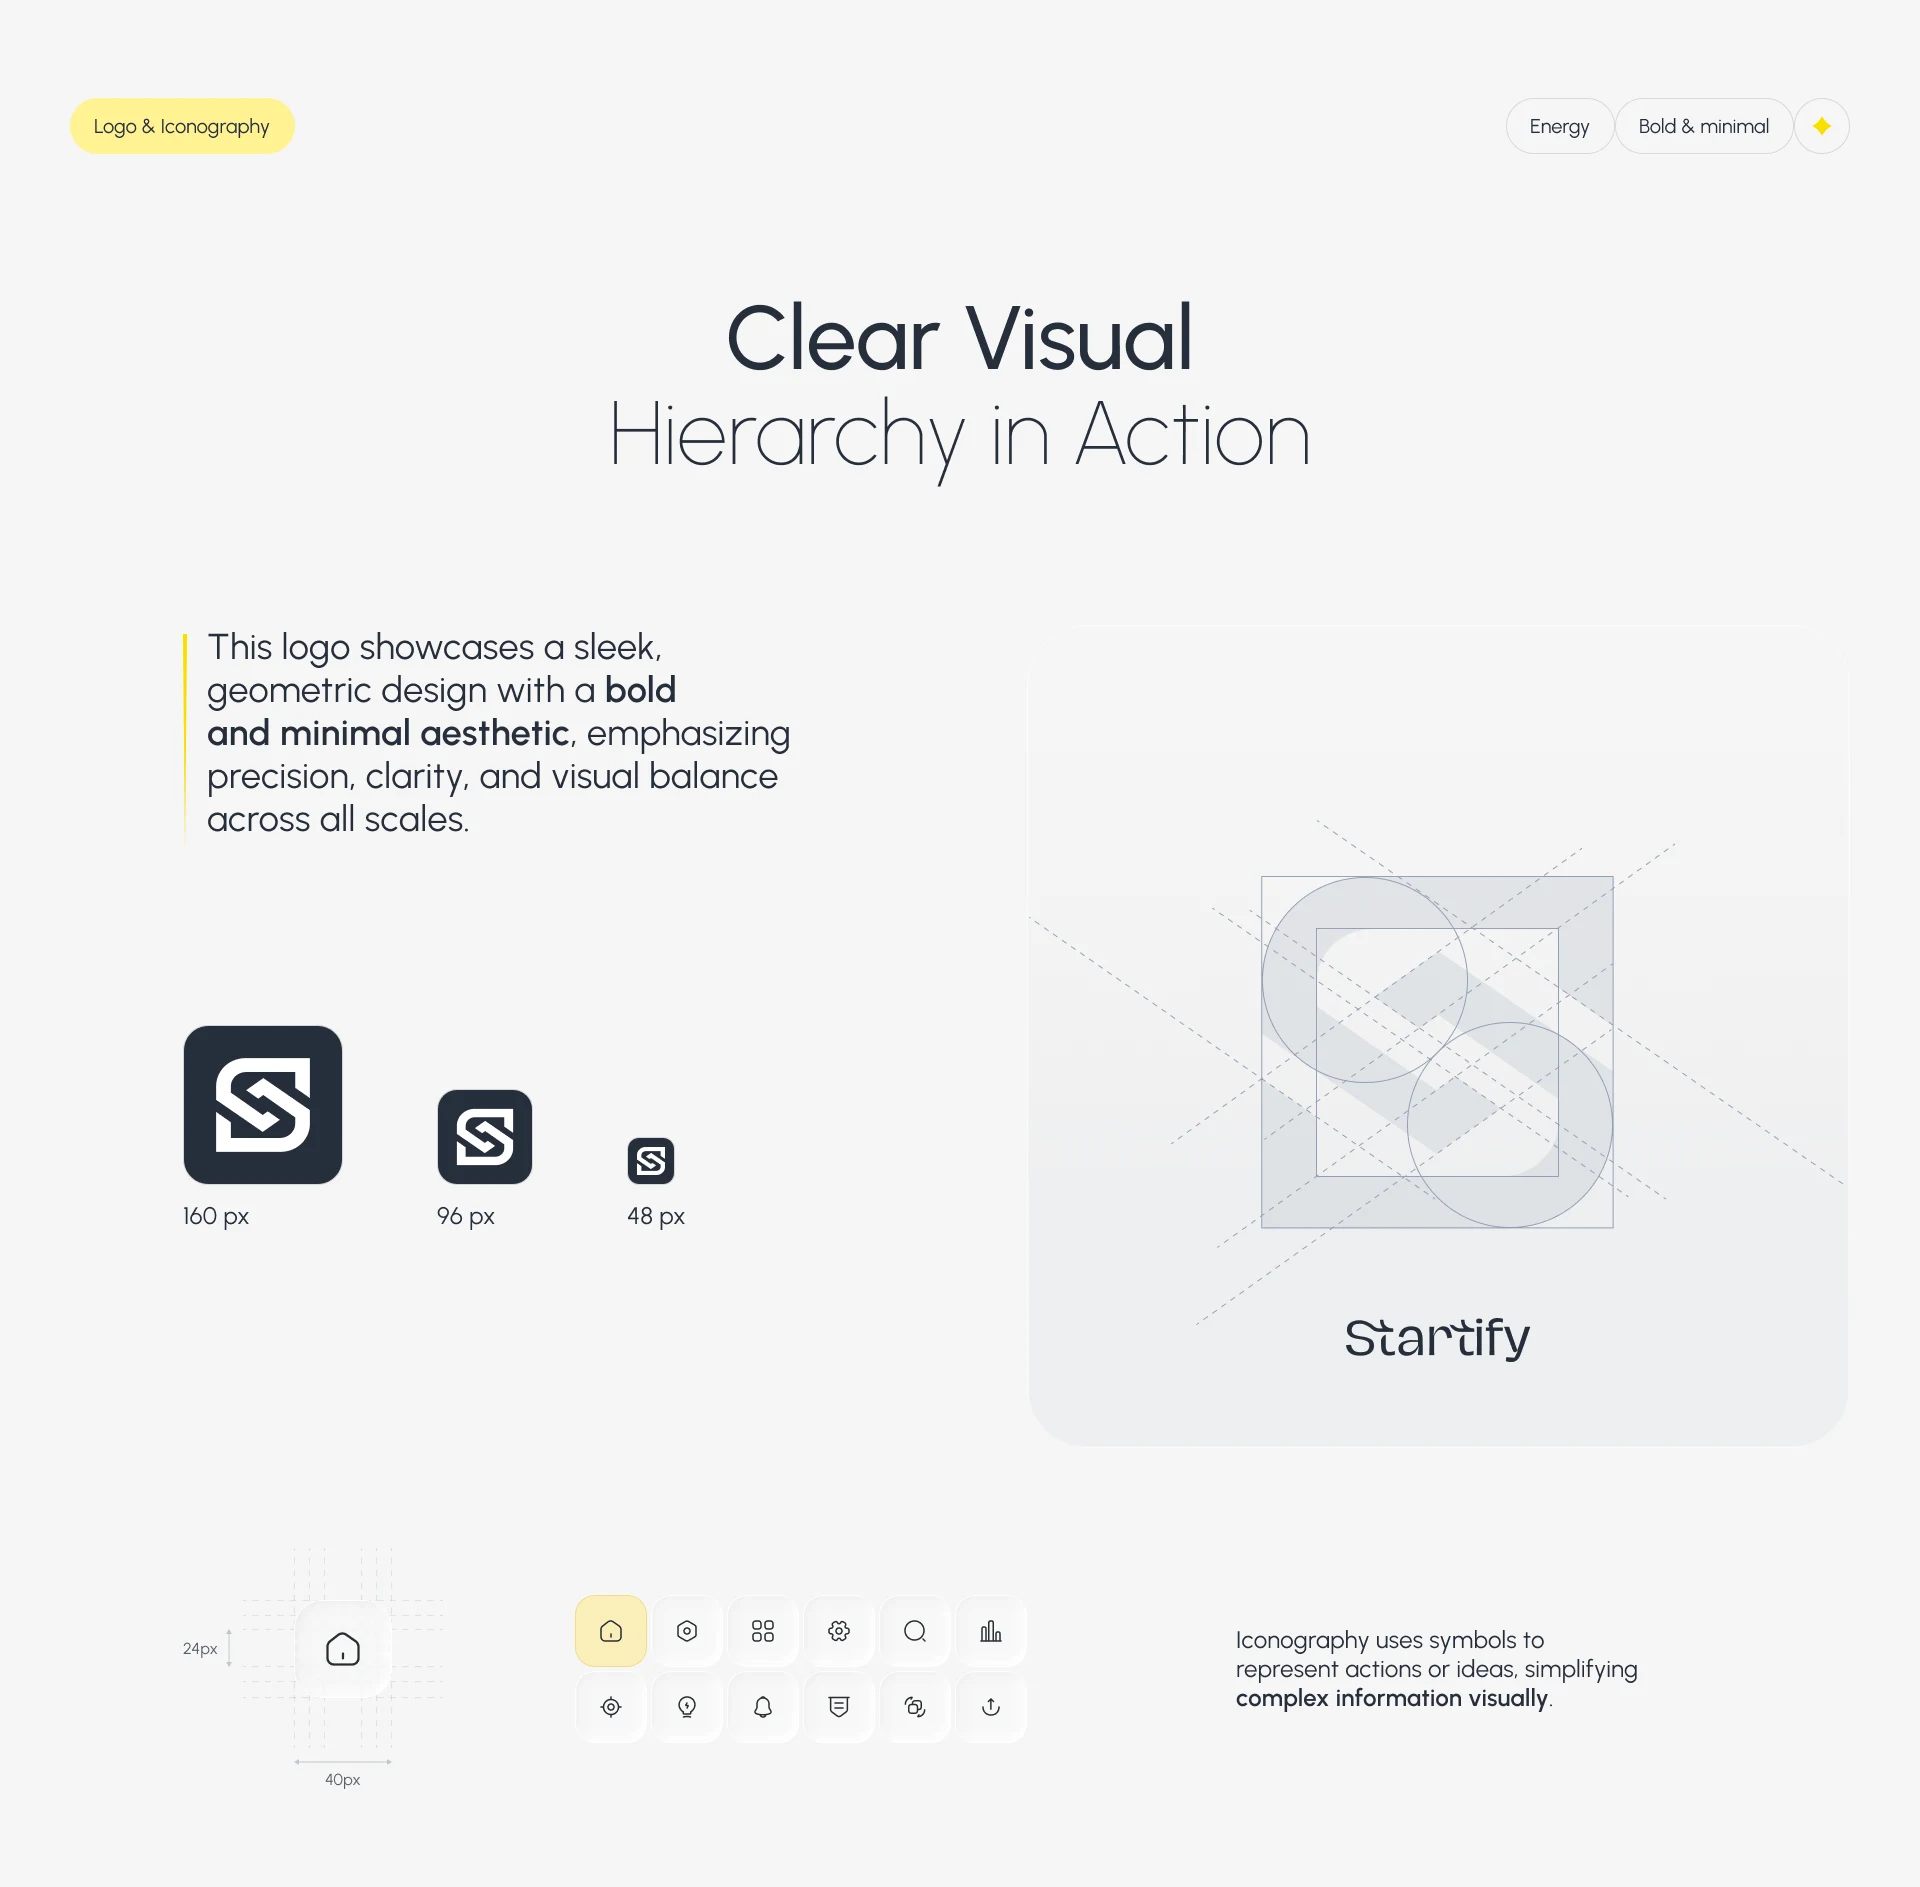
Iconography uses symbols to represent actions or ideas, simplifying complex information visually.
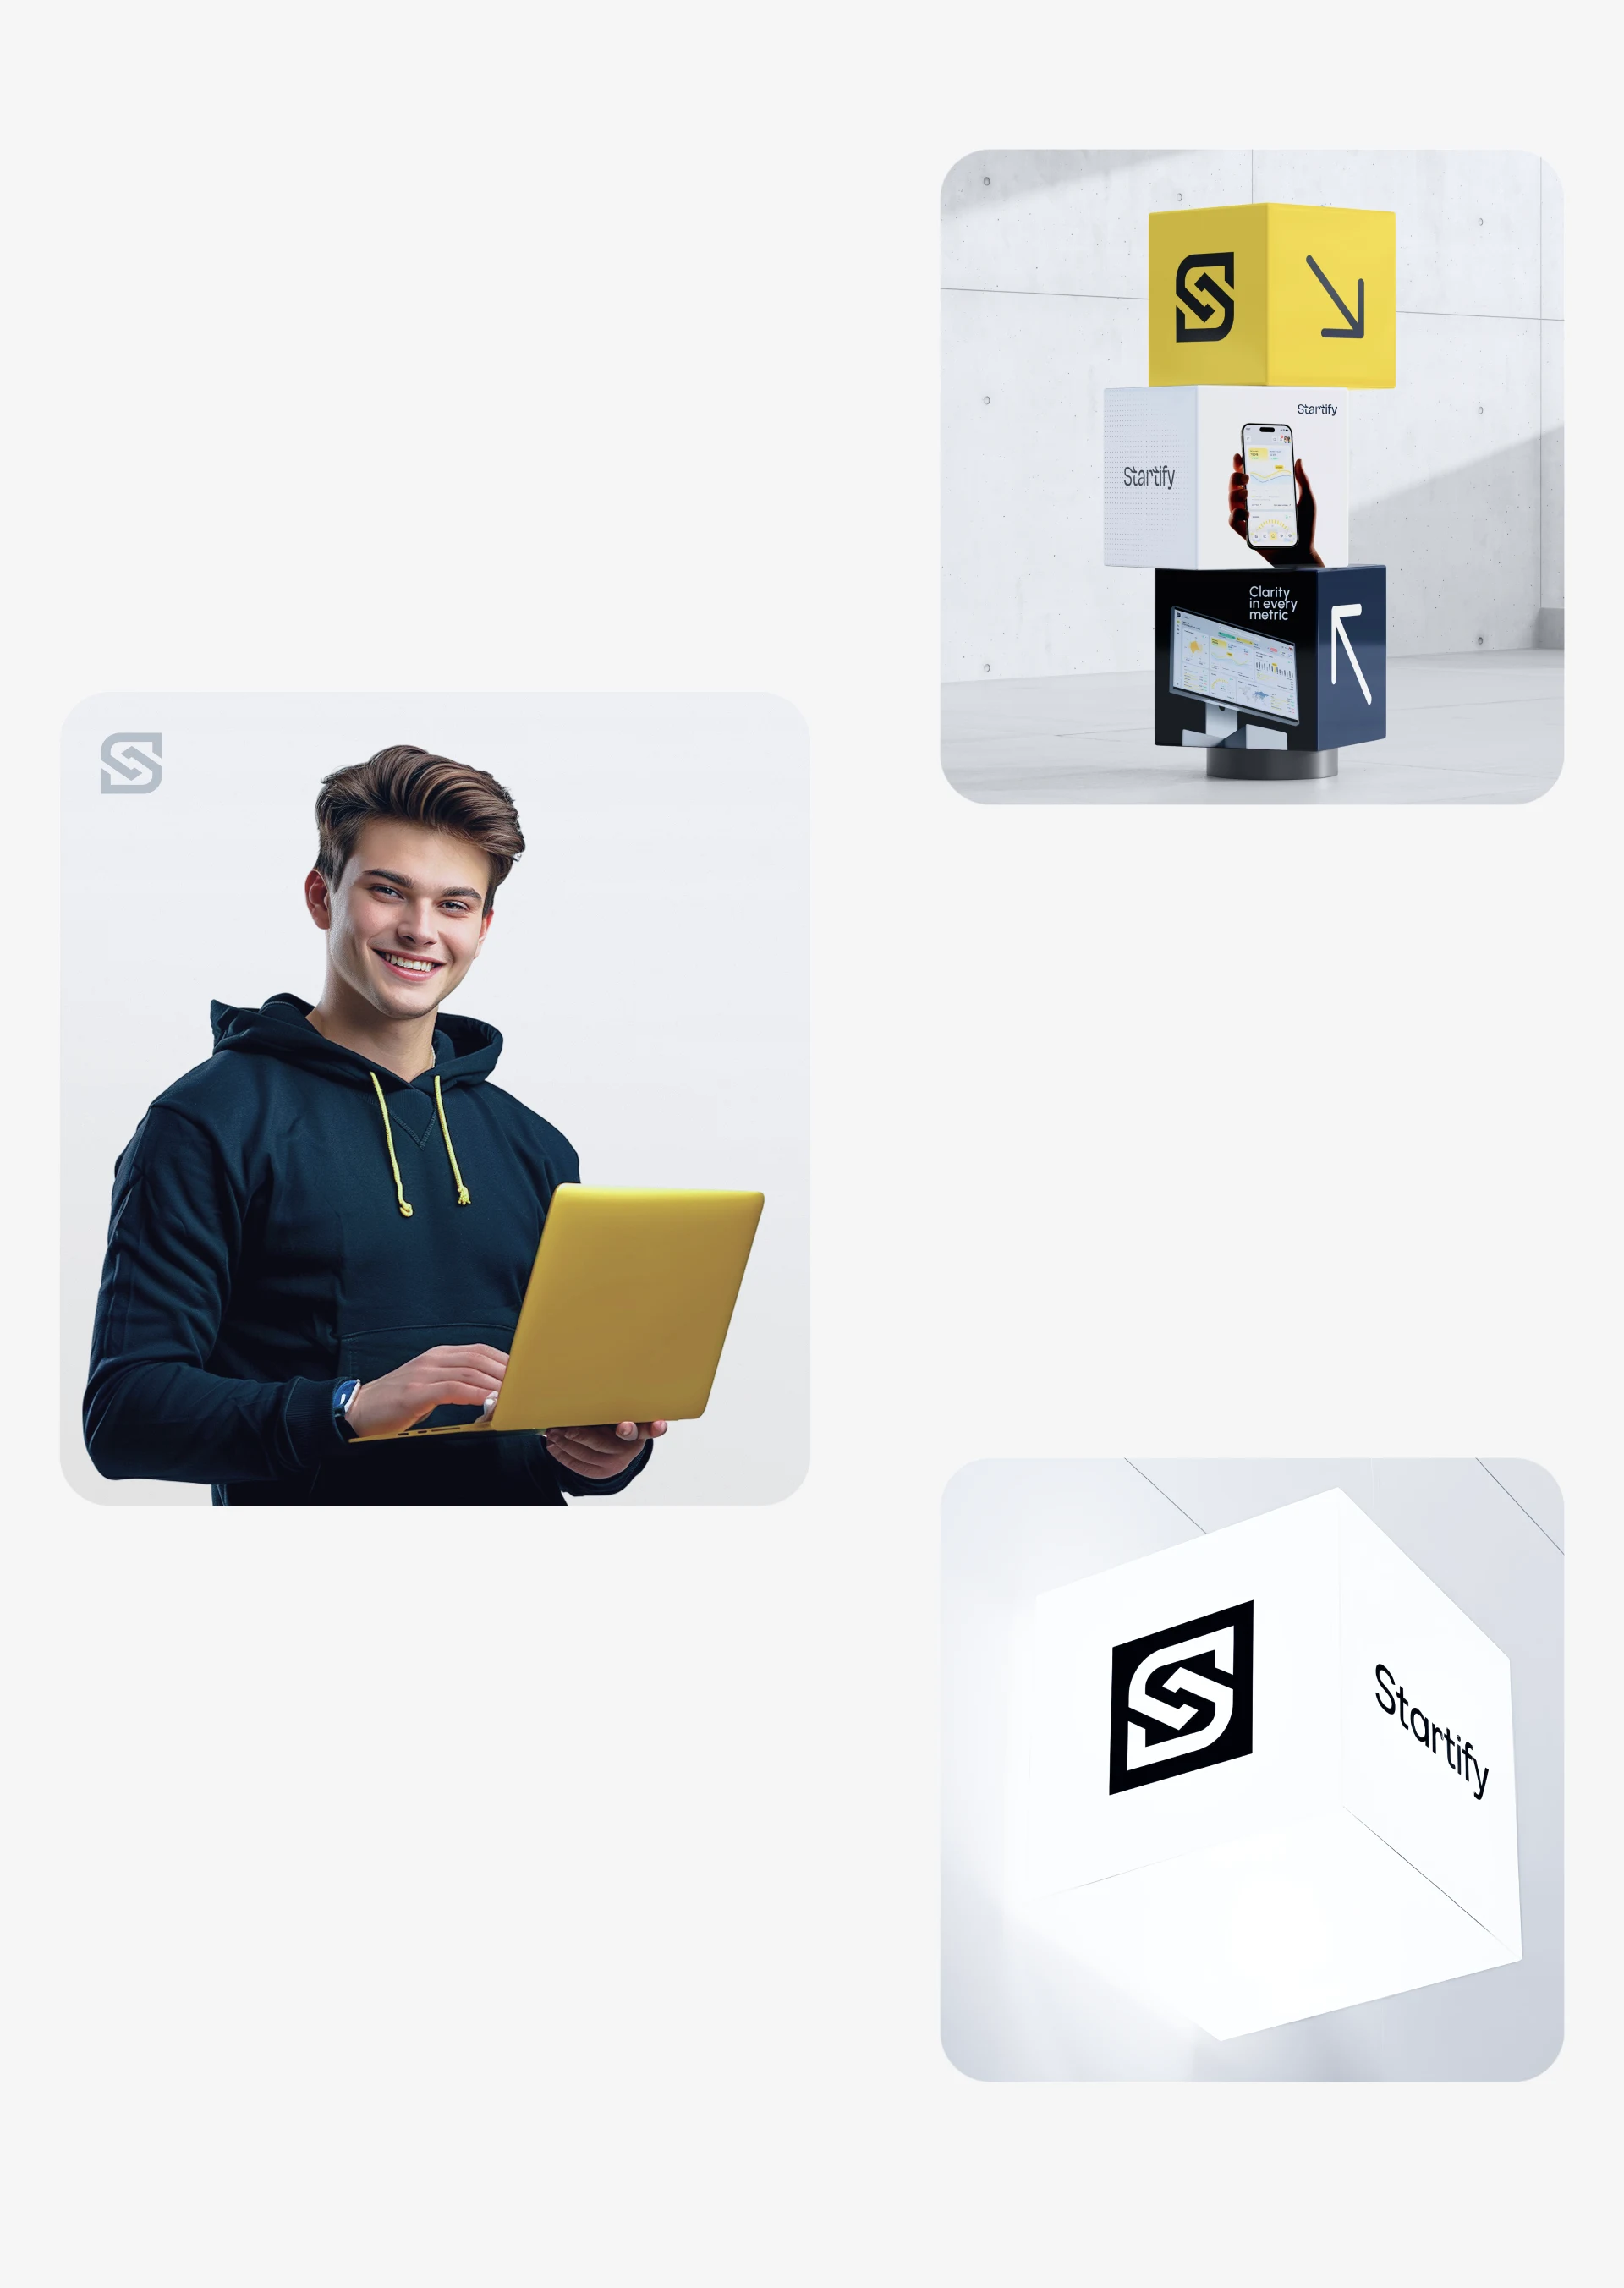
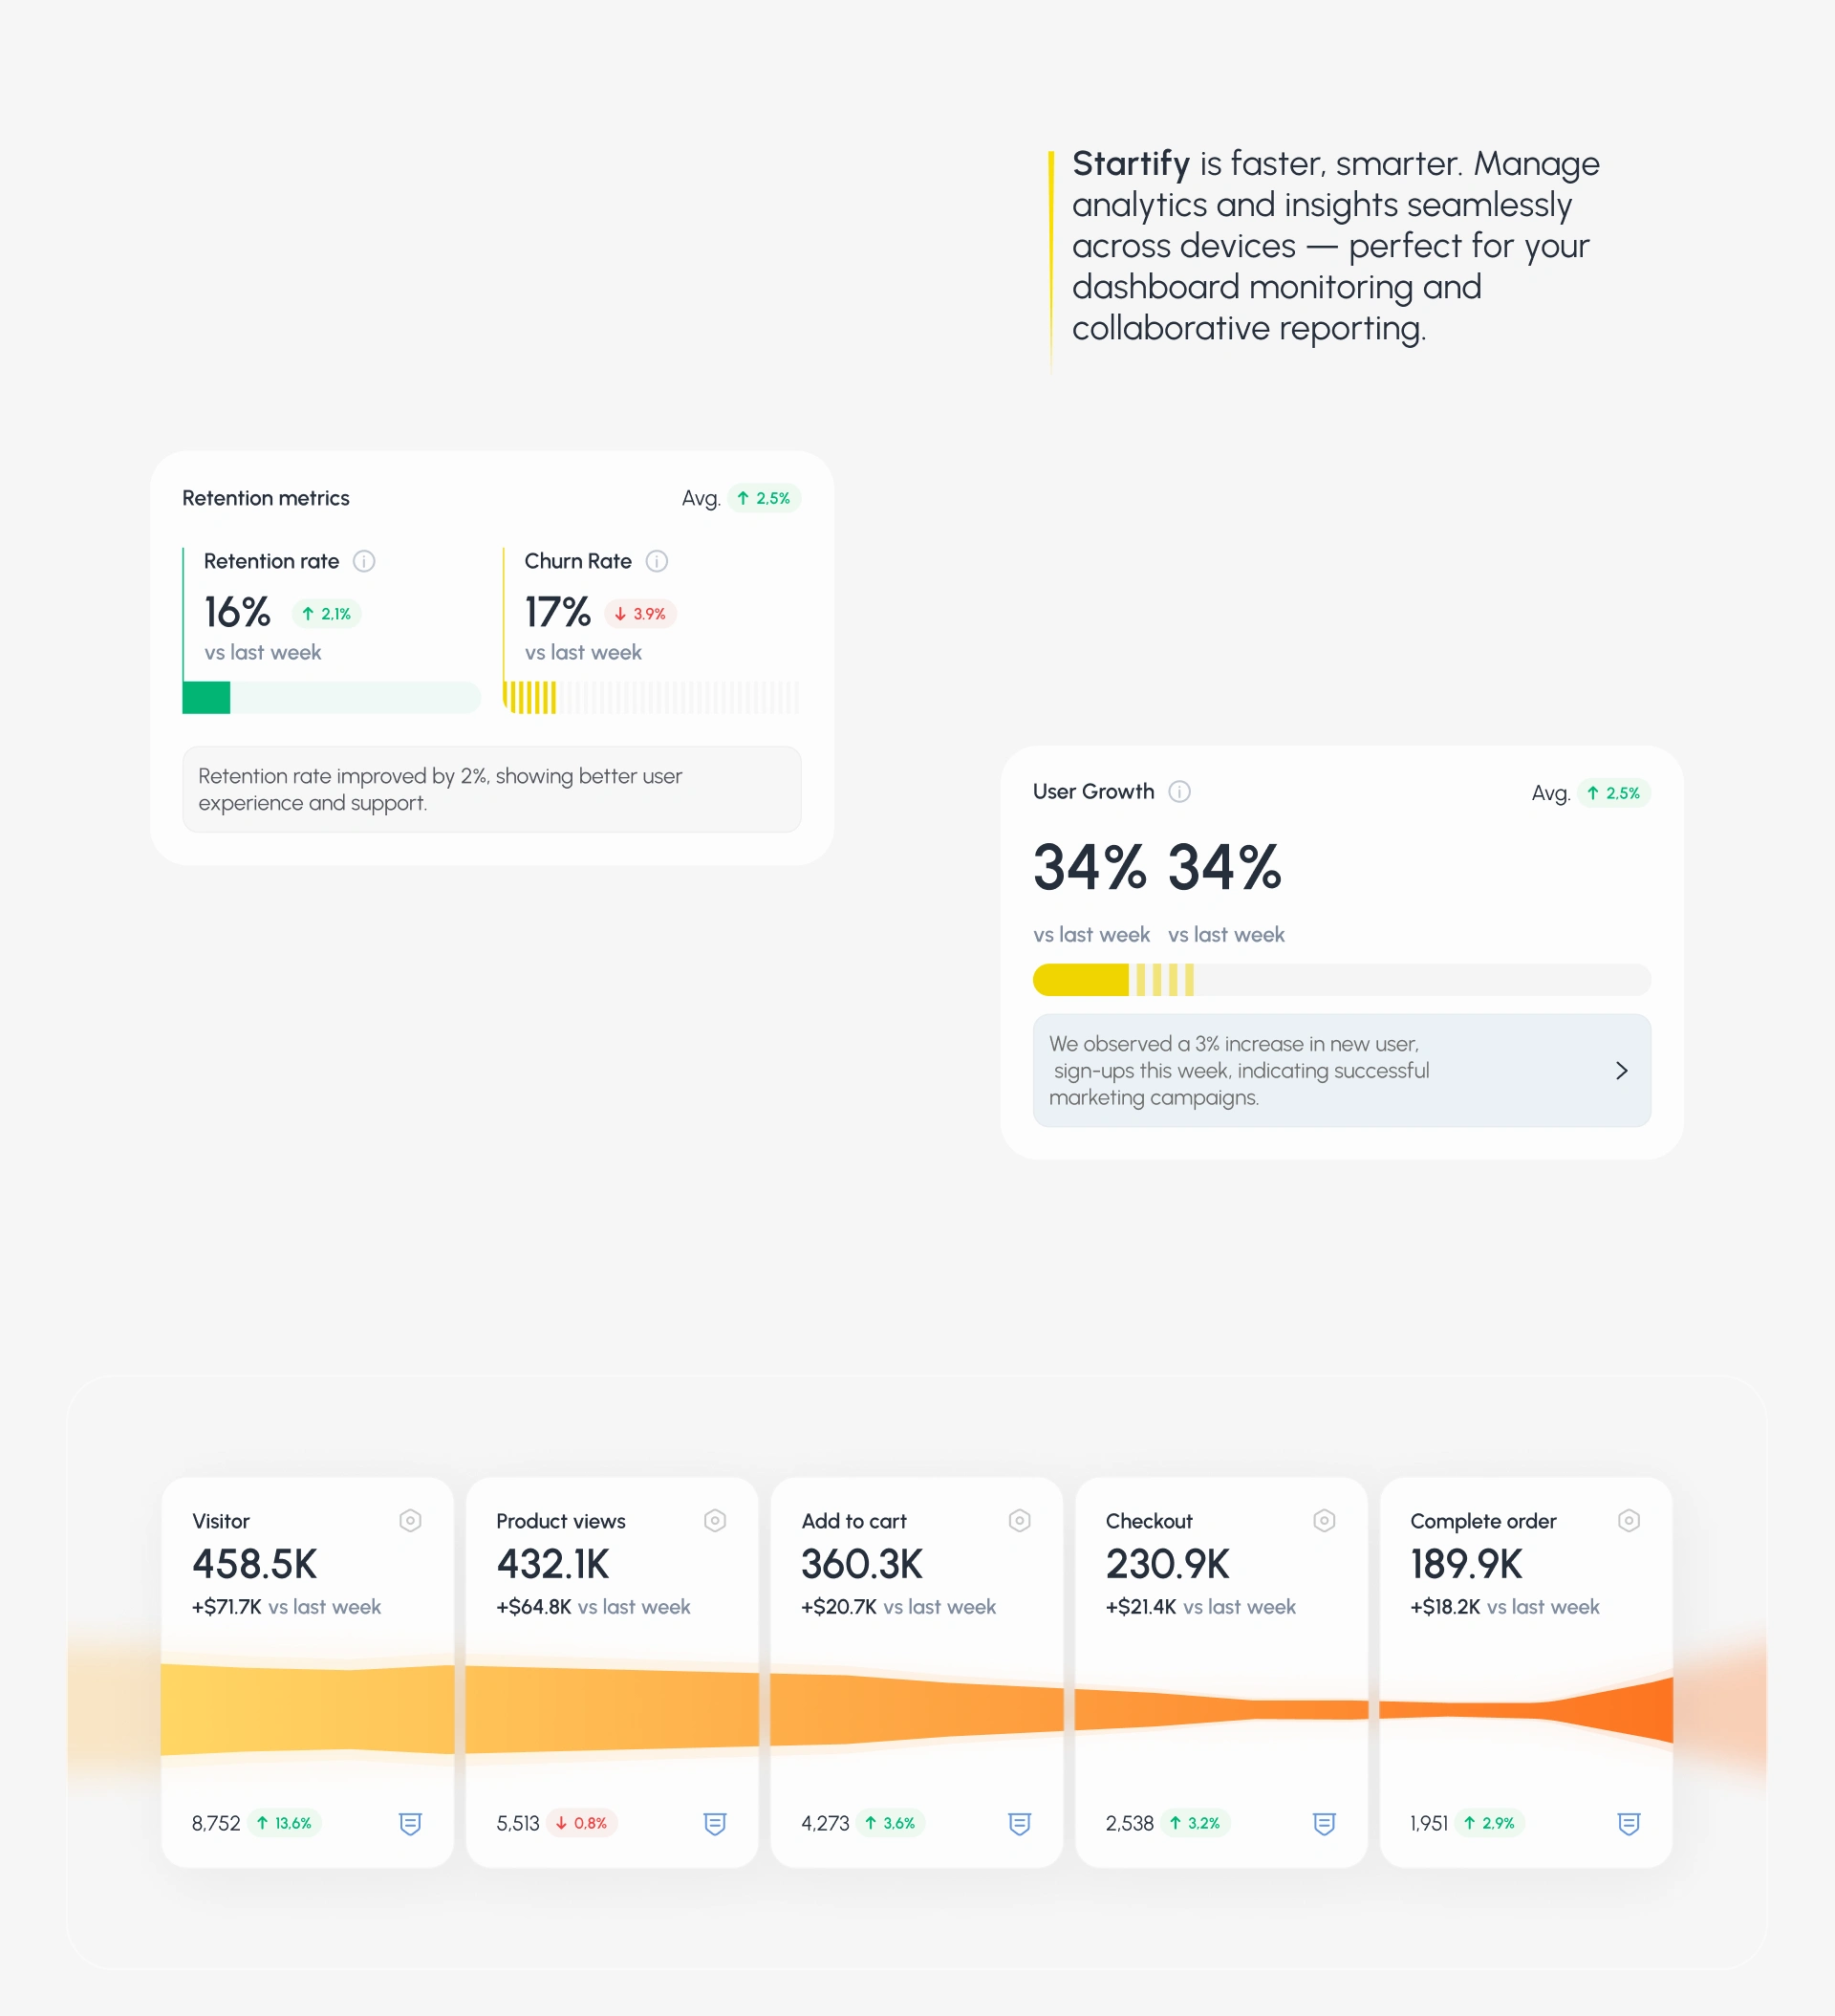
Startify is faster, smarter. Manage analytics and insights seamlessly across devices — perfect for your dashboard monitoring and collaborative reporting.
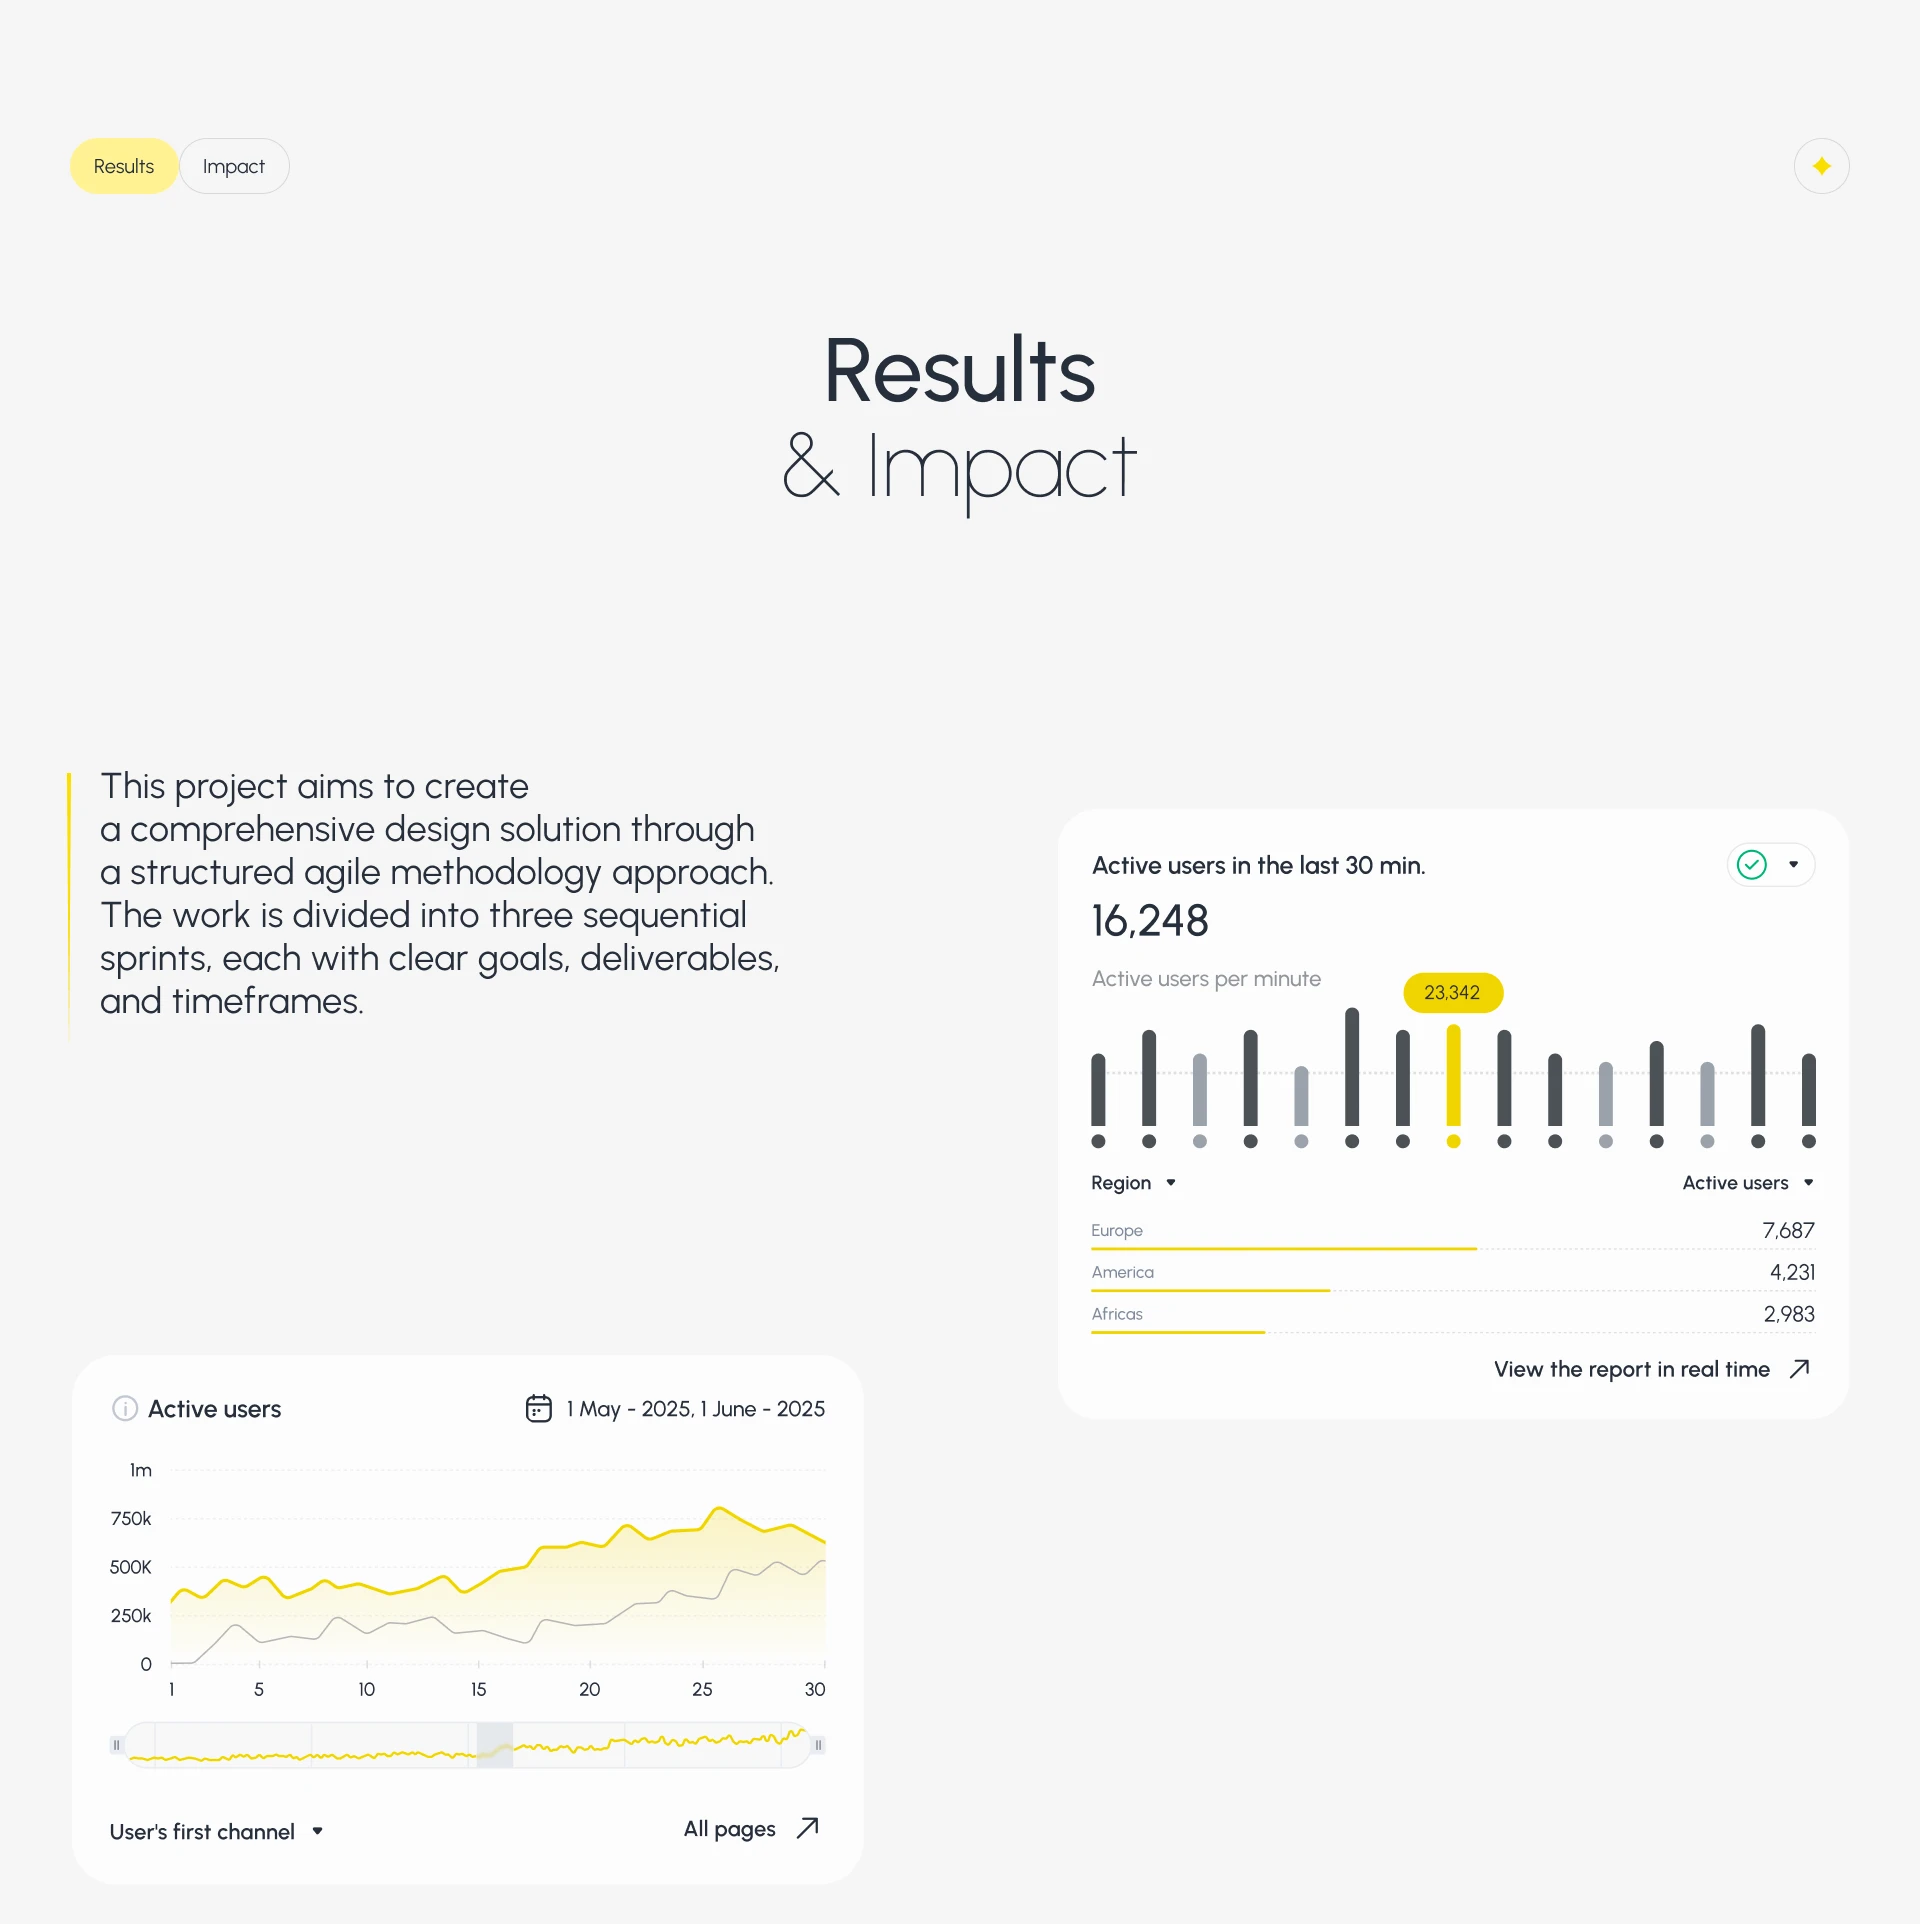
This project aims to create a comprehensive design solution through
a structured agile methodology approach. The work is divided into three sequential sprints, each with clear goals, deliverables, and timeframes.

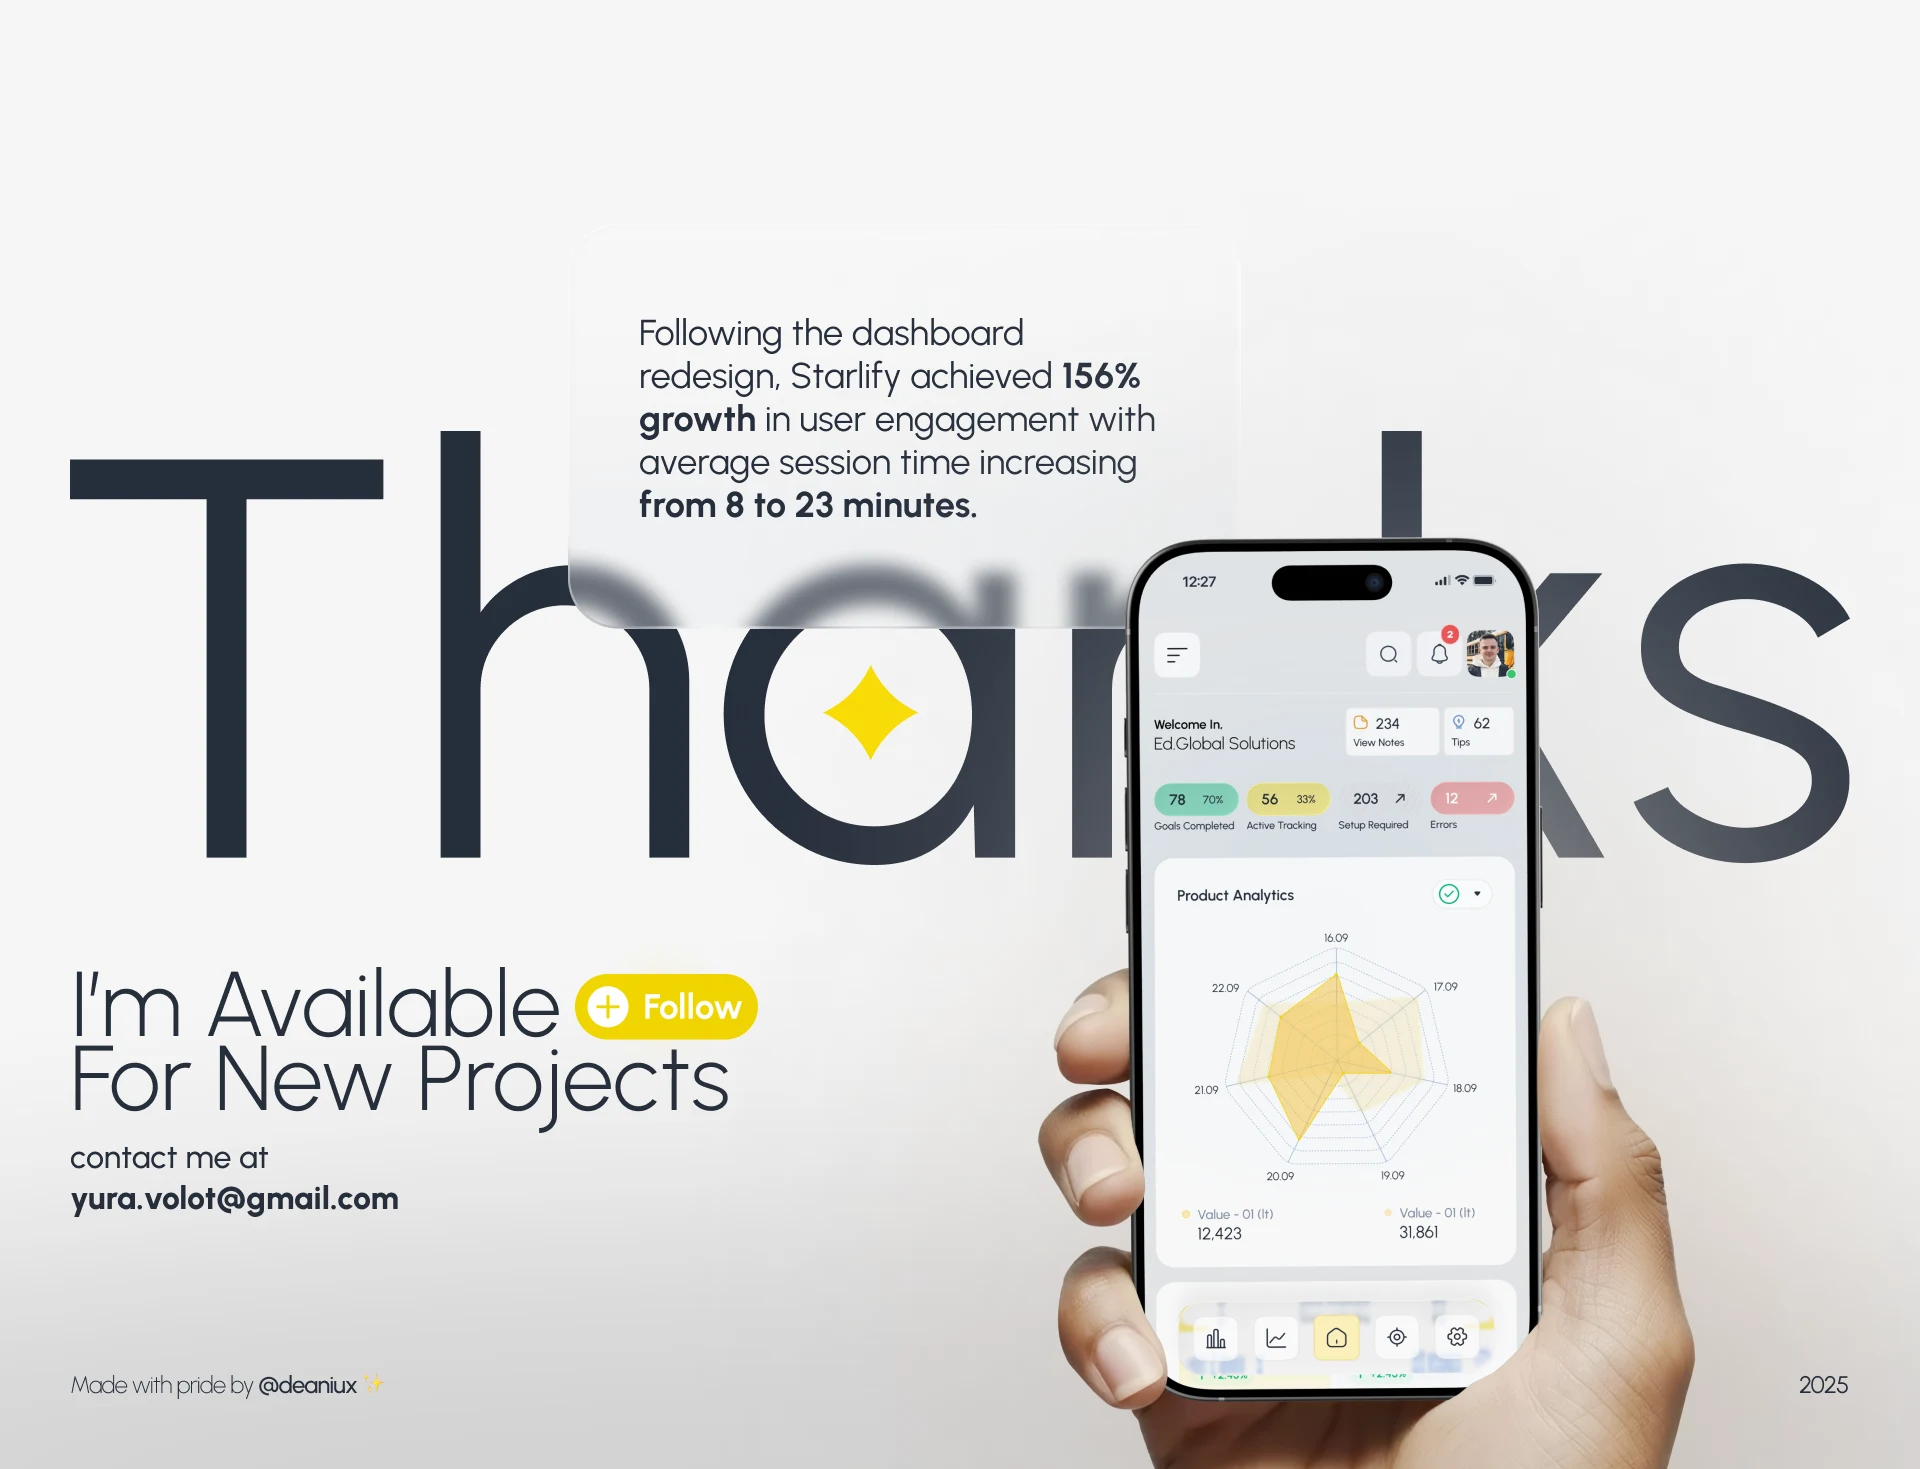
Following the dashboard redesign, Starlify achieved 156% growth in user engagement with average session time increasing from 8 to 23 minutes.
Like this project
Posted Nov 15, 2025
Starlify is a comprehensive analytics platform designed to help businesses track, analyze, and optimize their digital presence in real-time. The dashboard prov…
Likes
1
Views
5
Timeline
Oct 25, 2025 - Nov 8, 2025