Power BI Dashboard for Accounting Office
Mário Guedes
An accounting office approached me in need of a dashboard to help calculate and visualize which tax regime is most beneficial to each client. They had several Excel spreadsheets to perform these calculations, but these were difficult to update and to visualize.
Using Python, I built an automation that extracts the raw data from their accounting system so that they no longer need to update each spreadsheet individually. I also automated the treatment of the data and unified it into a single .csv loaded into PowerBI. Finally, I built the visualization in visual way, simple to understand.
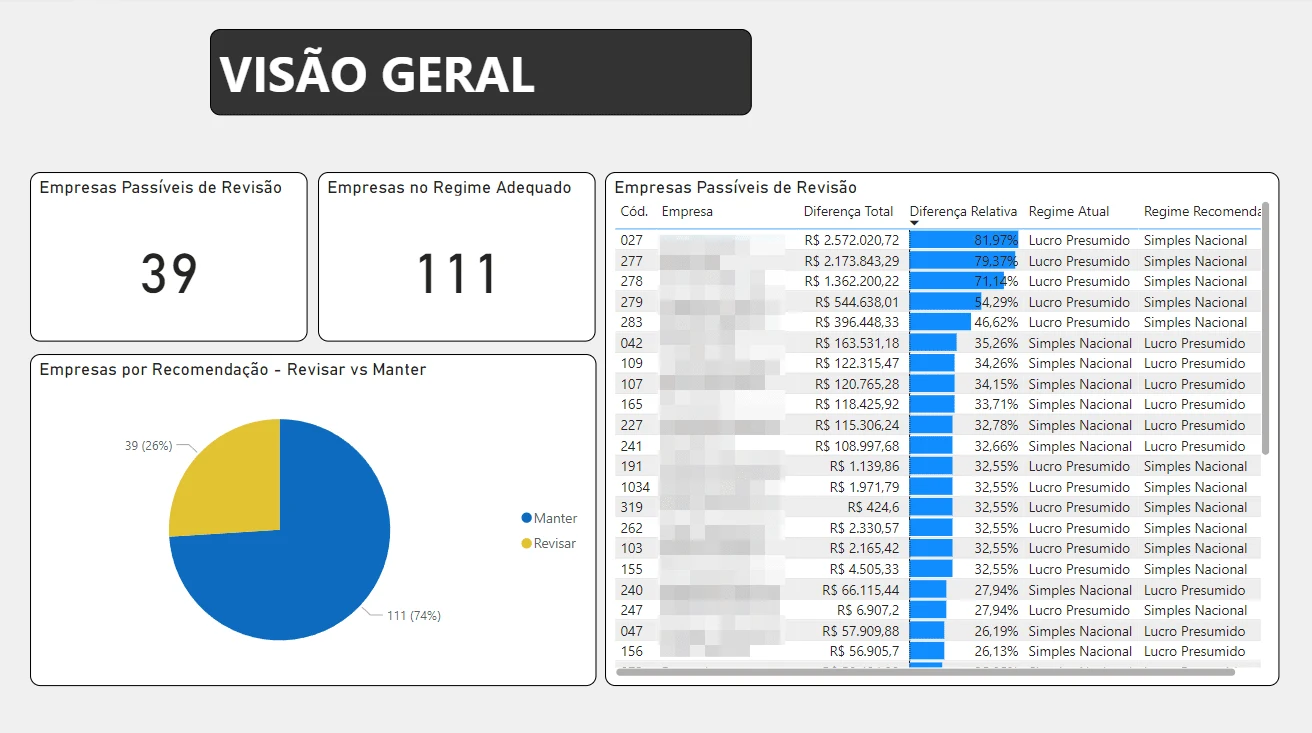
Dashboard page 1 - Overview
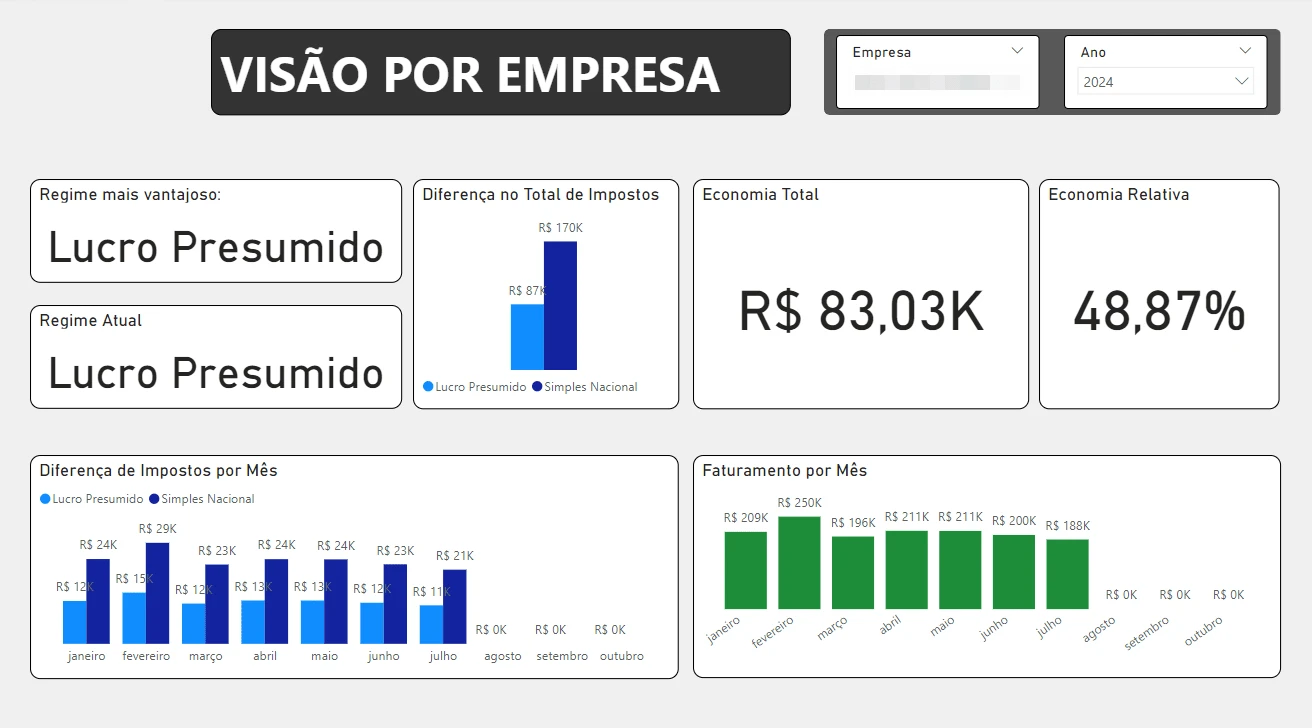
Dashboard page 2 - Single company view
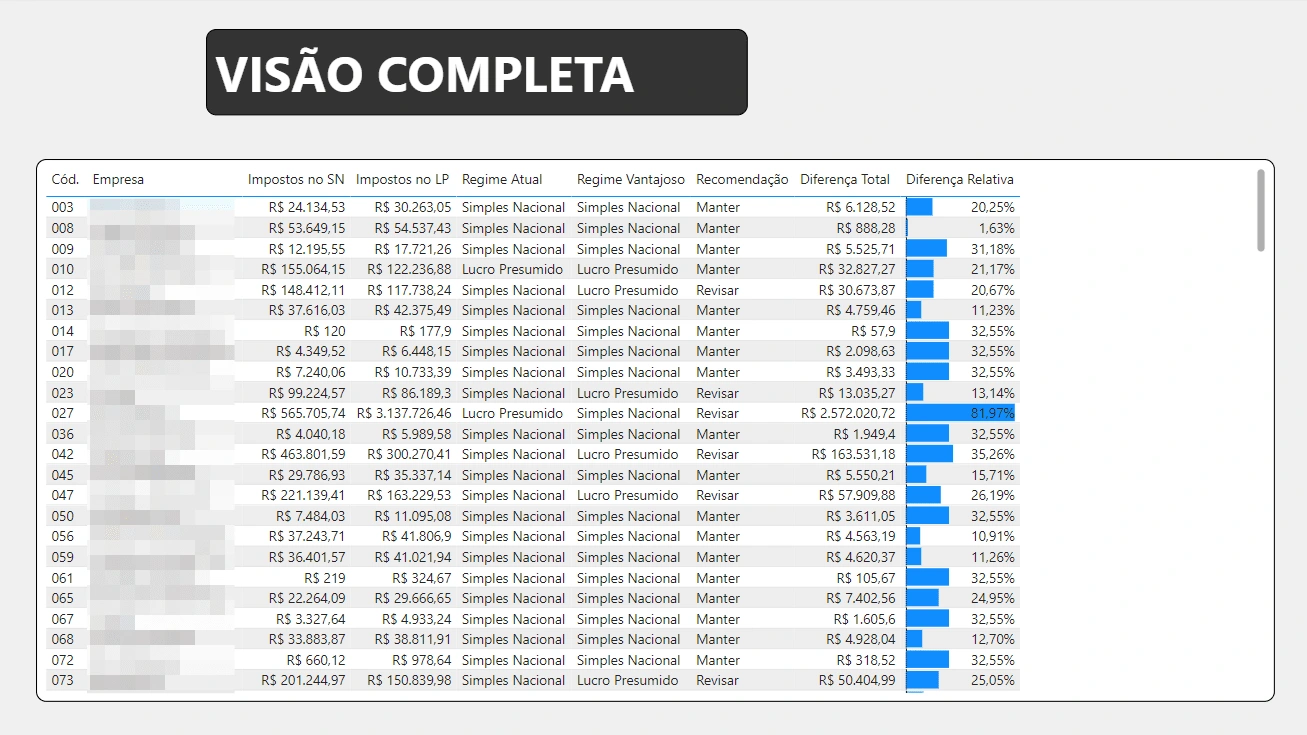
Dashboard page 3 - All companies full table view
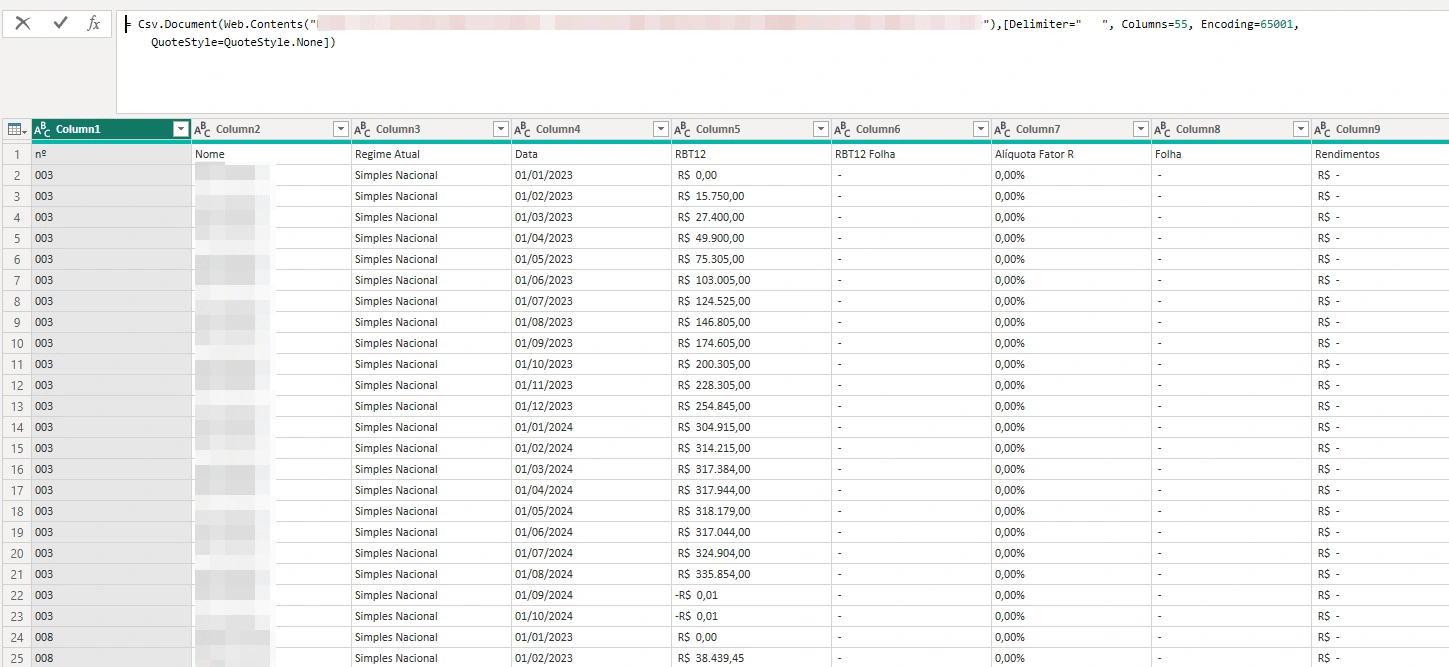
Data import query
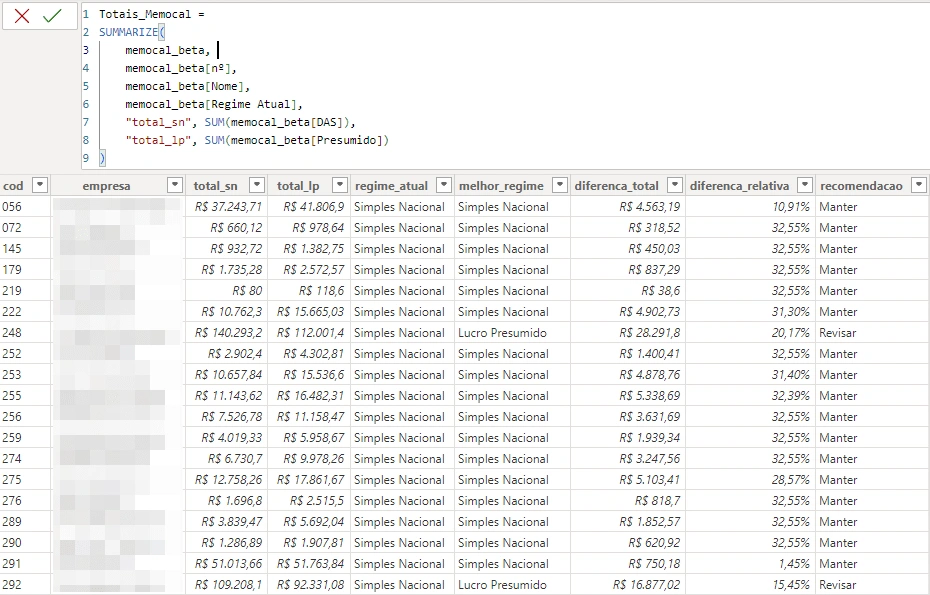
Calculated table
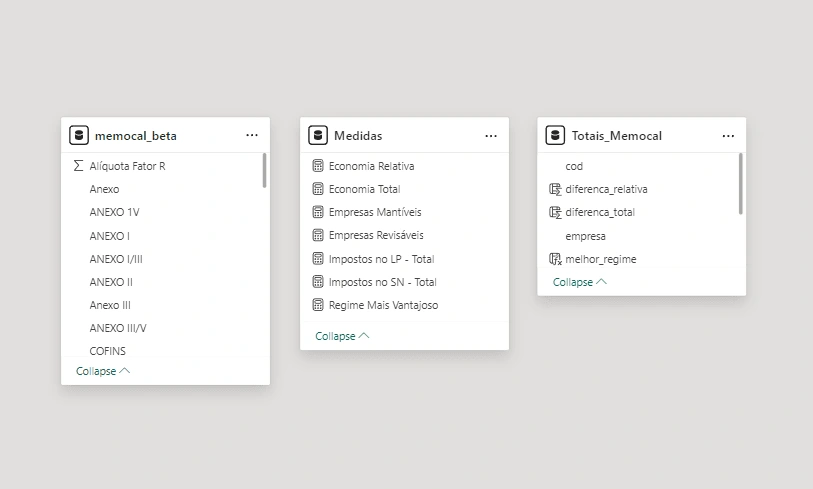
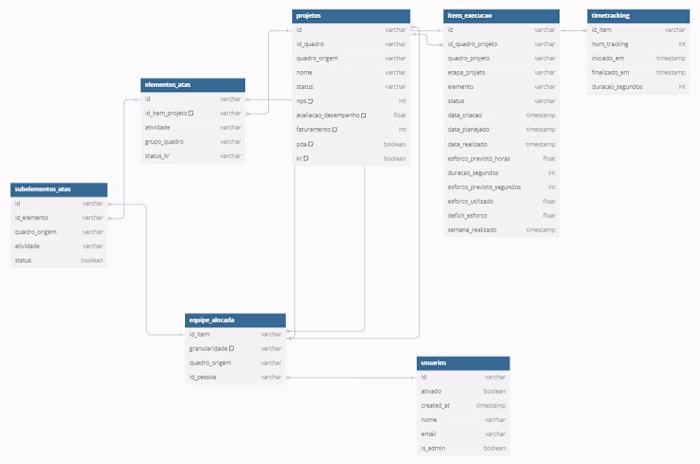
Data model
Like this project
Posted Feb 10, 2025
Built a dashboard for an accounting office showing which tax regime is most beneficial to each client, helping them lower tax costs for their clients.