Universal CSV Dashboard — Automated Business Analytics

Olena Havrylova



Understand your business in under 60 seconds.
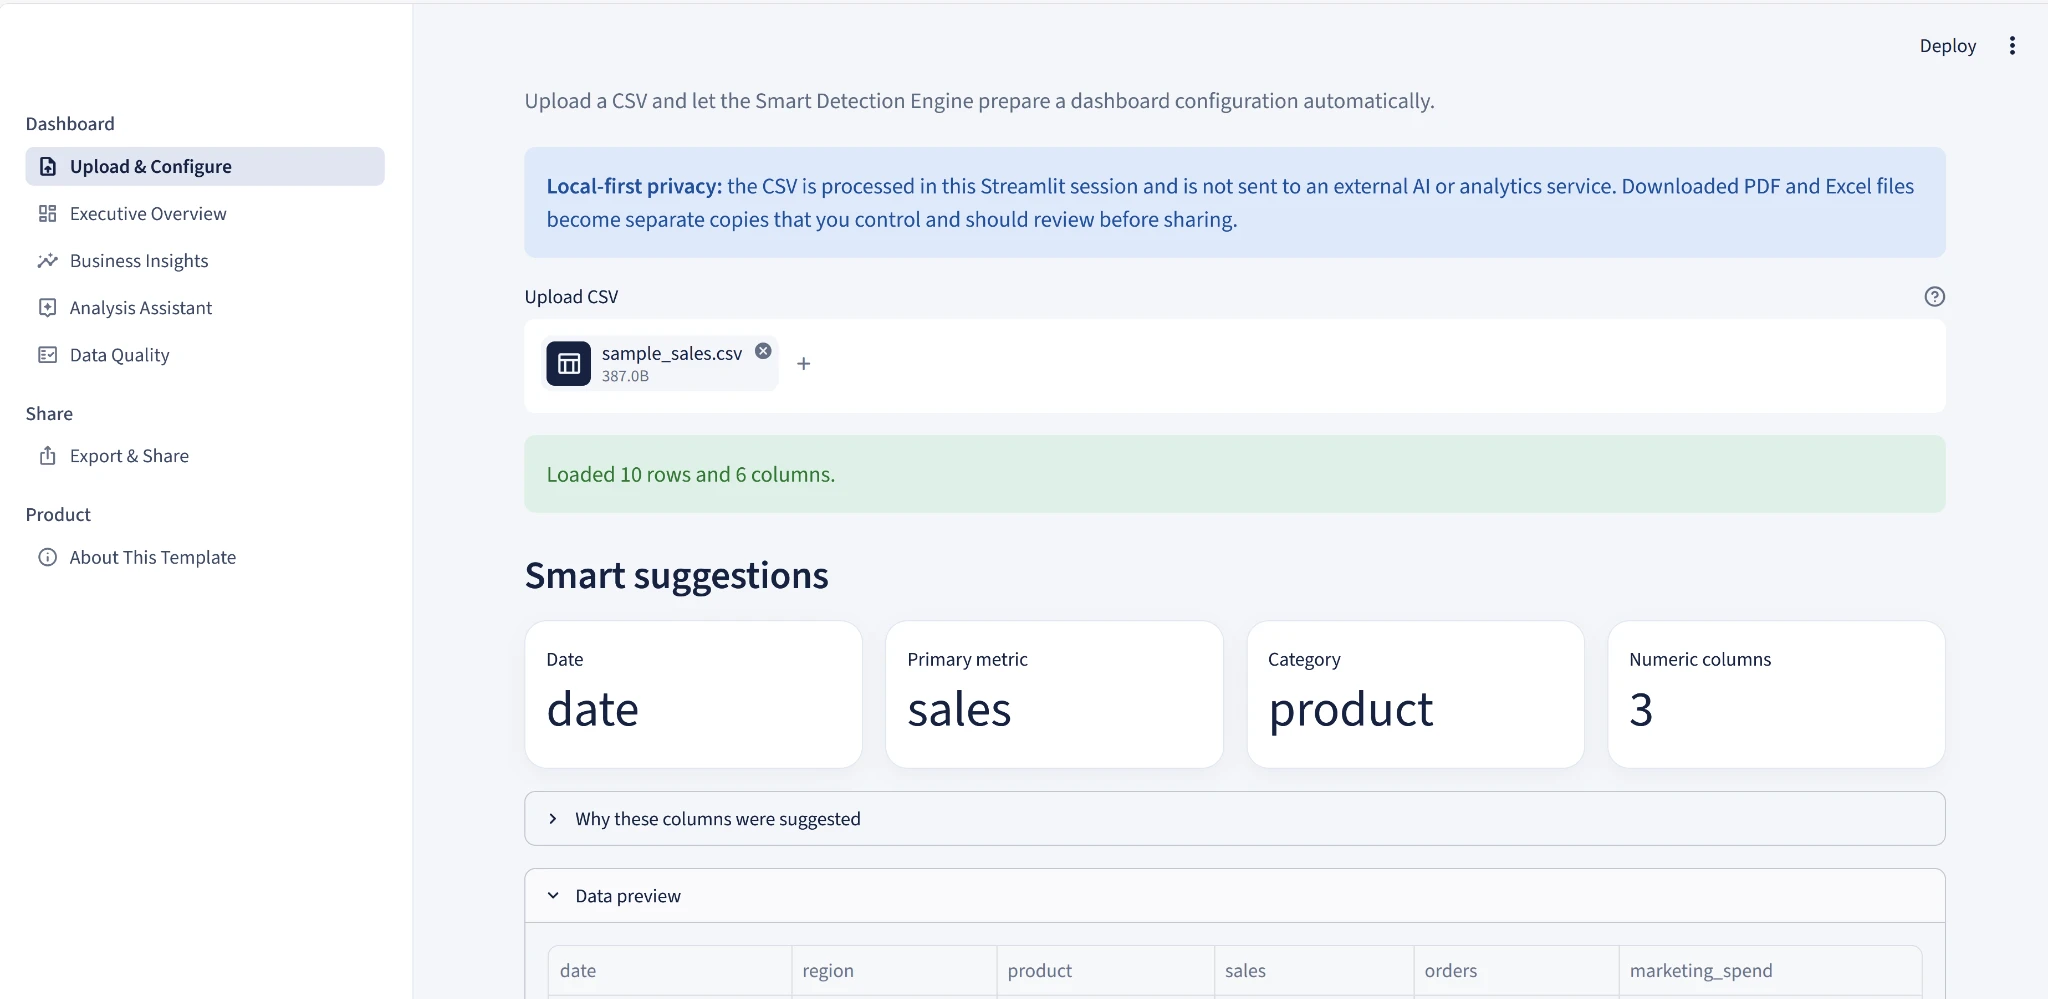
Upload a CSV and turn it into clear metrics, trends, data-quality checks and interactive business views — without building a dashboard from scratch.

Business data is easy to export. Understanding it is not.
The usual workflow starts with a CSV and quickly turns into manual cleaning, pivot tables, chart formatting and repeated questions about what the numbers actually mean.
Universal CSV Dashboard shortens that path:
upload a CSV;
confirm the detected fields;
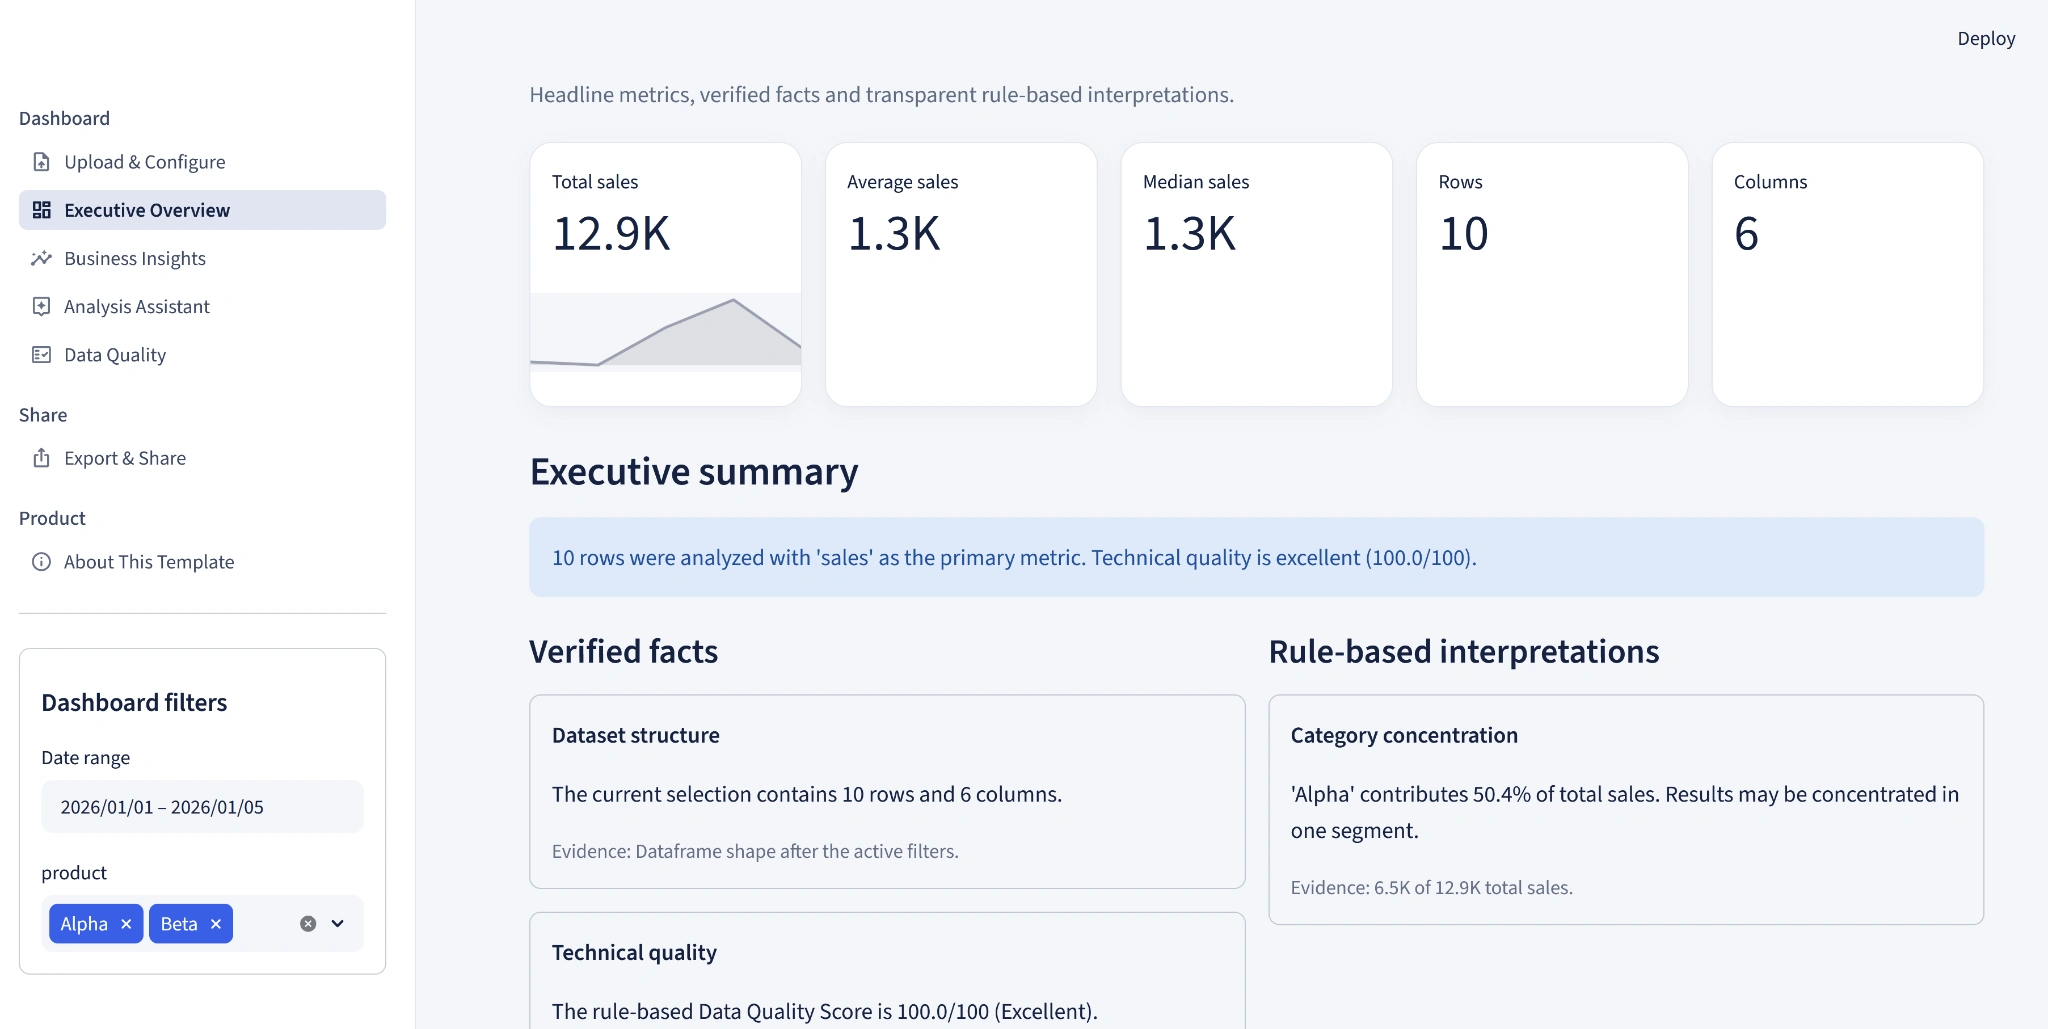
review verified executive facts and rule-based interpretations;
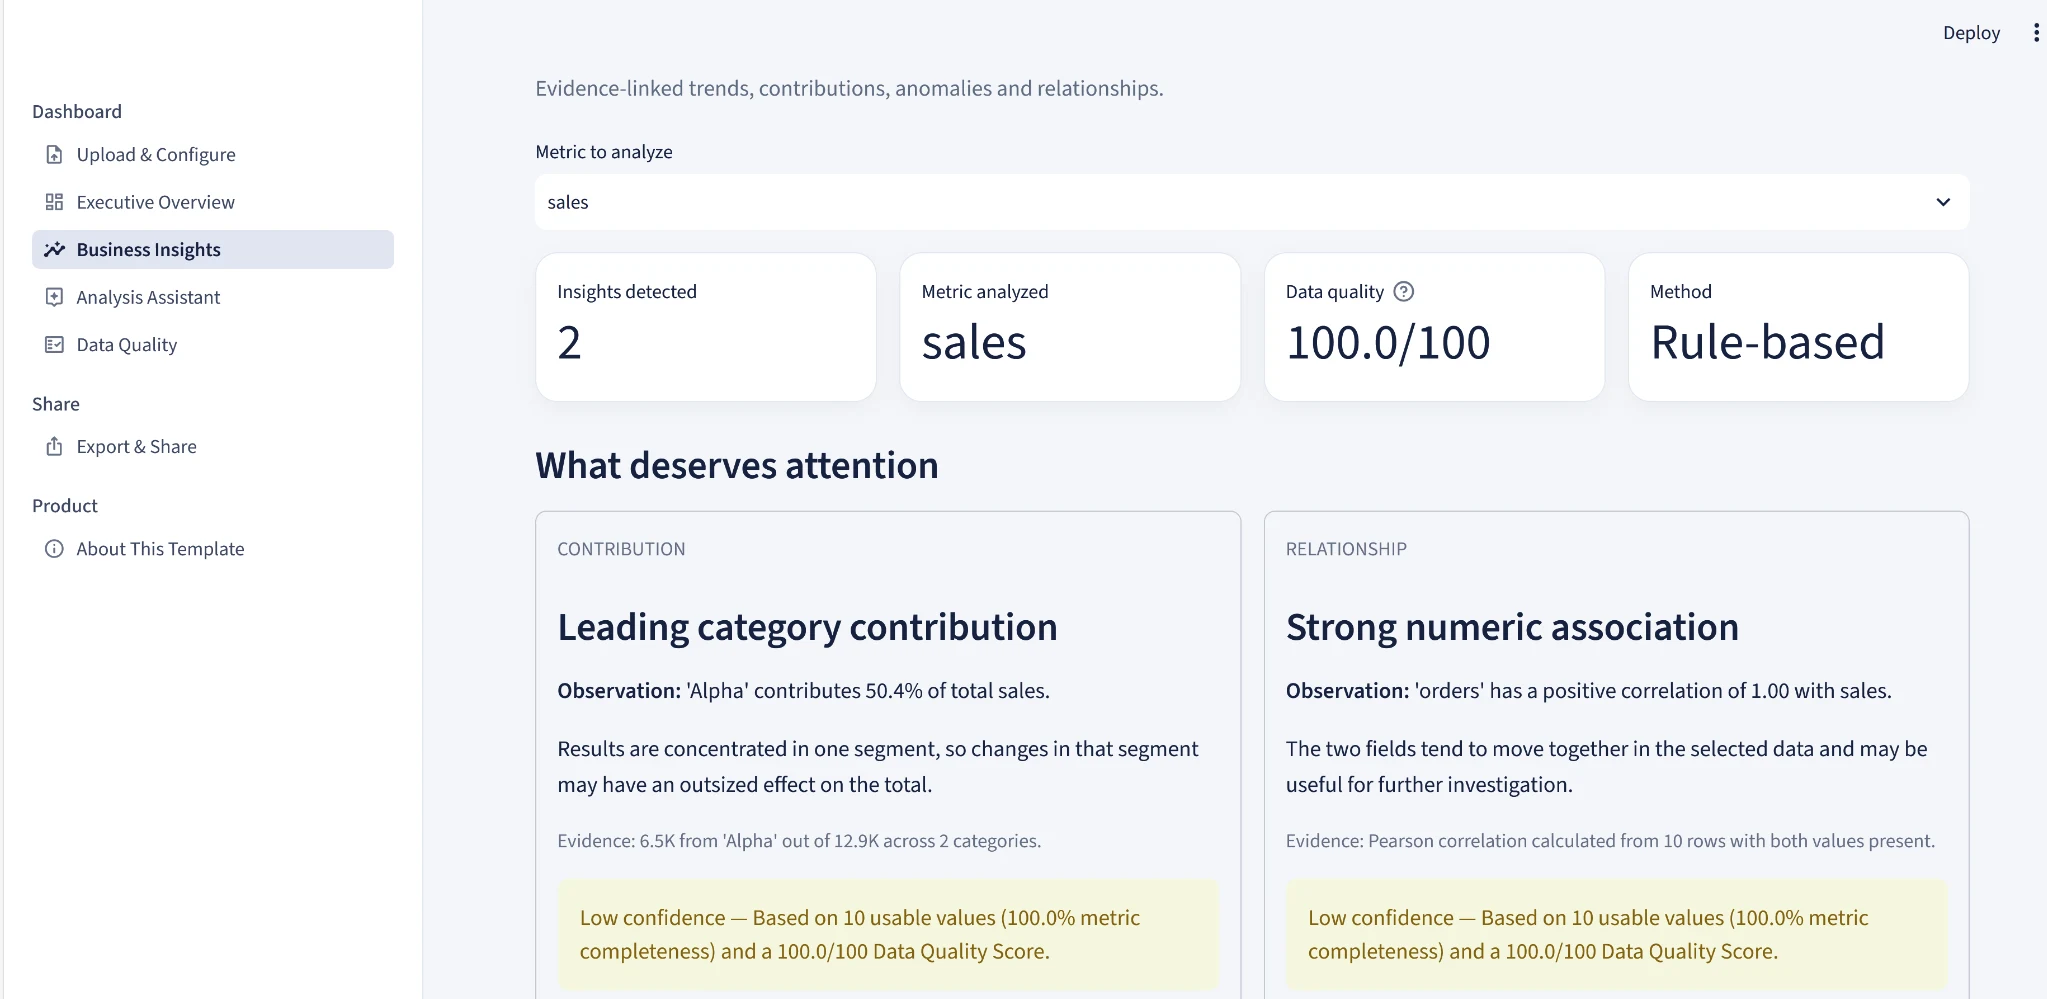
inspect evidence-linked business insights and data quality;
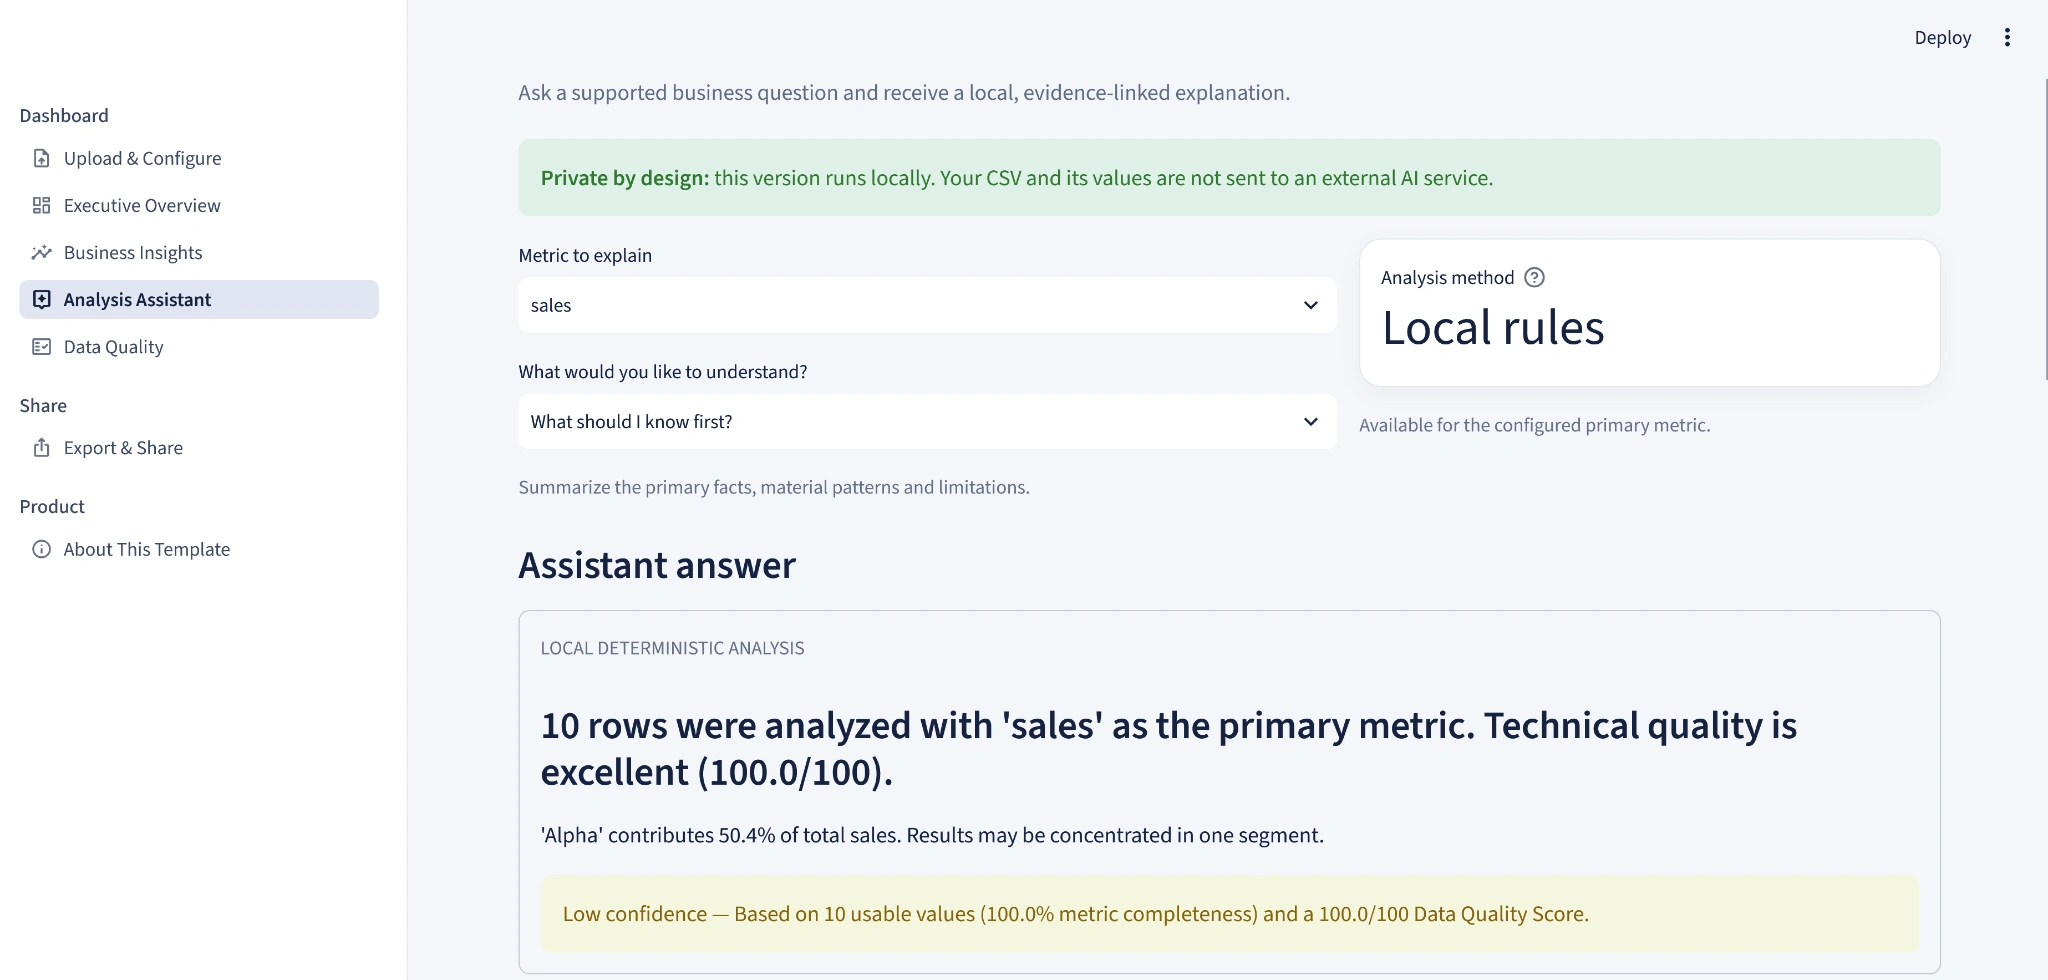
ask supported questions in the local Analysis Assistant;
save the project or export a traceable Excel or PDF report;
filter the results;
decide what to investigate next.
It is designed for analysts, consultants, small teams and business owners who need a useful first view of a dataset without setting up a BI project.
What you get
Executive Overview — Recommended KPIs, verified facts and transparent rule-based interpretations
Automatic field detection — Editable date, metric and category suggestions
Business Insights — Evidence-linked trends, contributions, anomalies and relationships
Analysis Assistant — Local guided questions and evidence-based explanations
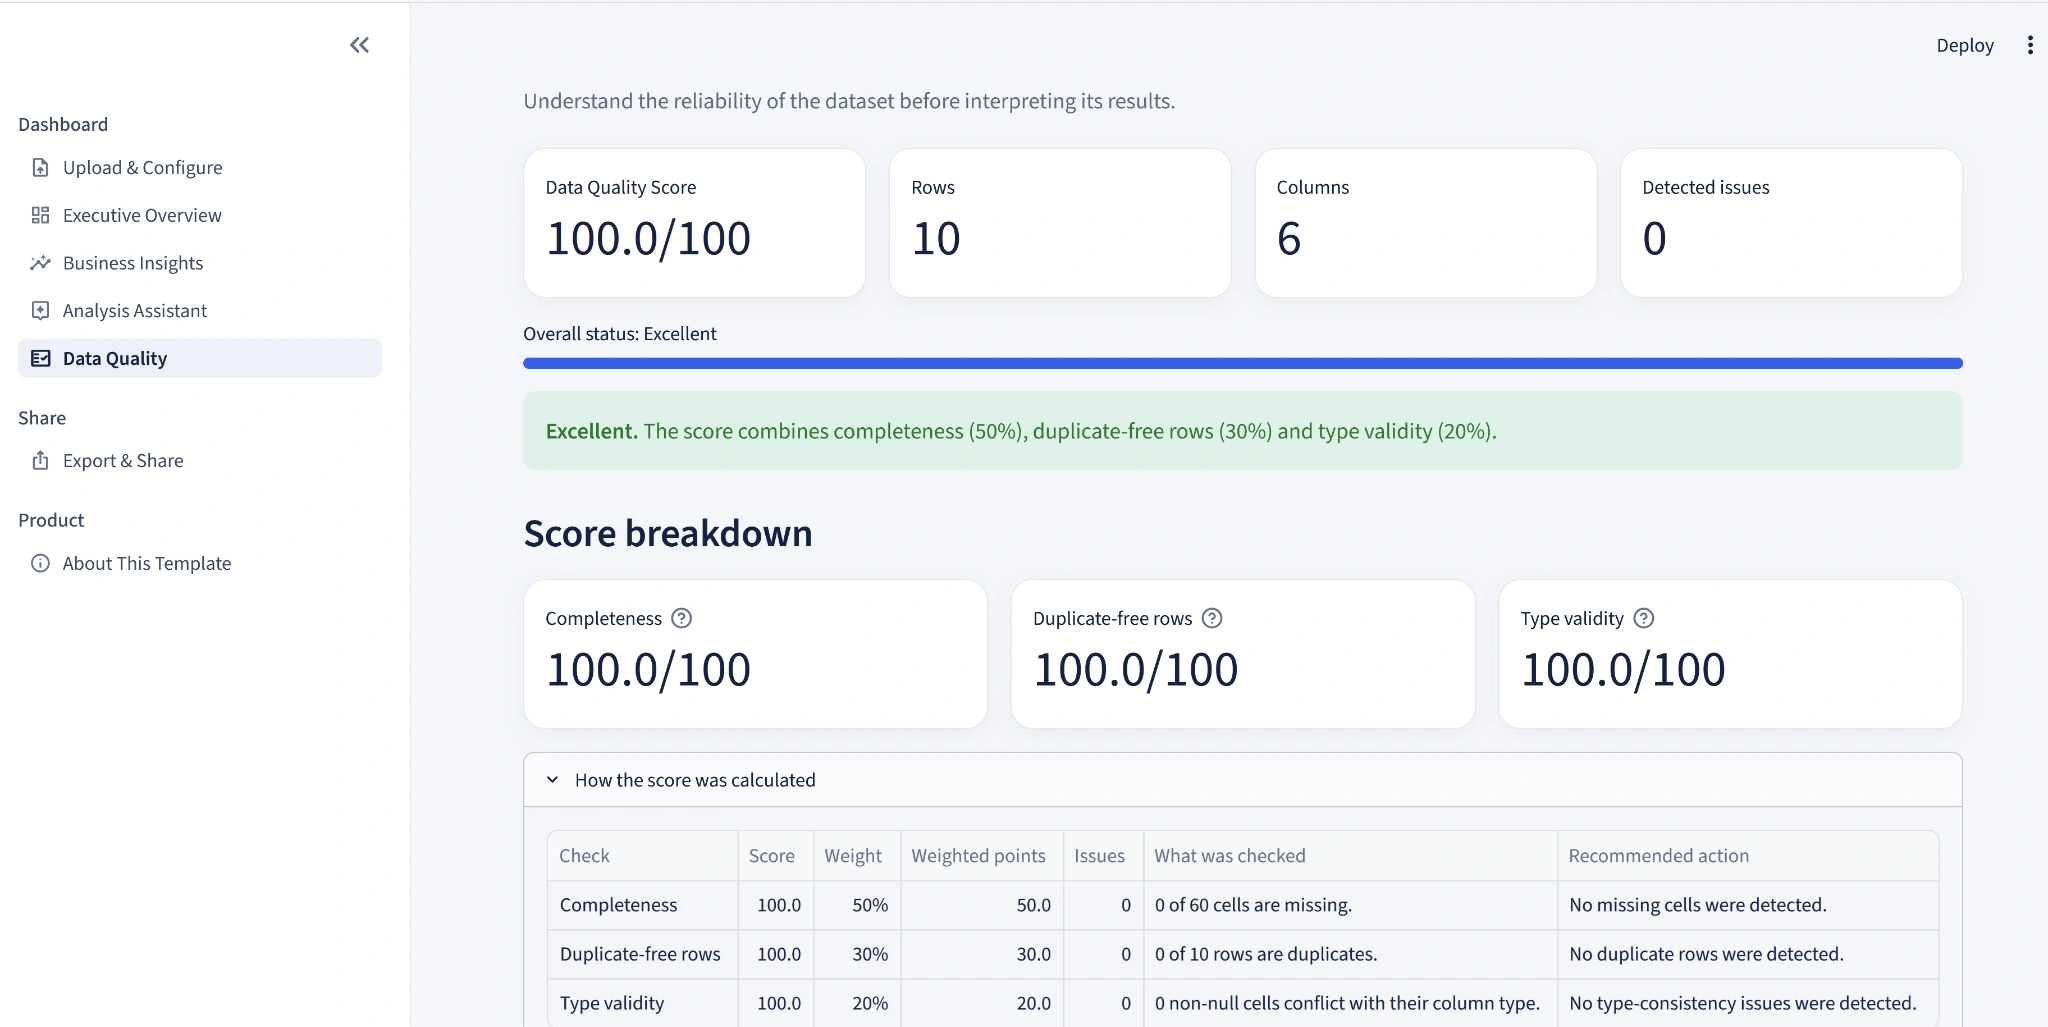
Data Quality — Transparent scoring for missing data, duplicates and type validity
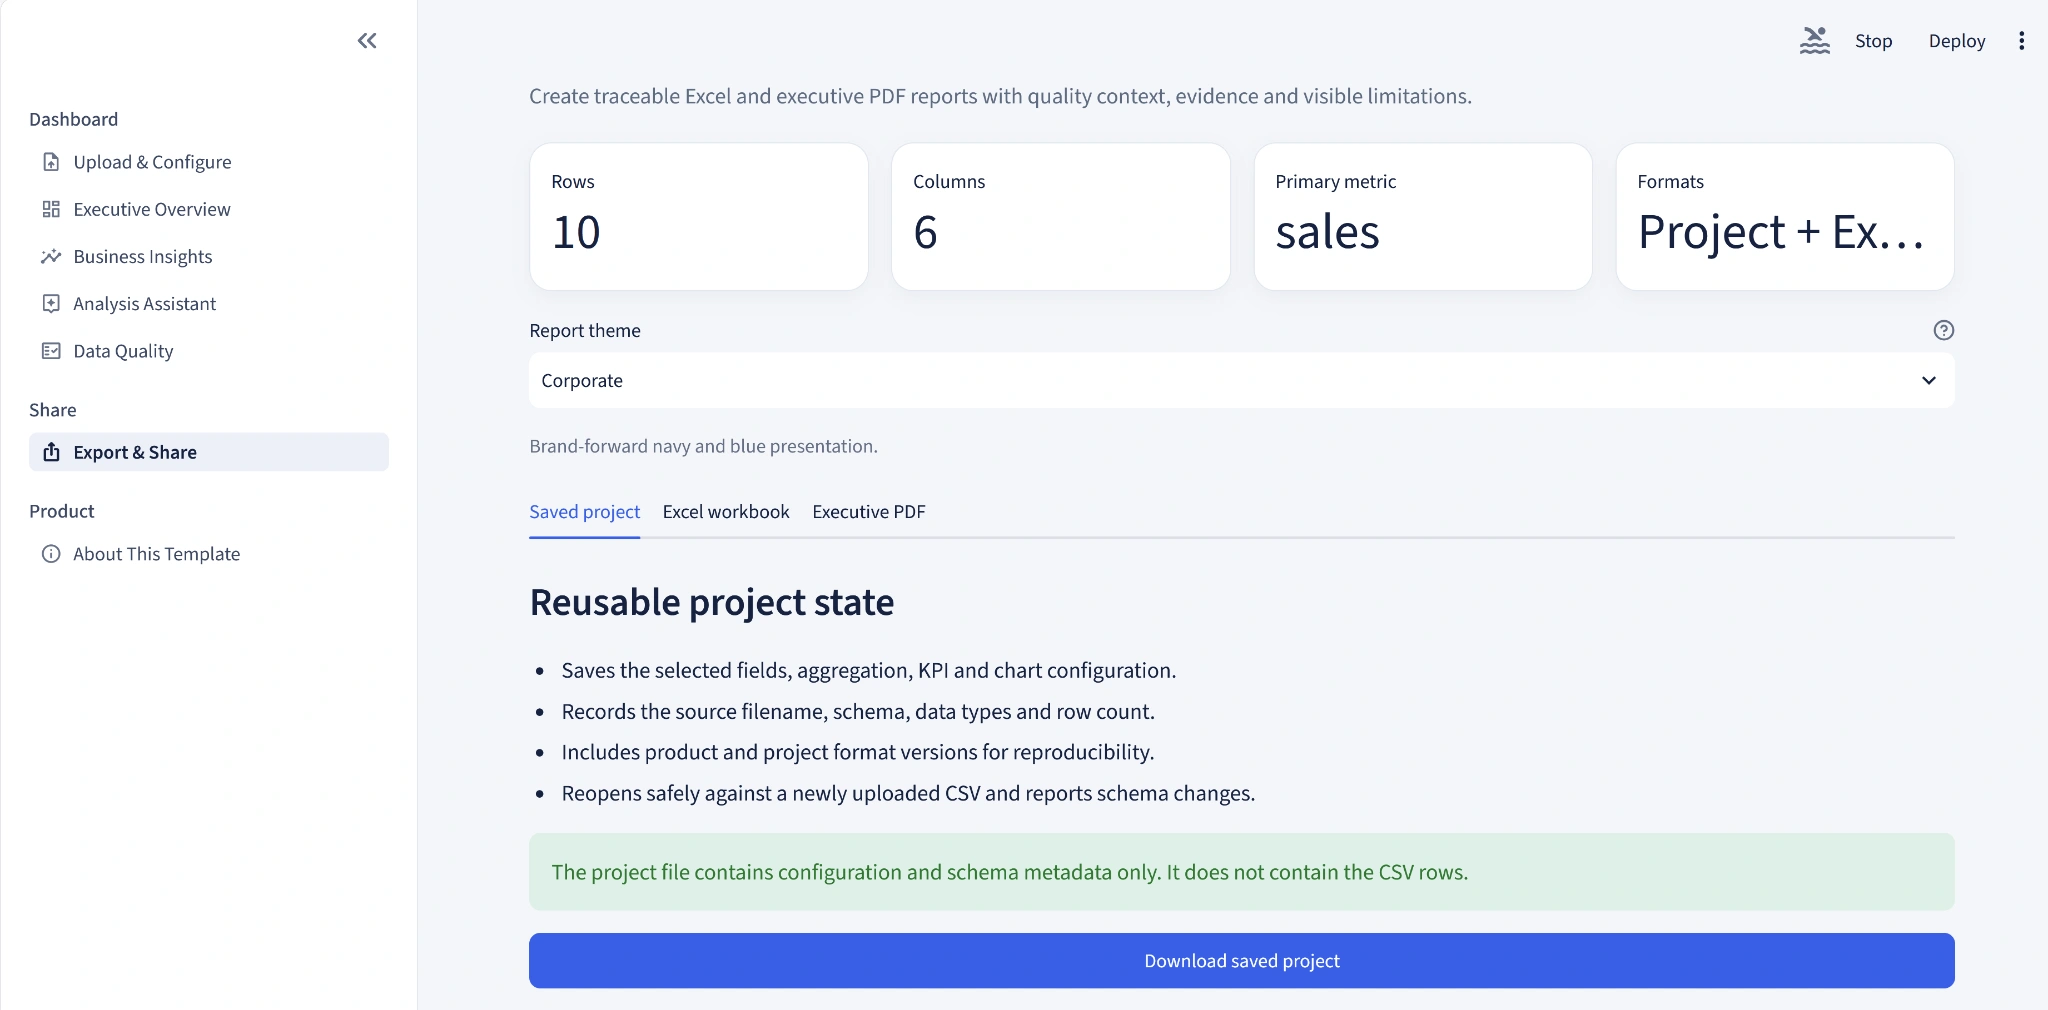
Export & Share — Reusable projects plus traceable Excel and executive PDF reports
Product preview
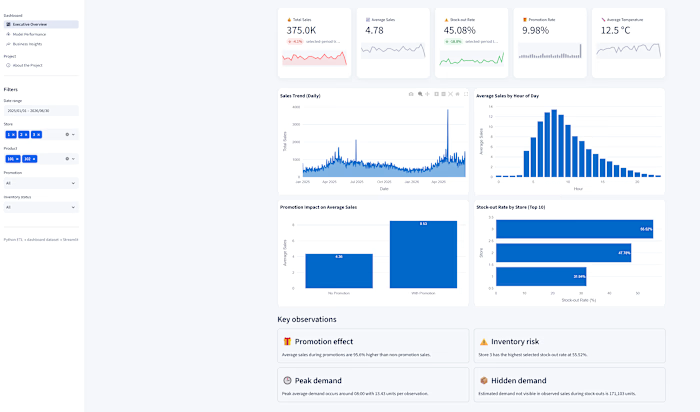
The interface is intentionally calm and consistent: a focused navigation rail, clear KPI cards, useful filters and business-readable chart titles.
Product gallery
Executive Overview
Business Insights
Analysis Assistant
Data Quality
Export & Share
Why not start in a spreadsheet?
Spreadsheets remain excellent for direct editing and detailed ad-hoc work. Universal CSV Dashboard is for the earlier question: “What is in this file, and what deserves attention?”
Instead of rebuilding the same pivots and charts, users get reusable automatic analysis, field detection, integrated data-quality checks, evidence-linked insights and traceable reports — while keeping control of their data locally.
From prototype to stable product
I developed Universal CSV Dashboard as an end-to-end product rather than a dashboard mockup.
The work covered product design, analytics architecture, dashboard UX, automated testing, documentation, security and privacy considerations, performance validation and release engineering.
Validation
The stable v1.0 release passed 176 automated tests and a formal release-readiness review with 21 PASS, 0 WARN and 0 FAIL.
Performance testing with a synthetic 24 MB CSV containing 738,965 rows completed core parsing, field detection and data-quality analysis in 4.07 seconds on the reference environment.
My role
Product design · Data analysis · Python development · Analytics engineering · Dashboard UX · Testing · Documentation · Release engineering
Technology
Python · Streamlit · Pandas · Plotly · OpenPyXL · ReportLab · GitHub Actions
Open source
Universal CSV Dashboard is available as an open-source project under the MIT license.
Need something similar for your data?
I can customize Universal CSV Dashboard for your dataset, KPIs, business logic, branding and reporting workflow — or build a tailored analytics solution from scratch.
Like this project
Posted Aug 12, 2026
Built a local-first analytics product that turns CSV files into KPIs, business insights, data-quality checks and traceable reports.