Wind Turbine Performance Analytics
Dheepsaran Vivekananth
Wind Turbine Performance Analytics
End-to-end Power BI and SQL analytics solution for wind turbine SCADA performance monitoring, power curve analysis, underperformance detection, and operational insights.
Project Overview
This project focuses on analyzing wind turbine SCADA (Supervisory Control and Data Acquisition) data using SQL and Power BI to monitor turbine operational performance, power generation efficiency, underperformance trends, and time-based operational behavior.
The solution provides interactive dashboards for executive reporting, power curve monitoring, root cause analysis, and operational performance optimization.
Tools & Technologies Used
Power BI
SQL
DAX
Power Query
Data Modeling
Data Visualization
SCADA Analytics
Key Features
Executive KPI Dashboard
Power Curve Analysis
Underperformance Detection
Time-Based Performance Monitoring
Wind Category Analysis
Root Cause Breakdown
Interactive Slicers and Filters
Operational Trend Analysis
Key KPIs
KPI Description Total Actual Power Total generated turbine power Total Theoretical Power Expected turbine power generation Efficiency % Operational efficiency percentage Power Loss % Total operational power loss Underperformance Count Number of underperforming records Average Wind Speed Average turbine wind speed
Dashboard Pages
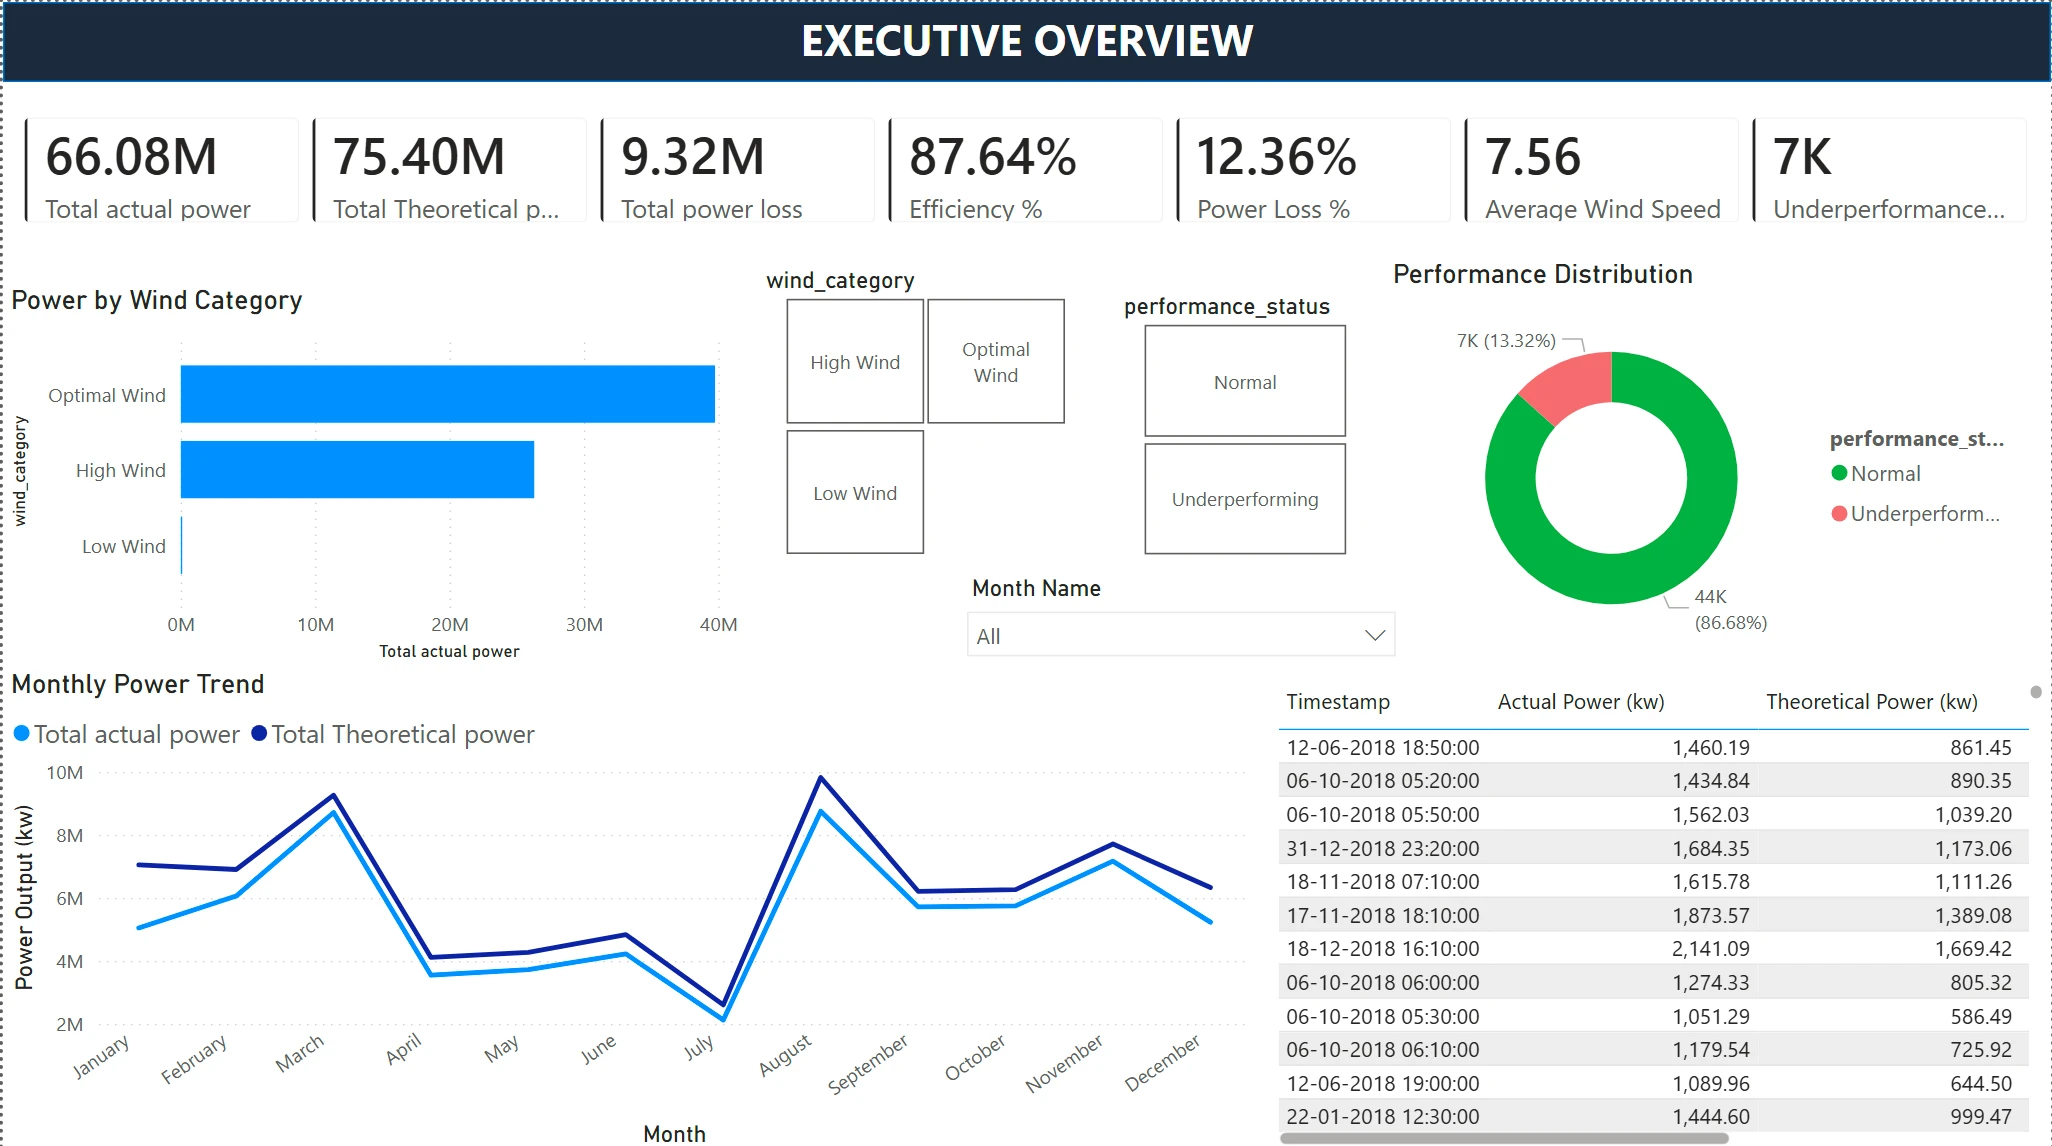
1. Executive Overview
Provides a high-level operational summary of turbine performance including KPIs, monthly power trends, wind category analysis, and performance distribution.
2. Power Curve Analysis
Analyzes actual vs theoretical turbine power curves across wind speed ranges and identifies underperformance behavior.
3. Underperformance Analysis
Tracks operational underperformance trends, hourly breakdowns, and root cause analysis of power loss.
4. Time-Based Performance
Monitors hourly efficiency, monthly efficiency trends, and time-block-based power generation patterns.
SQL Work Included
The project includes SQL scripts for:
Data cleaning
Feature engineering
Performance categorization
Wind speed binning
Time block creation
Power loss analysis
Operational trend analysis
Key transformations performed:
Efficiency calculation
Power loss calculation
Wind category creation
Performance status classification
Monthly and hourly aggregations
Repository Structure
Business Insights
Actual turbine power generation remained below theoretical power generation across multiple periods.
Optimal wind conditions generated the highest operational output.
Underperformance spikes were observed during specific months and operational hours.
Power loss was significantly concentrated during underperforming operational states.
Evening and afternoon operational windows generated higher power output.
Efficiency fluctuations across months indicated operational variability.
Root cause analysis identified wind category and performance status as key contributors to operational losses.
Detailed insights can be found in:
Future Enhancements
Real-time SCADA integration
Predictive maintenance analytics
Machine learning anomaly detection
Turbine-level drill-through analysis
Automated alert systems
Author
Dheepsaran Vivekananth
Like this project
Posted Jun 5, 2026
Developed a Power BI and SQL analytics solution for wind turbine performance monitoring.
Likes
0
Views
0