SaaS Development Replit
Manuel Navarro
Verified
🧪 Project Overview: Chemical Database Automation and Deployment on Replit
🚀 Summary
I designed and built a fully automated chemical database system that scrapes, processes, and publishes chemical data to an online dashboard for a client.
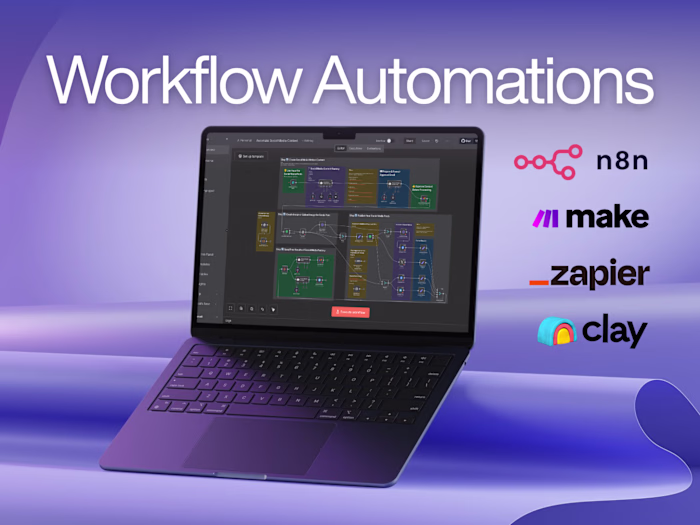
The solution integrates Python-based automation on Replit with n8n (workflow automation) to ensure the database stays up-to-date without manual input.
The entire pipeline — from data collection to production deployment — runs seamlessly in the cloud.
⚙️ Tech Stack
Frontend & Hosting: Replit
Backend: Python (Requests, BeautifulSoup, FastAPI)
Database: PostgreSQL (managed via Replit integration)
Automation / Orchestration: n8n
Deployment: Replit Deployments (Production)
Version Control: Git (via Replit’s built-in integration)
🕵️♂️ Data Collection (Scraping Layer)
I built a custom web scraping pipeline in Python to extract chemical data from several online sources (catalogs and product listings).
The scraper:
Parses pages using BeautifulSoup.
Extracts relevant fields (CAS Number, IUPAC name, molecular weight, hazard statements, etc.).
Cleans and normalizes data before inserting into the database.
Handles pagination, rate limits, and error retries gracefully.
Example snippet (simplified):
🗄️ Database Management
The database layer was built on Replit’s managed PostgreSQL service.
Data from the scraper is pushed using SQLAlchemy or psycopg2, with integrity checks to prevent duplicates.
🔁 Automation with n8n
To make the system self-maintaining, I integrated it with n8n, a workflow automation tool.
n8n handles:
Triggering the scraper daily (via HTTP webhook or schedule).
Calling the Replit API or Replit Agent to start the scraping script.
Post-run notifications (email or Telegram) when the database update completes.
Error recovery, retry logic, and logging to an external dashboard.
Example workflow logic in n8n:
Cron Trigger: runs every 24 hours.
HTTP Node: triggers Replit API endpoint (
/run/scraper).Wait Node: waits for script completion.
Notification Node: sends update summary to the client.
This way, my client’s database is always current, with zero manual involvement.
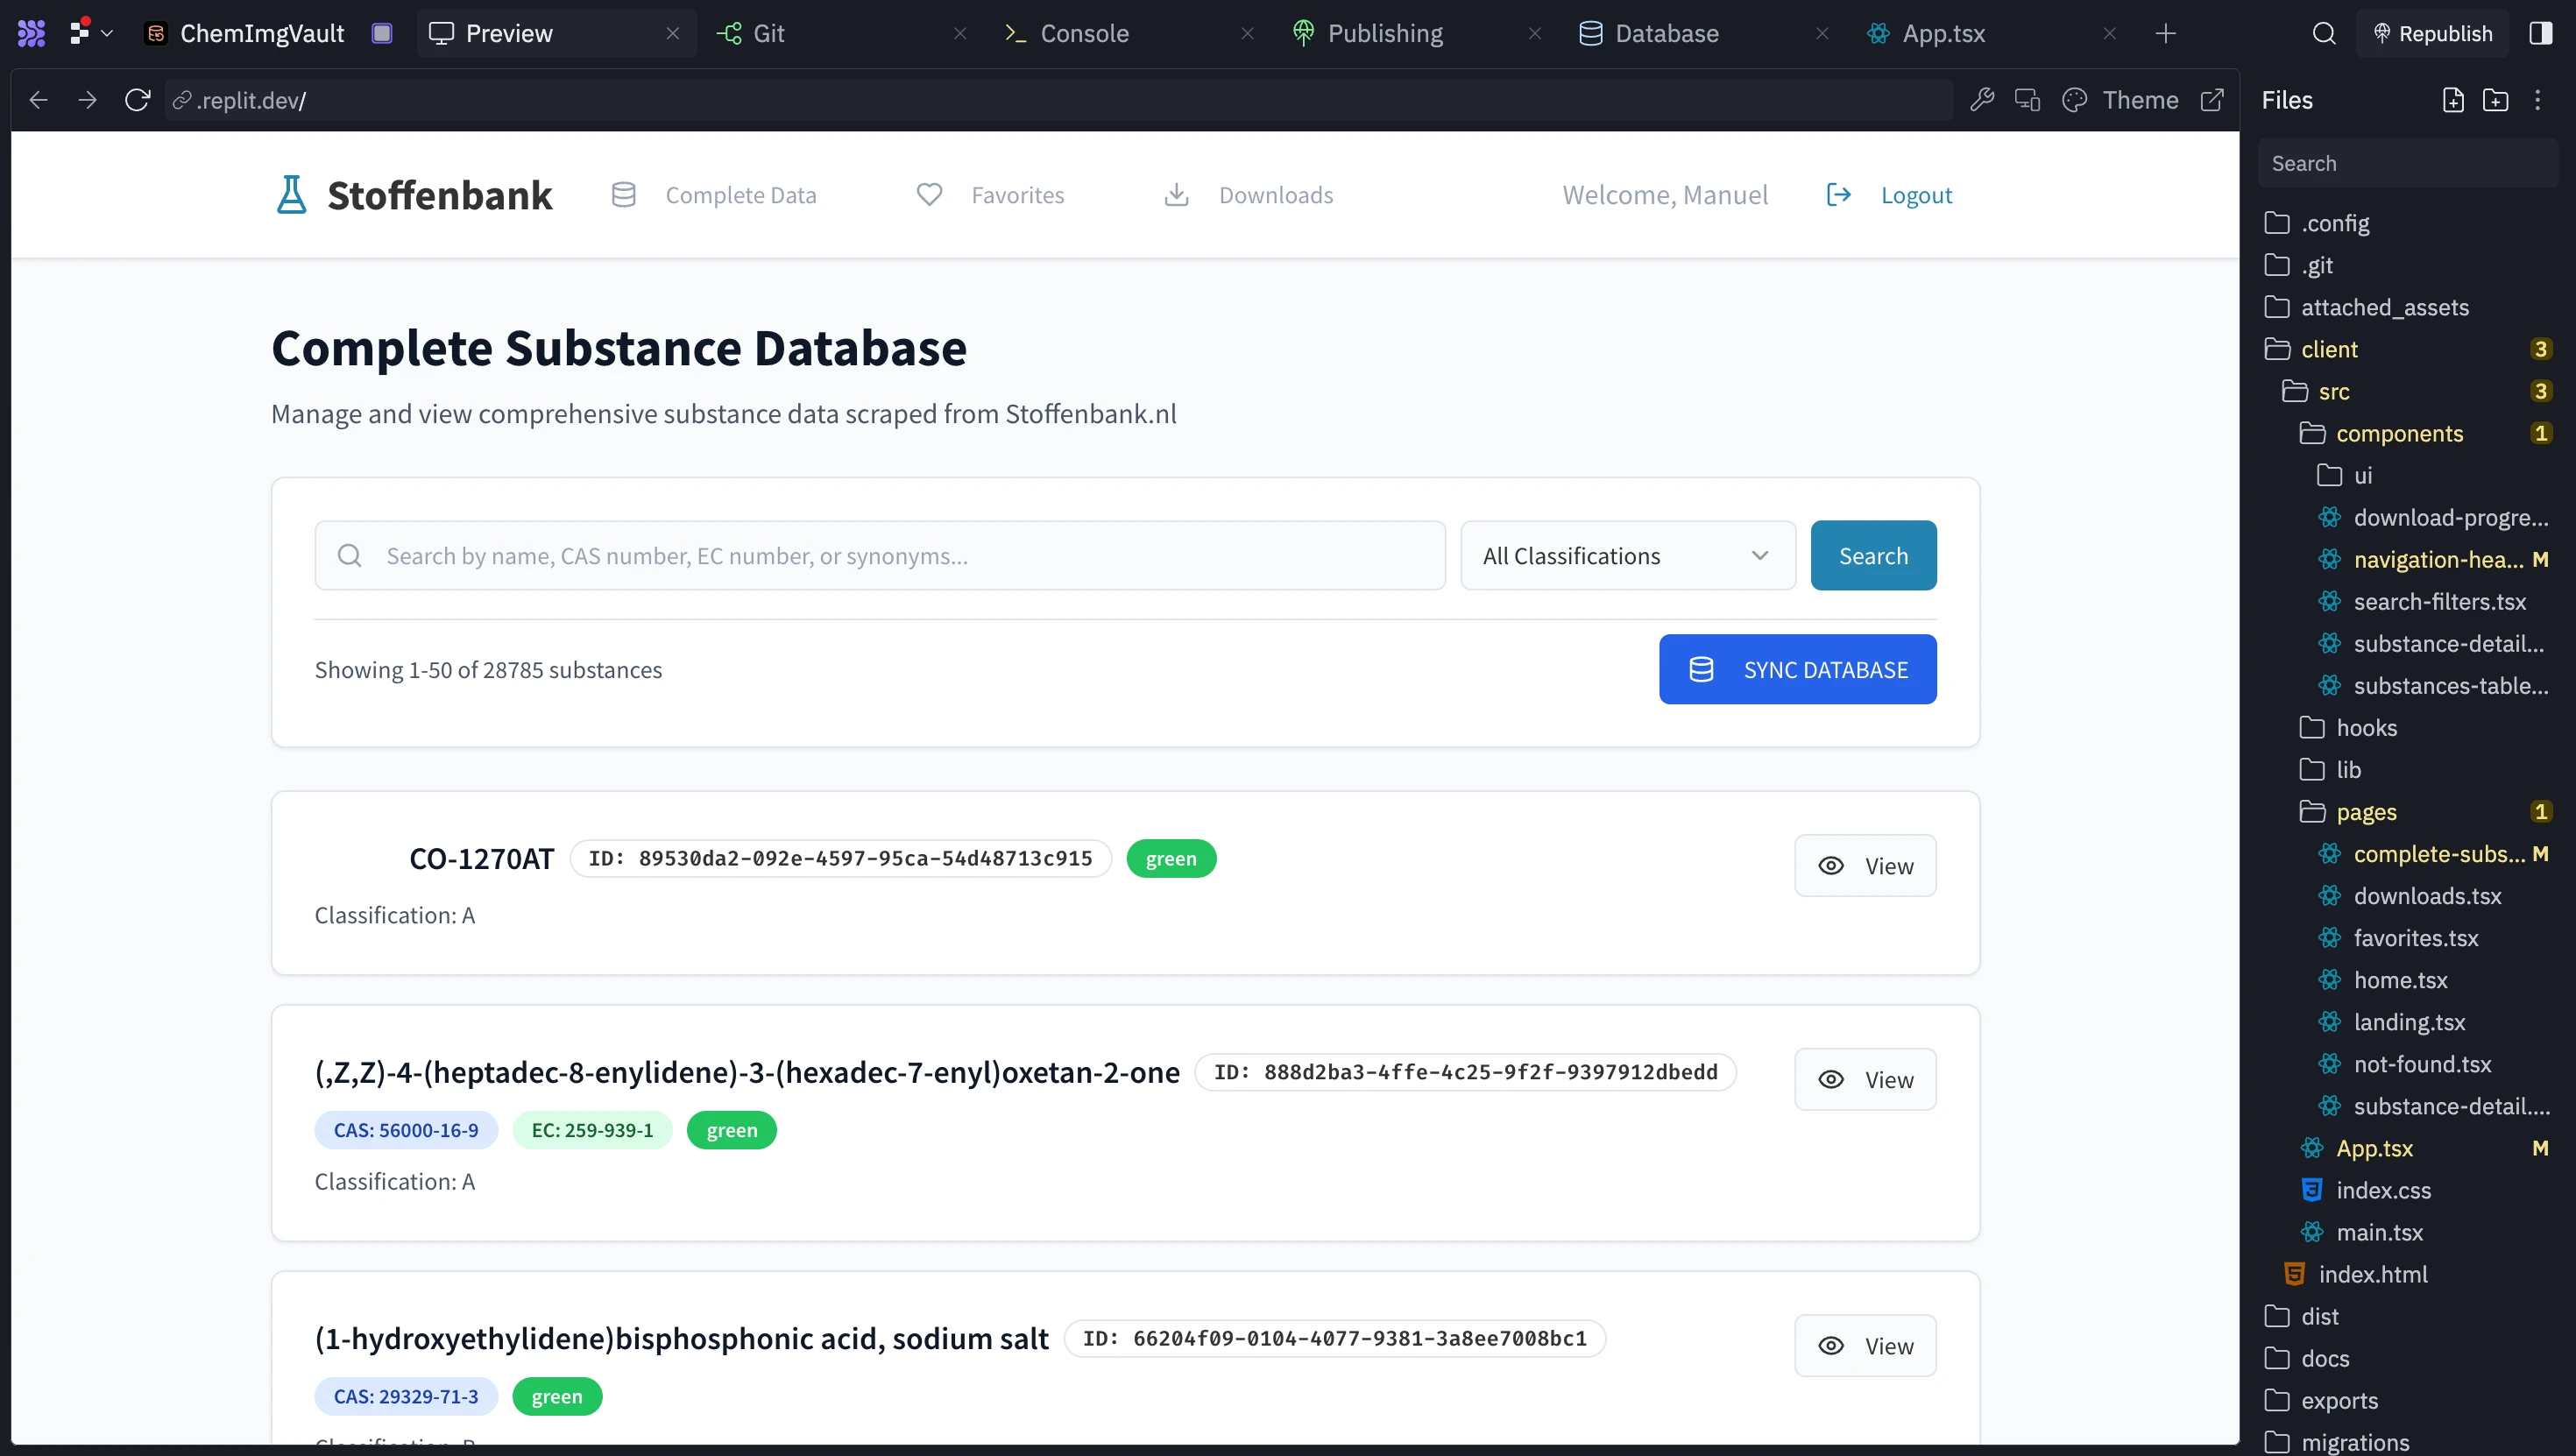
🖥️ Frontend & API
I exposed the chemical database via a FastAPI app, hosted directly on Replit.
Endpoints allow the client to:
Search chemicals by name or CAS number.
Retrieve full chemical details.
Filter by properties (e.g., hazard type, molecular weight).
🧩 Key Features
✅ Automated scraping and database refreshes
✅ Zero manual deployment — fully cloud-hosted
✅ Real-time data access for the client
✅ Lightweight API layer for expansion
✅ Resilient automation with n8n fail-safes
💡 Results
Delivered a stable online chemical database accessible 24/7 to the client.
Reduced manual maintenance time to zero through automation.
Created a scalable base that can integrate with other chemical management tools or APIs later.
Like this project
What the client had to say
Manuel did a great job helping me build an app. He’s friendly, takes the time to truly understand my needs, and combines that with a strong skill set resulting in a seamless, productive collaboration. I look forward to continuing our work.
rene geluk, Geluk Consultancy
Oct 16, 2025, Client
Posted Nov 20, 2024
I designed an innovative data scraper project that transformed intricate data into easy-to-understand visuals, ensuring clarity for all stakeholders.
Likes
12
Views
553
Timeline
Oct 7, 2025 - Oct 16, 2025
Clients
Geluk Consultancy