Sales Dashboard Web App

Manuel Navarro
Verified


🔧 Key Tools Used
Python (pandas, NumPy): Data cleaning, transformation, and backend analytics logic
FastAPI: Lightweight and efficient backend API for data serving
React + Chart.js / Recharts: Frontend framework and libraries for dynamic, interactive charts
Tailwind CSS: Clean, responsive, and scalable UI design
PostgreSQL: Structured data storage and fast querying
Figma: Interface planning and design system prototyping
🧩 Project Overview
This project involved building a custom web-based sales dashboard for Future Global Data, designed to help stakeholders track performance metrics and uncover sales trends across multiple dimensions — including product categories, client segments, and store locations. Unlike traditional BI tools, this solution was fully browser-based, mobile-responsive, and tailored to the company’s specific data structure and branding.
The goal was to create an engaging, real-time sales monitoring tool that was both data-rich and user-friendly, giving executives and sales managers the ability to make quick, informed decisions backed by up-to-date insights.
🔍 The Process
1. Data Preparation
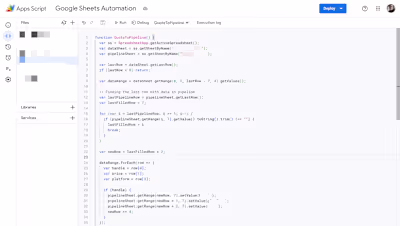
The workflow began with extensive data cleaning in Python using pandas and NumPy. The raw data included thousands of sales records, each with inconsistencies in product naming, missing values, and duplicated entries. I standardized fields such as product names, client categories, and store identifiers to ensure consistency across the board. Date formats were unified to support accurate time-series analysis, and outliers were flagged and investigated to prevent misinterpretation.
2. Backend & Analytics Logic
Once cleaned, the dataset was stored in a PostgreSQL database and accessed via FastAPI, which served as a lightweight backend for querying metrics and trend data on demand. I built multiple API endpoints for different dashboard modules (e.g., profit summaries, product breakdowns, client segmentation), ensuring each returned performant, filtered results even as new data was added over time.
Analytical logic was built directly into the backend layer, such as:
Calculating profit margins and growth trends
Segmenting sales by client type (individual, company, distributor, government)
Comparing regional performance across cities (Madrid, Barcelona, London)
Computing year-over-year comparisons to highlight seasonal growth peaks (notably in May and November)
3. Frontend & Visualizations
The frontend was built in React, using Chart.js and Recharts for data visualizations, including:
A KPI panel displaying total profit (€77.3M), profit margin (24.89%), and total products sold (30K)
A bar chart highlighting top-performing products — with Samsung Galaxy A54 and iPhone 15 leading
Pie charts visualizing sales distribution by client type and geographic location
A line graph showing monthly sales over two years for year-over-year performance comparisons
The UI was styled with Tailwind CSS for a clean, modern look, and optimized for desktop and tablet viewing. Navigation was kept minimal with collapsible sidebars and tooltips to enhance data readability.
🧠 Design Philosophy
Throughout the project, the focus was on building a dashboard that didn’t just show data — it told a story. The use of subtle transitions, color-coded categories, and consistent layout principles ensured that even complex data was easy to interpret.
By merging backend automation, frontend interactivity, and data design best practices, I delivered a sales tool that wasn’t just functional, but also felt intuitive and engaging.
🏁 Final Outcome
This project was a full-cycle implementation — from raw CSVs and inconsistent records to a live, interactive dashboard that could scale with Future Global Data’s sales growth. It allowed me to demonstrate both data engineering expertise and frontend visualization skills, bridging the gap between backend logic and actionable business intelligence.
With this web app, the client can now:
Monitor live sales activity across products and regions
Quickly detect growth trends and performance dips
Empower non-technical stakeholders to explore insights visually
Make faster, smarter business decisions with confidence
Like this project
Posted Nov 20, 2024
I designed an innovative data visualization project that transformed intricate data into easy-to-understand visuals, ensuring clarity for all stakeholders.
Likes
3
Views
171
Timeline
May 30, 2025 - Jun 30, 2025
Clients
Fairfax Partners Inc.


Google Sheets Migration and Visualization
AI Chatbot for E-Commerce
Framer Website Development for Portfolio
BigQuery Database Creation and Automation