Project Overview Dashboard
Caio Bauab
Data Analysis: Project Overview Dashboard
Interactive dashboard (Novy portfolio link)
Loading this content connects you to project.novypro.com.
project.novypro.com privacy informationProject description
The goal of this project was to create a Project Overview Dashboard to help the client manage their workforce, monitor project health, and understand financial risks. The dashboard was designed to provide insights into which projects and departments were at risk of being over budget or underperforming, enabling stakeholders to take corrective actions.
Email requests
Dear Data Analyst,
Your expertise is needed in organizing the data and developing the dashboard will be key to helping us manage our workforce, understand financial risks, and monitor project health more effectively. We are looking to answer the following key question: Which projects and departments are at risk of being over budget or underperforming? Note that department budgets are set at 2-year intervals. We want to know if a year can cover all expenses
1. Identify Departments and Projects in the red: Understand which departments or projects are over budget or underperforming, so we can take corrective action.
2. Data Organization: Ensure that data from various sources (e.g., employee information, salary data, department budgets, and project details) is structured correctly and accessible for reporting.
3. Power BI Dashboard Development: Collaborate with us to create a comprehensive dashboard that provides visibility into employee performance, salary distribution, and departmental project management.
Manager.
Data Analysis Workflow
1. Build a Database
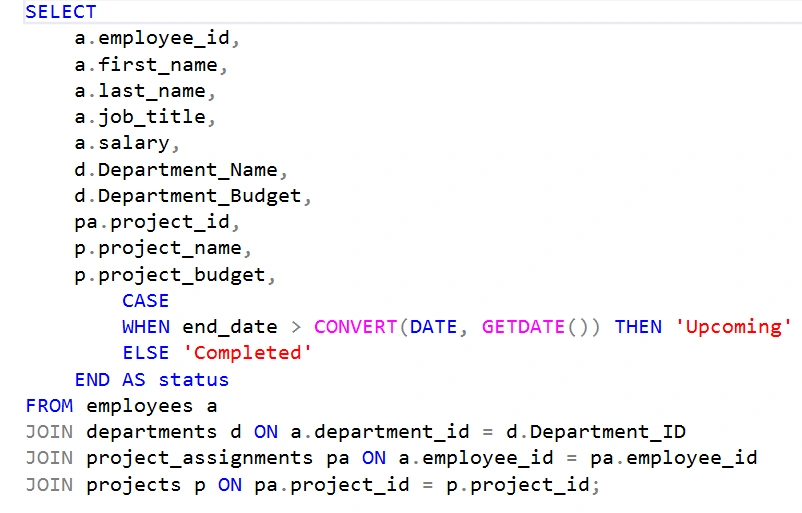
2. Develop SQL Queries
3. Connect Power BI to DB
4. Build a Dashboard in Power BI
SQL query
Key Results
At-Risk Projects and Departments: The dashboard successfully identified projects and departments that were over budget or underperforming, allowing stakeholders to take corrective actions. For example, it highlighted departments where the annual budget was insufficient to cover expenses within the 2-year cycle.
Budget Utilization: The dashboard provided a clear view of budget utilization across departments, helping the client understand where funds were being over or underutilized.
Employee Performance: Insights into employee performance and salary distribution were visualized, enabling the client to optimize workforce allocation and address any discrepancies.
Project Health Monitoring: The dashboard allowed stakeholders to monitor the overall health of projects, including timelines, resource allocation, and financial performance.
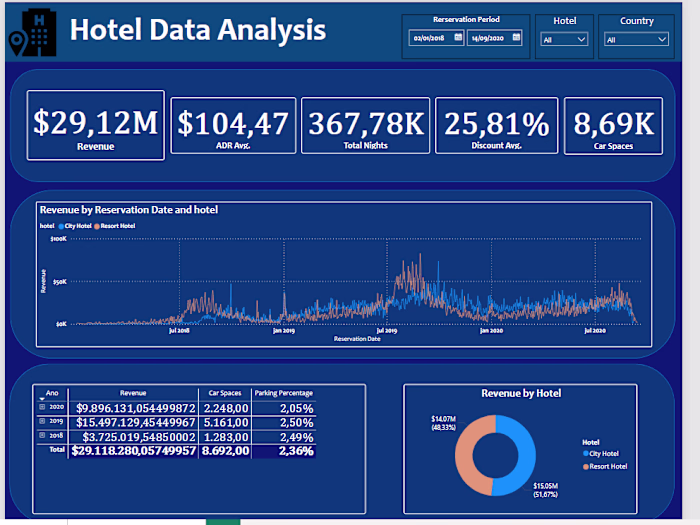
Dashboard Overview
At-Risk Projects: A section of the dashboard highlighted projects that were over budget or underperforming, color-coded for easy identification
Department Budgets: The dashboard displayed budget utilization by department, showing whether the annual budget was sufficient to cover expenses within the 2-year cycle.
Employee Performance: Metrics related to employee performance and salary distribution were visualized, helping the client optimize workforce management.
Interactive Filters: Users could filter data by department, project, or time period to focus on specific areas of interest.
Conclusion
The Project Overview Dashboard provided the client with a powerful tool to monitor project health, manage budgets, and optimize workforce allocation. By identifying at-risk projects and departments, the dashboard enabled stakeholders to take timely corrective actions, ensuring better financial control and project management. The interactive and visually intuitive design of the dashboard made it easy for stakeholders to access and interpret key insights, improving overall decision-making.
Like this project
Posted Mar 10, 2025
The goal of this project was to create a Dashboard to help the client manage their workforce, monitor project health, and understand financial risks.