Toman's Bike Share Dashboard
Caio Bauab
Data analysis project: Toman's Bike Share Dashboard
Interactive dashboard (Novy portfolio link)
Loading this content connects you to project.novypro.com.
project.novypro.com privacy informationProject description
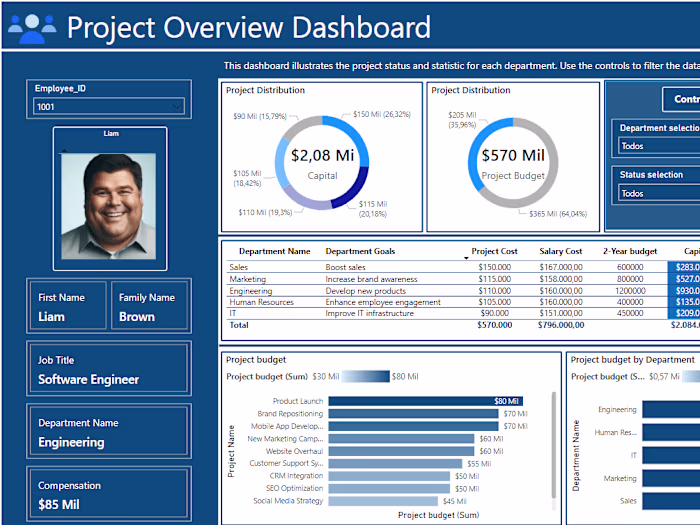
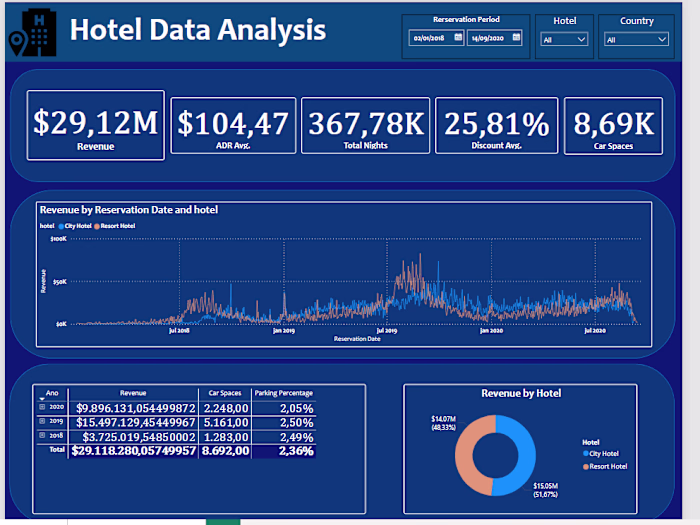
The project included developing an interactive Power BI dashboard for Toman's Bike Share for analyzing the operational and financial performance of the bike-sharing service. It was meant for strategy decisions and calculated revenue, profit, seasonal trends, rider demographics and other vital information.
Email requests
Request for development of Toman Bike Share dashboard:
Dear Data Analyst,
We need your expertise to develop a dashboard for “Toman Bike Share” that displays our key performance metrics for informed decision-making.
Requirements:
● Hourly Revenue Analysis
● Profit and Revenue trends
● Seasonal Revenue
● Rider Demographics
Design and Aesthetics: Use our company colors and ensure the dashboard is easy to navigate.
Data Source: Access to our databases will be provided. If no database, please create one.
Deadline: We need a preliminary version ASAP.
Please provide an estimated timeline for completion and recommendation on raising prices next year Best regards.
Data Analysis Workflow
1. Create a Database
2. Develop SQL Queries
3. Connect Power BI to DB
4. Build a Dashboard in Power BI
5. Answer the Analysis questions
Recommendation (Key results)
Conservative Increase: Considering the substantial increase last year, a more conservative increase might be prudent to avoid hitting a price ceiling where demand starts to drop. An increase in the range of 10-15% could test the market’s response without risking a significant loss of customers.
Price Setting:
● If the price in 2022 was $4.99, a 10% increase would make the new price about $5.49.
● A 15% increase would set the price at approximately $5.74.
Recommended Strategy:
Market Analysis: Conduct further market research to understand customer satisfaction, potential competitive changes, and the overall economic environment. This can guide whether learning towards the lower or higher end of suggested increase.
Segmented Pricing Strategy: Consider different pricing for casual versus registered users, as they may have different price sensitivities.
Monitor and Adjust: Implement the new prices but be ready to adjust based on immediate customer feedback and
Like this project
Posted Mar 10, 2025
The project included developing an interactive dashboard for Toman's Bike Share for analyzing the operational and financial performance of bike-sharing service.
Likes
0
Views
10