Customer Churn Analysis for Databel
Johyandi Lukmana
Introduction
In this case study, I analyze customer churn for Databel, a hypothetical telecom company, using two approaches: Excel and SQL. The goal is to understand why nearly 27% of customers are leaving and provide data-backed recommendations to improve retention. This case study highlights both spreadsheet-based and code-based workflows, showing versatility in data analysis and problem-solving.
Excel Analysis Process
Data Preparation
• Datasets: Databel - Customer (6,688 rows), Databel - Aggregate (6,670 rows)
• Converted raw data into Excel tables.
• Checked for duplicate rows using Remove Duplicates and Conditional Formatting (none found).
• Created a helper column Churned using IF formula to convert 'Yes'/'No' into 1/0.
Exploratory Analysis
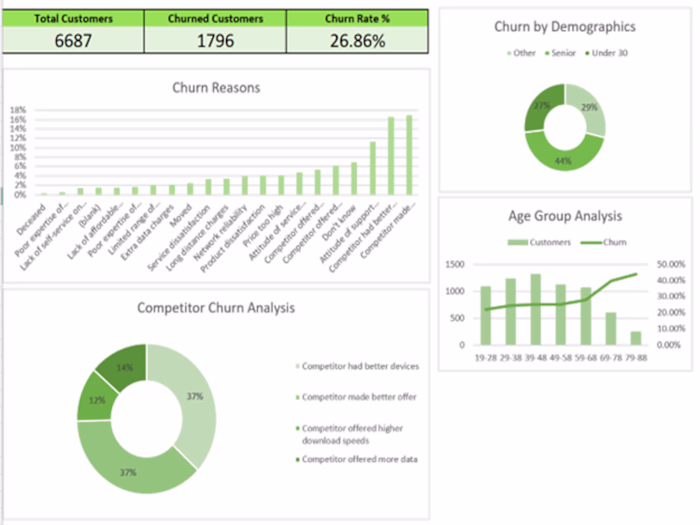
• Built PivotTables to calculate total customers, churned customers, and churn rate (26.86%).
• Analyzed churn by reason, category, and demographic factors (age, contract type, plan type).
• Created grouped fields like Demographics (Under 30, Senior, Other) and Grouped Consumption (GB ranges).
Visualization
• Developed 2D bar charts, line + column combo charts, and stacked bar charts.
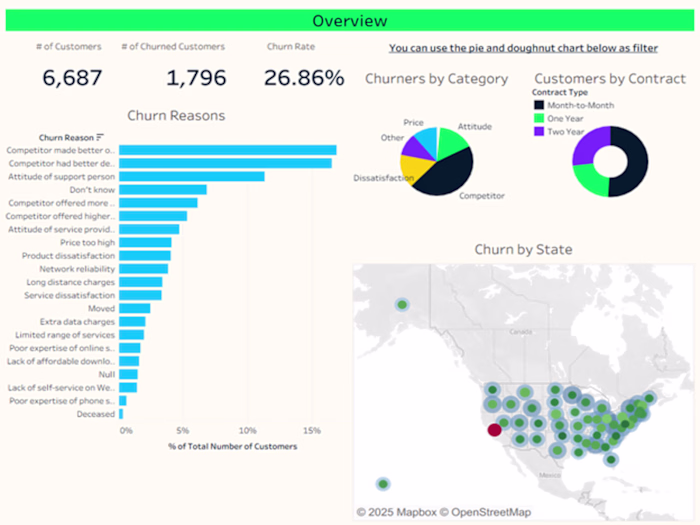
• Created an overview dashboard summarizing key KPIs and insights.
Key Insights
• Top churn driver: Competitor offers.
• At-risk group: Senior customers (~40% churn rate).
• Unlimited plan paradox: Higher churn among unlimited plan users.
• Contract effect: One-year contracts showed higher churn after 3–4 years.
SQL Analysis Process
Why SQL?
SQL offers scalable, repeatable, and automatable analysis, ideal for larger datasets or integrating with BI tools. It also allows more flexible querying and joining of customer + aggregate data.
Data Setup
• Imported Excel data into SQL tables (Customers).
• Created helper columns:
o Churned: 1 if Churn Label = 'Yes', else 0.
o Demographics: Under 30, Senior, Other (based on Age).
Core Analysis Queries
• Overall churn rate: Total customers, churned customers, churn %.
• Churn by reason: % of total churn per Churn Reason.
• Churn by demographics: Churn rate across age groups.
• Unlimited plan & usage: Churn by data plan and grouped GB consumption.
• Contract type & account length: Churn trends by contract and tenure (12-month bins).
• State & international plan: Churn matrix by location and international activity.
Example Query Snippet
SELECT Contract_Type,
FLOOR(Account_Length / 12) * 12 AS Account_Length_Group,
COUNT(*) AS Total_Customers,
SUM(Churned) AS Churned_Customers,
ROUND(SUM(Churned) * 100.0 / COUNT(*), 2) AS Churn_Rate_Percent
FROM Customers
GROUP BY Contract_Type, FLOOR(Account_Length / 12) * 12
ORDER BY Contract_Type, Account_Length_Group;
Insights (SQL Confirmation)
The SQL results aligned with the Excel insights, confirming key churn drivers and adding flexibility to analyze complex joins or filters (e.g., cross-tabulating international plan users by state).
Appendix
The full SQL script (103+ lines) is available as a separate file or appendix, containing table creation, helper columns, and all analysis queries.
Recommendations
Offer competitive deals to counter competitor-driven churn.
Develop senior-focused loyalty programs.
Investigate why unlimited plan users churn more—price, service, or expectations?
Encourage two-year contracts for long-term retention.
Skills Demonstrated
• Data cleaning & preparation (Excel, SQL)
• Query writing and analysis (SQL)
• PivotTables and calculated fields (Excel)
• Data visualization and dashboarding (Excel)
• Business insight generation
• Storytelling through data
Final Thoughts
This combined Excel + SQL case study demonstrates my ability to perform end-to-end data analysis, validate findings across tools, and deliver actionable business recommendations. It’s a strong example of practical, versatile analytics work for any data-driven team or client.
Appendix SQL Script for Databel Churn Analysis
Create Customers Table
CREATE TABLE Customers (
Customer_ID VARCHAR(20),
Churn_Label VARCHAR(10),
Account_Length INT,
Local_Calls INT,
Local_Mins FLOAT,
Intl_Calls FLOAT,
Intl_Mins FLOAT,
Intl_Active VARCHAR(10),
Intl_Plan VARCHAR(10),
Extra_International_Charges FLOAT,
Customer_Service_Calls INT,
Avg_Monthly_GB_Download FLOAT,
Unlimited_Data_Plan VARCHAR(10),
Extra_Data_Charges FLOAT,
State VARCHAR(5),
Phone_Number VARCHAR(20),
Gender VARCHAR(10),
Age INT,
Under_30 VARCHAR(5),
Senior VARCHAR(5),
Group_Field VARCHAR(20),
Num_Customers_in_Group INT,
Device_Protection VARCHAR(10),
Contract_Type VARCHAR(20),
Payment_Method VARCHAR(20),
Monthly_Charge FLOAT,
Total_Charges FLOAT,
Churn_Category VARCHAR(50),
Churn_Reason VARCHAR(100)
Add Churned Flag
ALTER TABLE Customers ADD COLUMN Churned INT;
UPDATE Customers SET Churned = CASE WHEN Churn_Label = 'Yes' THEN 1 ELSE 0 END;
Add Demographics Bucket
ALTER TABLE Customers ADD COLUMN Demographics VARCHAR(20);
UPDATE Customers SET Demographics =
CASE WHEN Age < 30 THEN 'Under 30'
WHEN Age >= 60 THEN 'Senior'
ELSE 'Other' END;
Overall Churn Rate
SELECT COUNT(*) AS Total_Customers,
SUM(Churned) AS Churned_Customers,
ROUND(AVG(Churned) * 100, 2) AS Churn_Rate_Percent
FROM Customers;
Churn by Reason
SELECT Churn_Reason,
COUNT(*) AS Churned_Customers,
ROUND(COUNT(*) * 100.0 / SUM(COUNT(*)) OVER (), 2) AS Percent_of_Total
FROM Customers
WHERE Churned = 1
GROUP BY Churn_Reason
ORDER BY Percent_of_Total DESC;
Churn by Demographics
SELECT Demographics,
COUNT(*) AS Total_Customers,
SUM(Churned) AS Churned_Customers,
ROUND(SUM(Churned) * 100.0 / COUNT(*), 2) AS Churn_Rate_Percent
FROM Customers
GROUP BY Demographics;
Churn by Unlimited Data Plan & Consumption
SELECT Unlimited_Data_Plan,
CASE
WHEN Avg_Monthly_GB_Download < 5 THEN 'Less than 5 GB'
WHEN Avg_Monthly_GB_Download BETWEEN 5 AND 10 THEN '5-10 GB'
ELSE '10+ GB' END AS Grouped_Consumption,
COUNT(*) AS Total_Customers,
SUM(Churned) AS Churned_Customers,
ROUND(SUM(Churned) * 100.0 / COUNT(*), 2) AS Churn_Rate_Percent
FROM Customers
GROUP BY Unlimited_Data_Plan, Grouped_Consumption;
Churn by Contract & Account Length (12-month bins)
SELECT Contract_Type,
FLOOR(Account_Length / 12) * 12 AS Account_Length_Group,
COUNT(*) AS Total_Customers,
SUM(Churned) AS Churned_Customers,
ROUND(SUM(Churned) * 100.0 / COUNT(*), 2) AS Churn_Rate_Percent
FROM Customers
GROUP BY Contract_Type, FLOOR(Account_Length / 12) * 12
ORDER BY Contract_Type, Account_Length_Group;
Churn by State & Intl Plan
SELECT State,
Intl_Plan,
COUNT(*) AS Total_Customers,
SUM(Churned) AS Churned_Customers,
ROUND(SUM(Churned) * 100.0 / COUNT(*), 2) AS Churn_Rate_Percent
FROM Customers
GROUP BY State, Intl_Plan
ORDER BY State, Intl_Plan;
Like this project
Posted Jul 16, 2025
Analyzed customer churn for Databel using Excel and SQL.
Likes
0
Views
0