Marketplace Data Visualization
Mohamad Salem
Overview
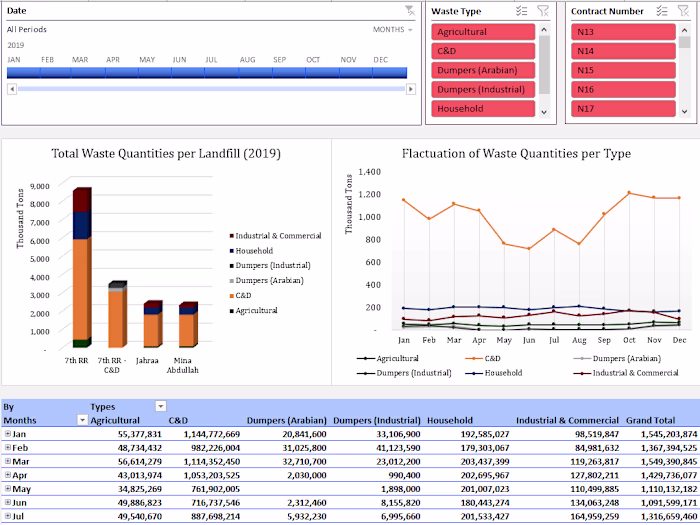
Created an Interactive Dashboard: Developed a data analytics dashboard in Excel for visualizing company sales data specific to Bangladesh.
Utilized PivotTables and Data Models: Leveraged Excel's PivotTable functionality and data modeling capabilities to efficiently aggregate, analyze, and present sales data. This likely involved creating insightful charts and graphs to represent trends and patterns.
Enhanced Sales Insights: Provided stakeholders with a comprehensive and interactive tool to gain deeper insights into sales performance, potentially enabling data-driven decision making.

Like this project
Posted Mar 18, 2024
Developed data analytics dashboard for company's marketplace sales in Bangladesh.
Likes
0
Views
6