Infographics Design for Strategic Briefing at NCC
Joshua McDonald
I was commissioned by New City College London to design a suite of infographics for a strategic intent briefing aimed at senior leadership and institutional stakeholders.
Working with complex data; including demographic forecasts, student segmentation, and employment sector trends, I built a coherent visual language that distilled key information into clear, accessible graphics. I also developed a visual timeline and map of NCC’s college mergers (1990–2024) to contextualise historical growth.
The project balanced visual clarity with technical accuracy and demonstrated my ability to translate policy-heavy content into visually engaging, strategically useful outputs.
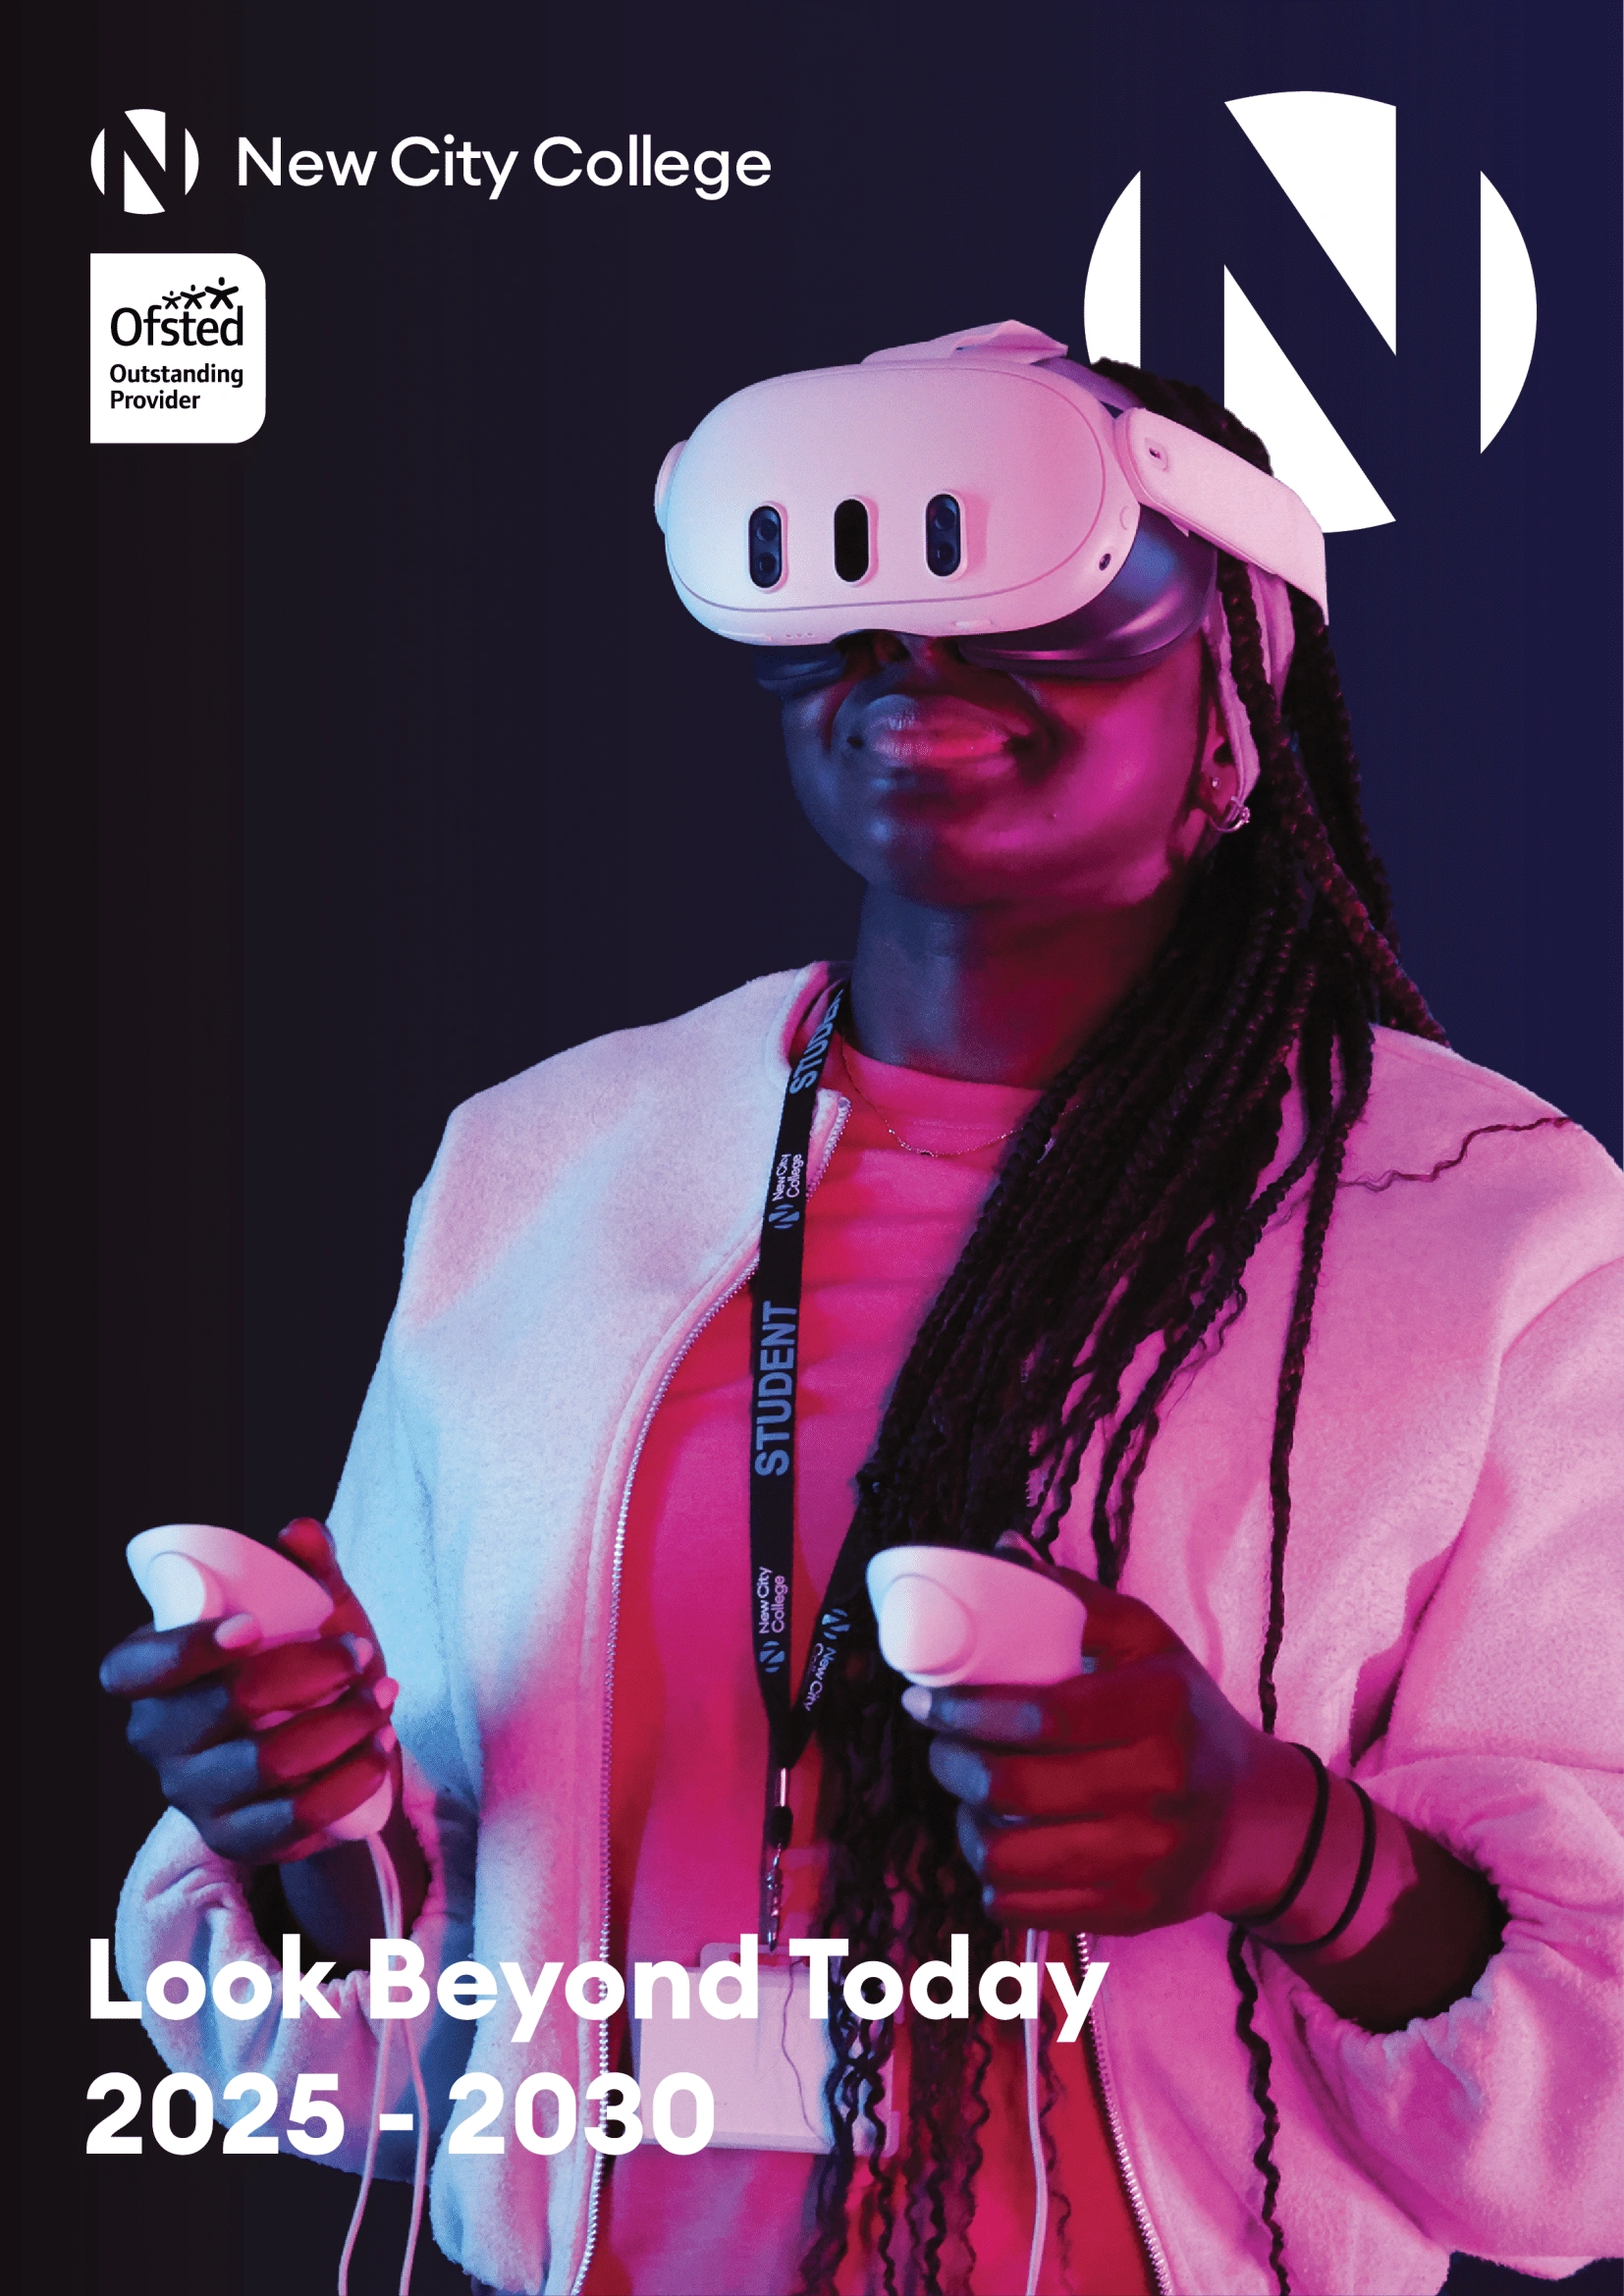
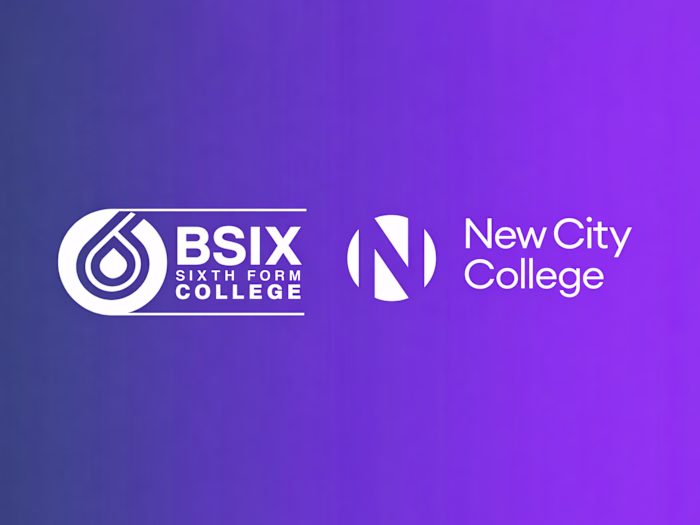
Front Cover Design, Icons Made, Adjusted Typefaces to Align with NCC's Branding
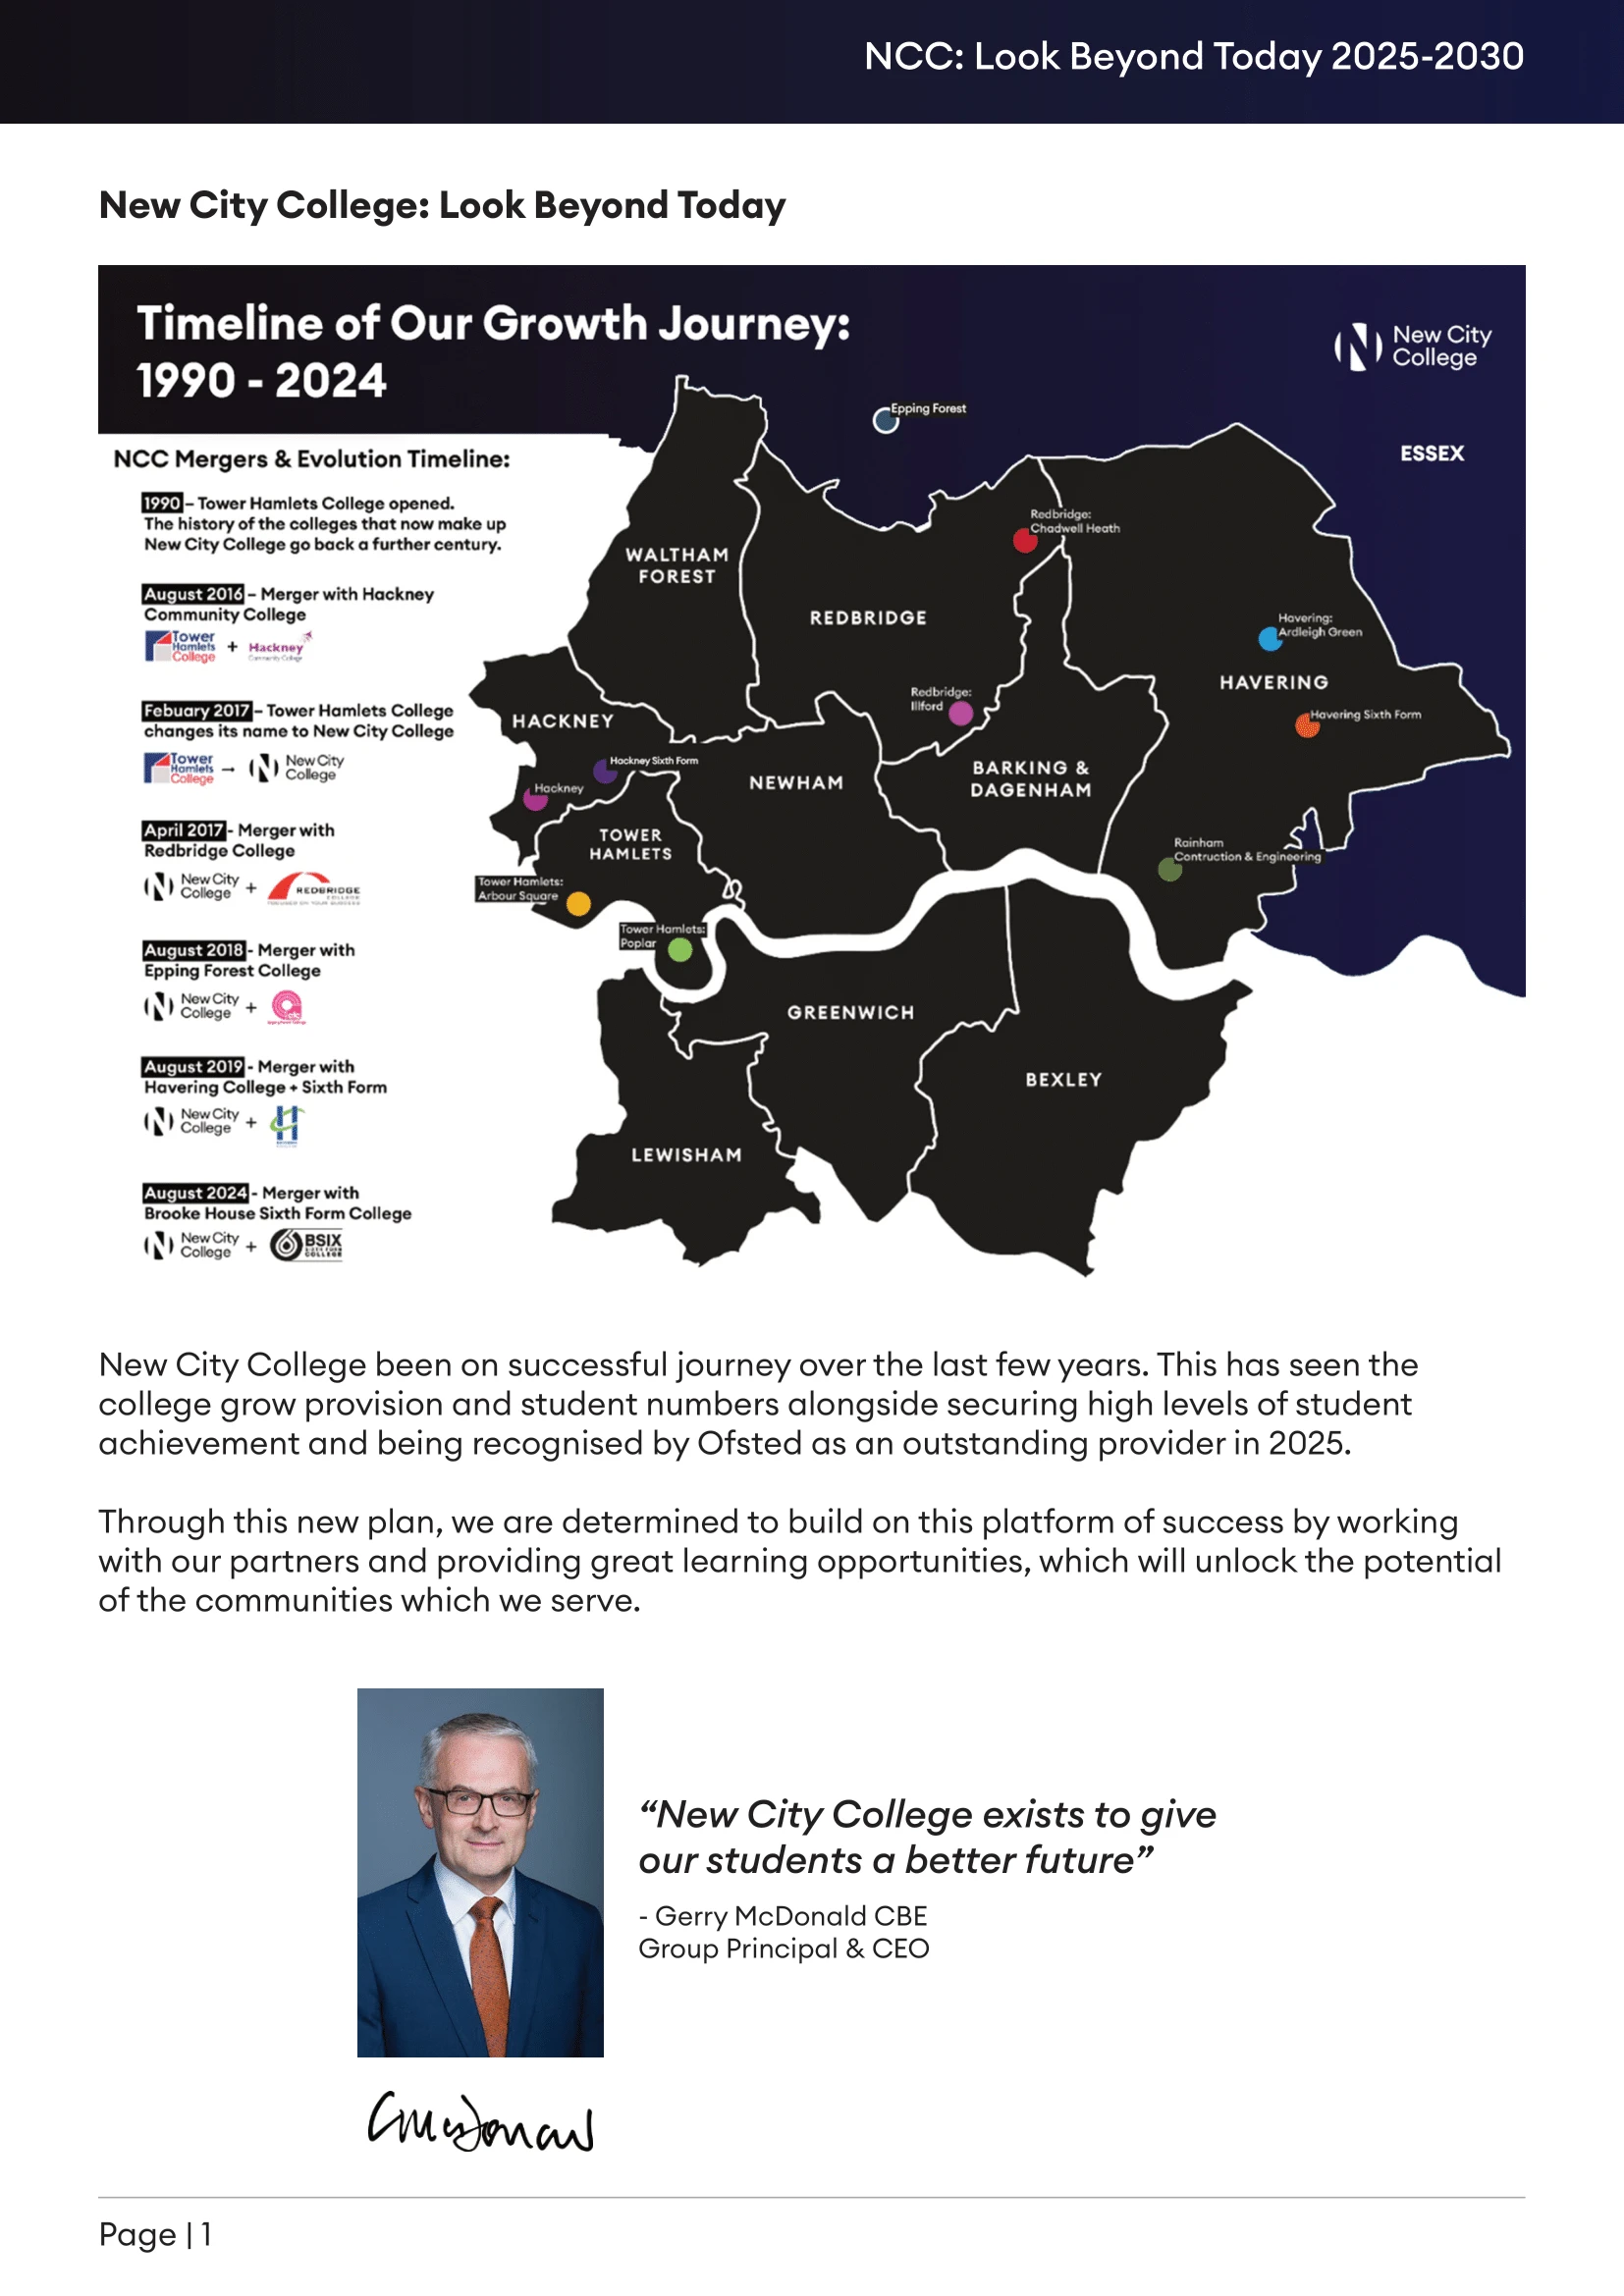
Map I Created, Showing the Timeline of All NCC Mergers Across London, Adjusted Typefaces to Align with NCC's Branding. Copy was Provided by NCC.
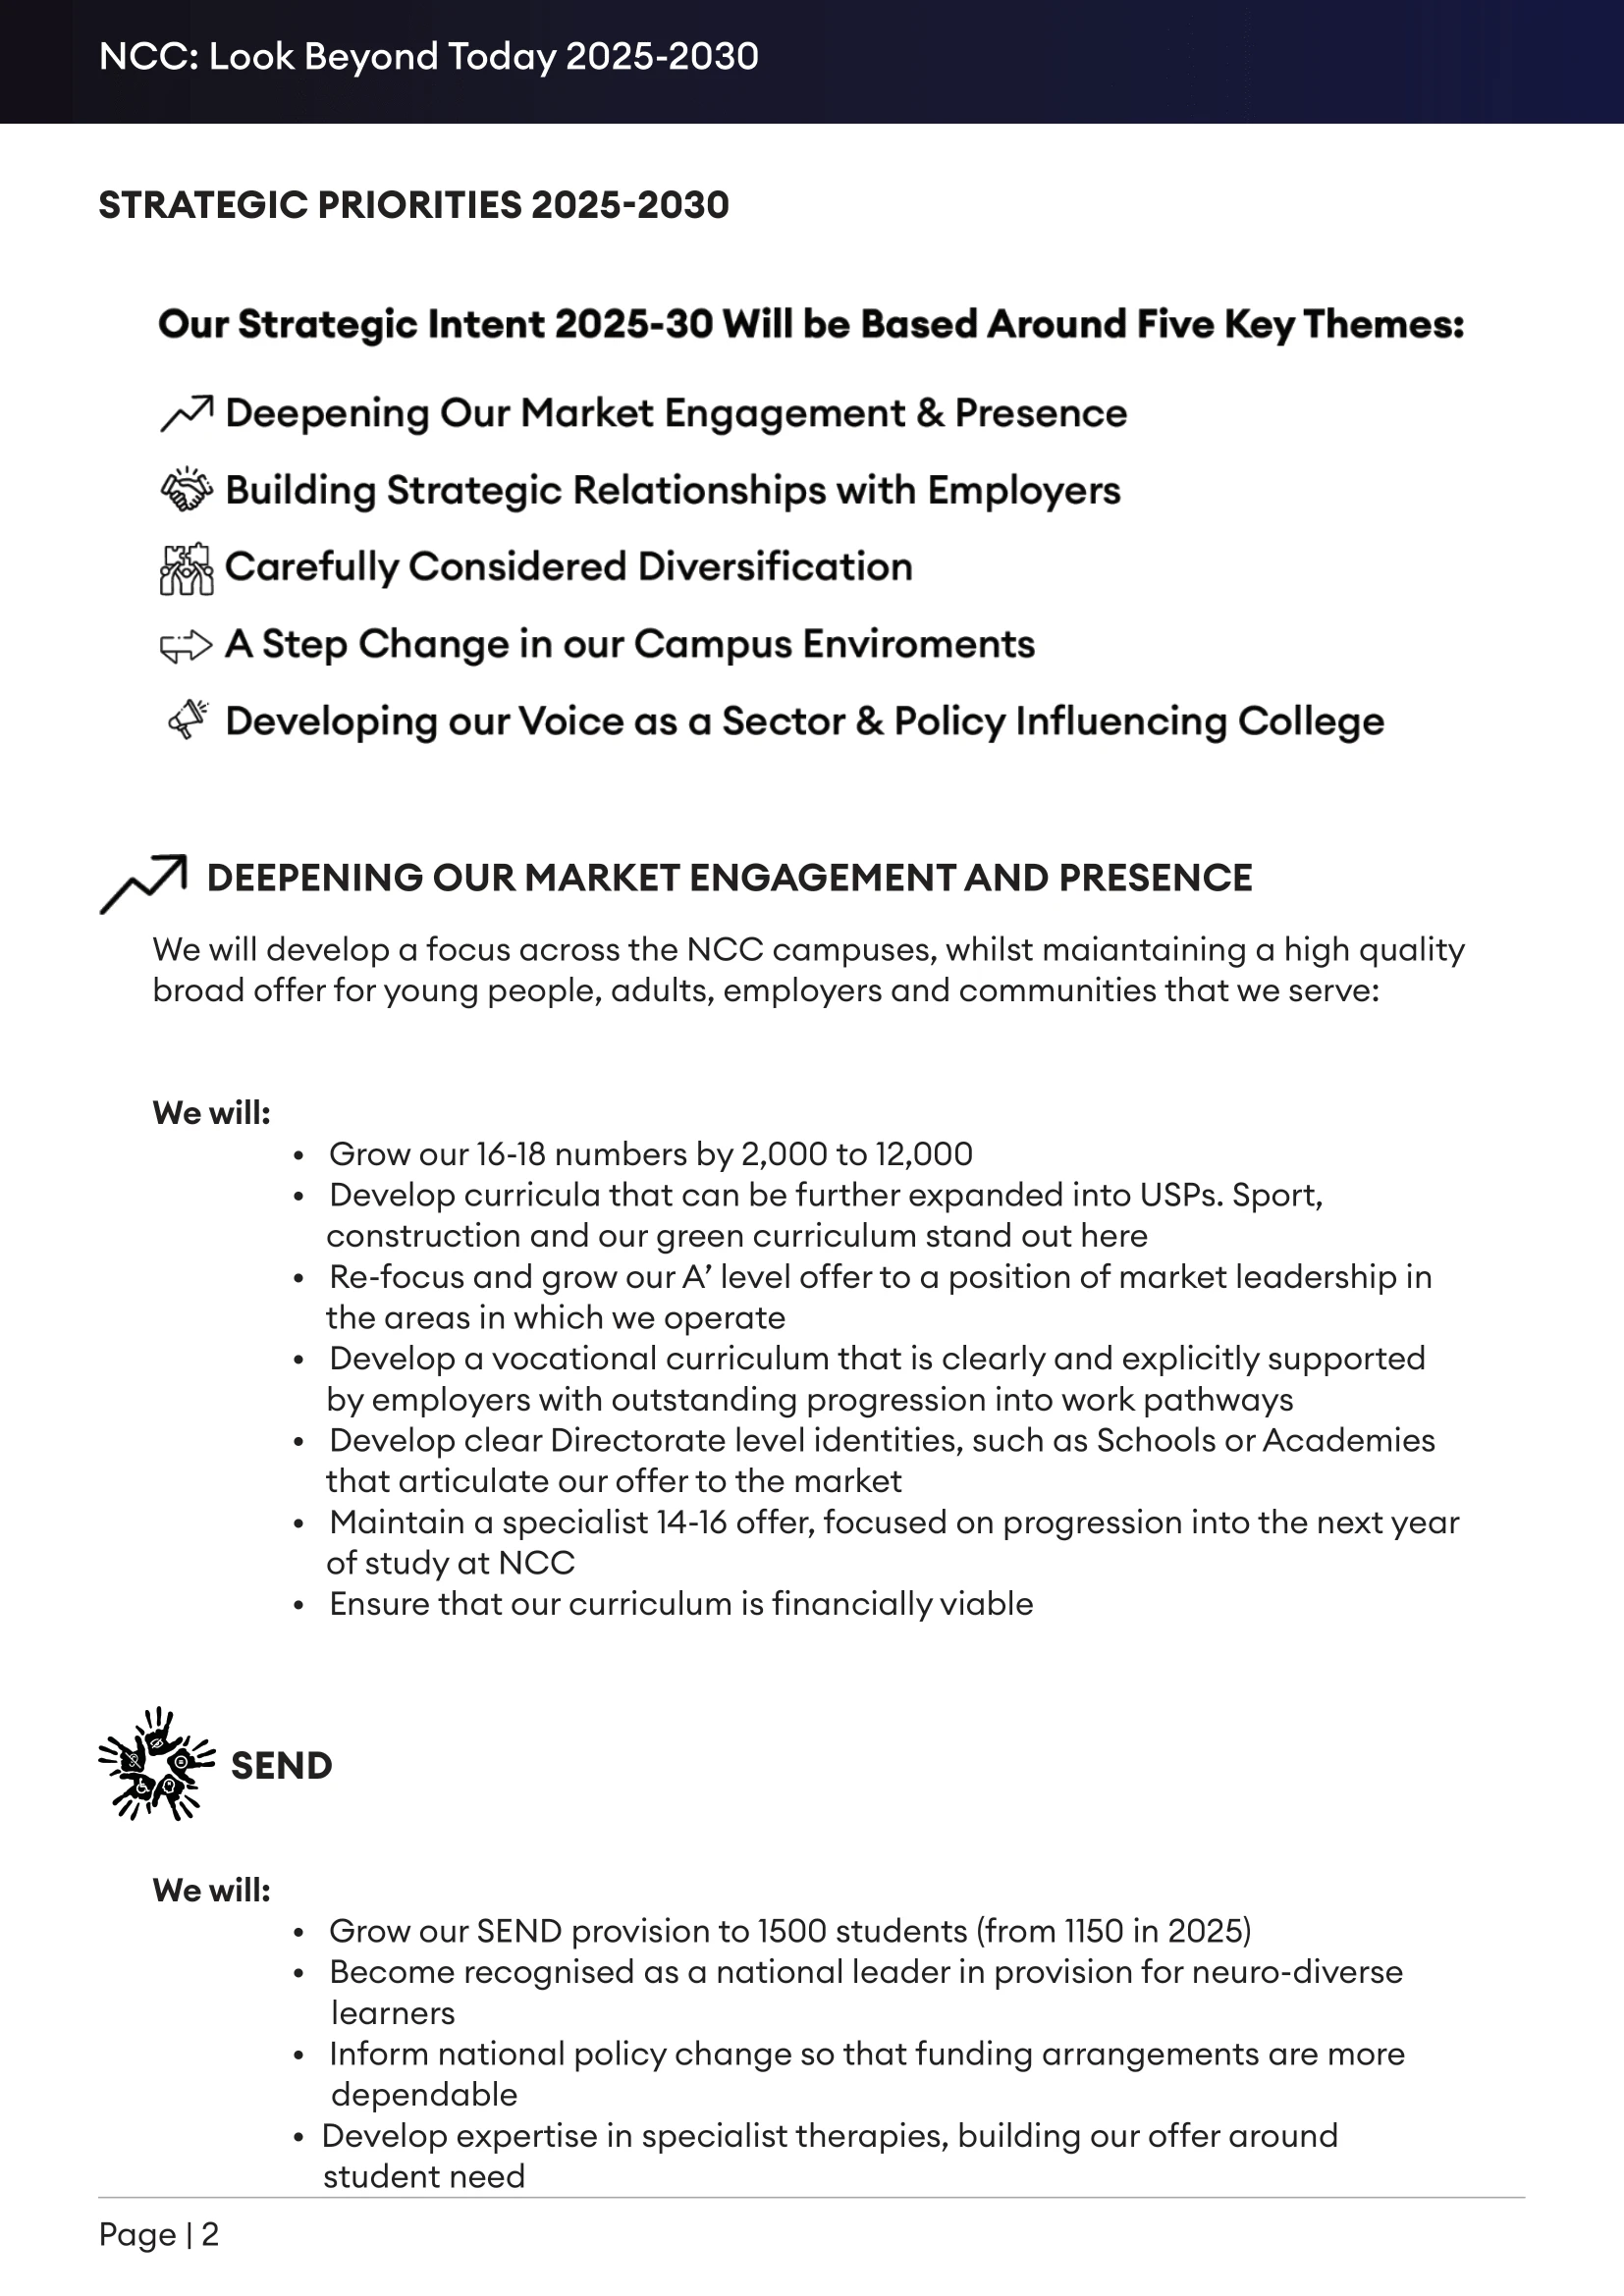
Icons Made, Adjusted Typefaces to Align with NCC's Branding. Copy was Provided by NCC.
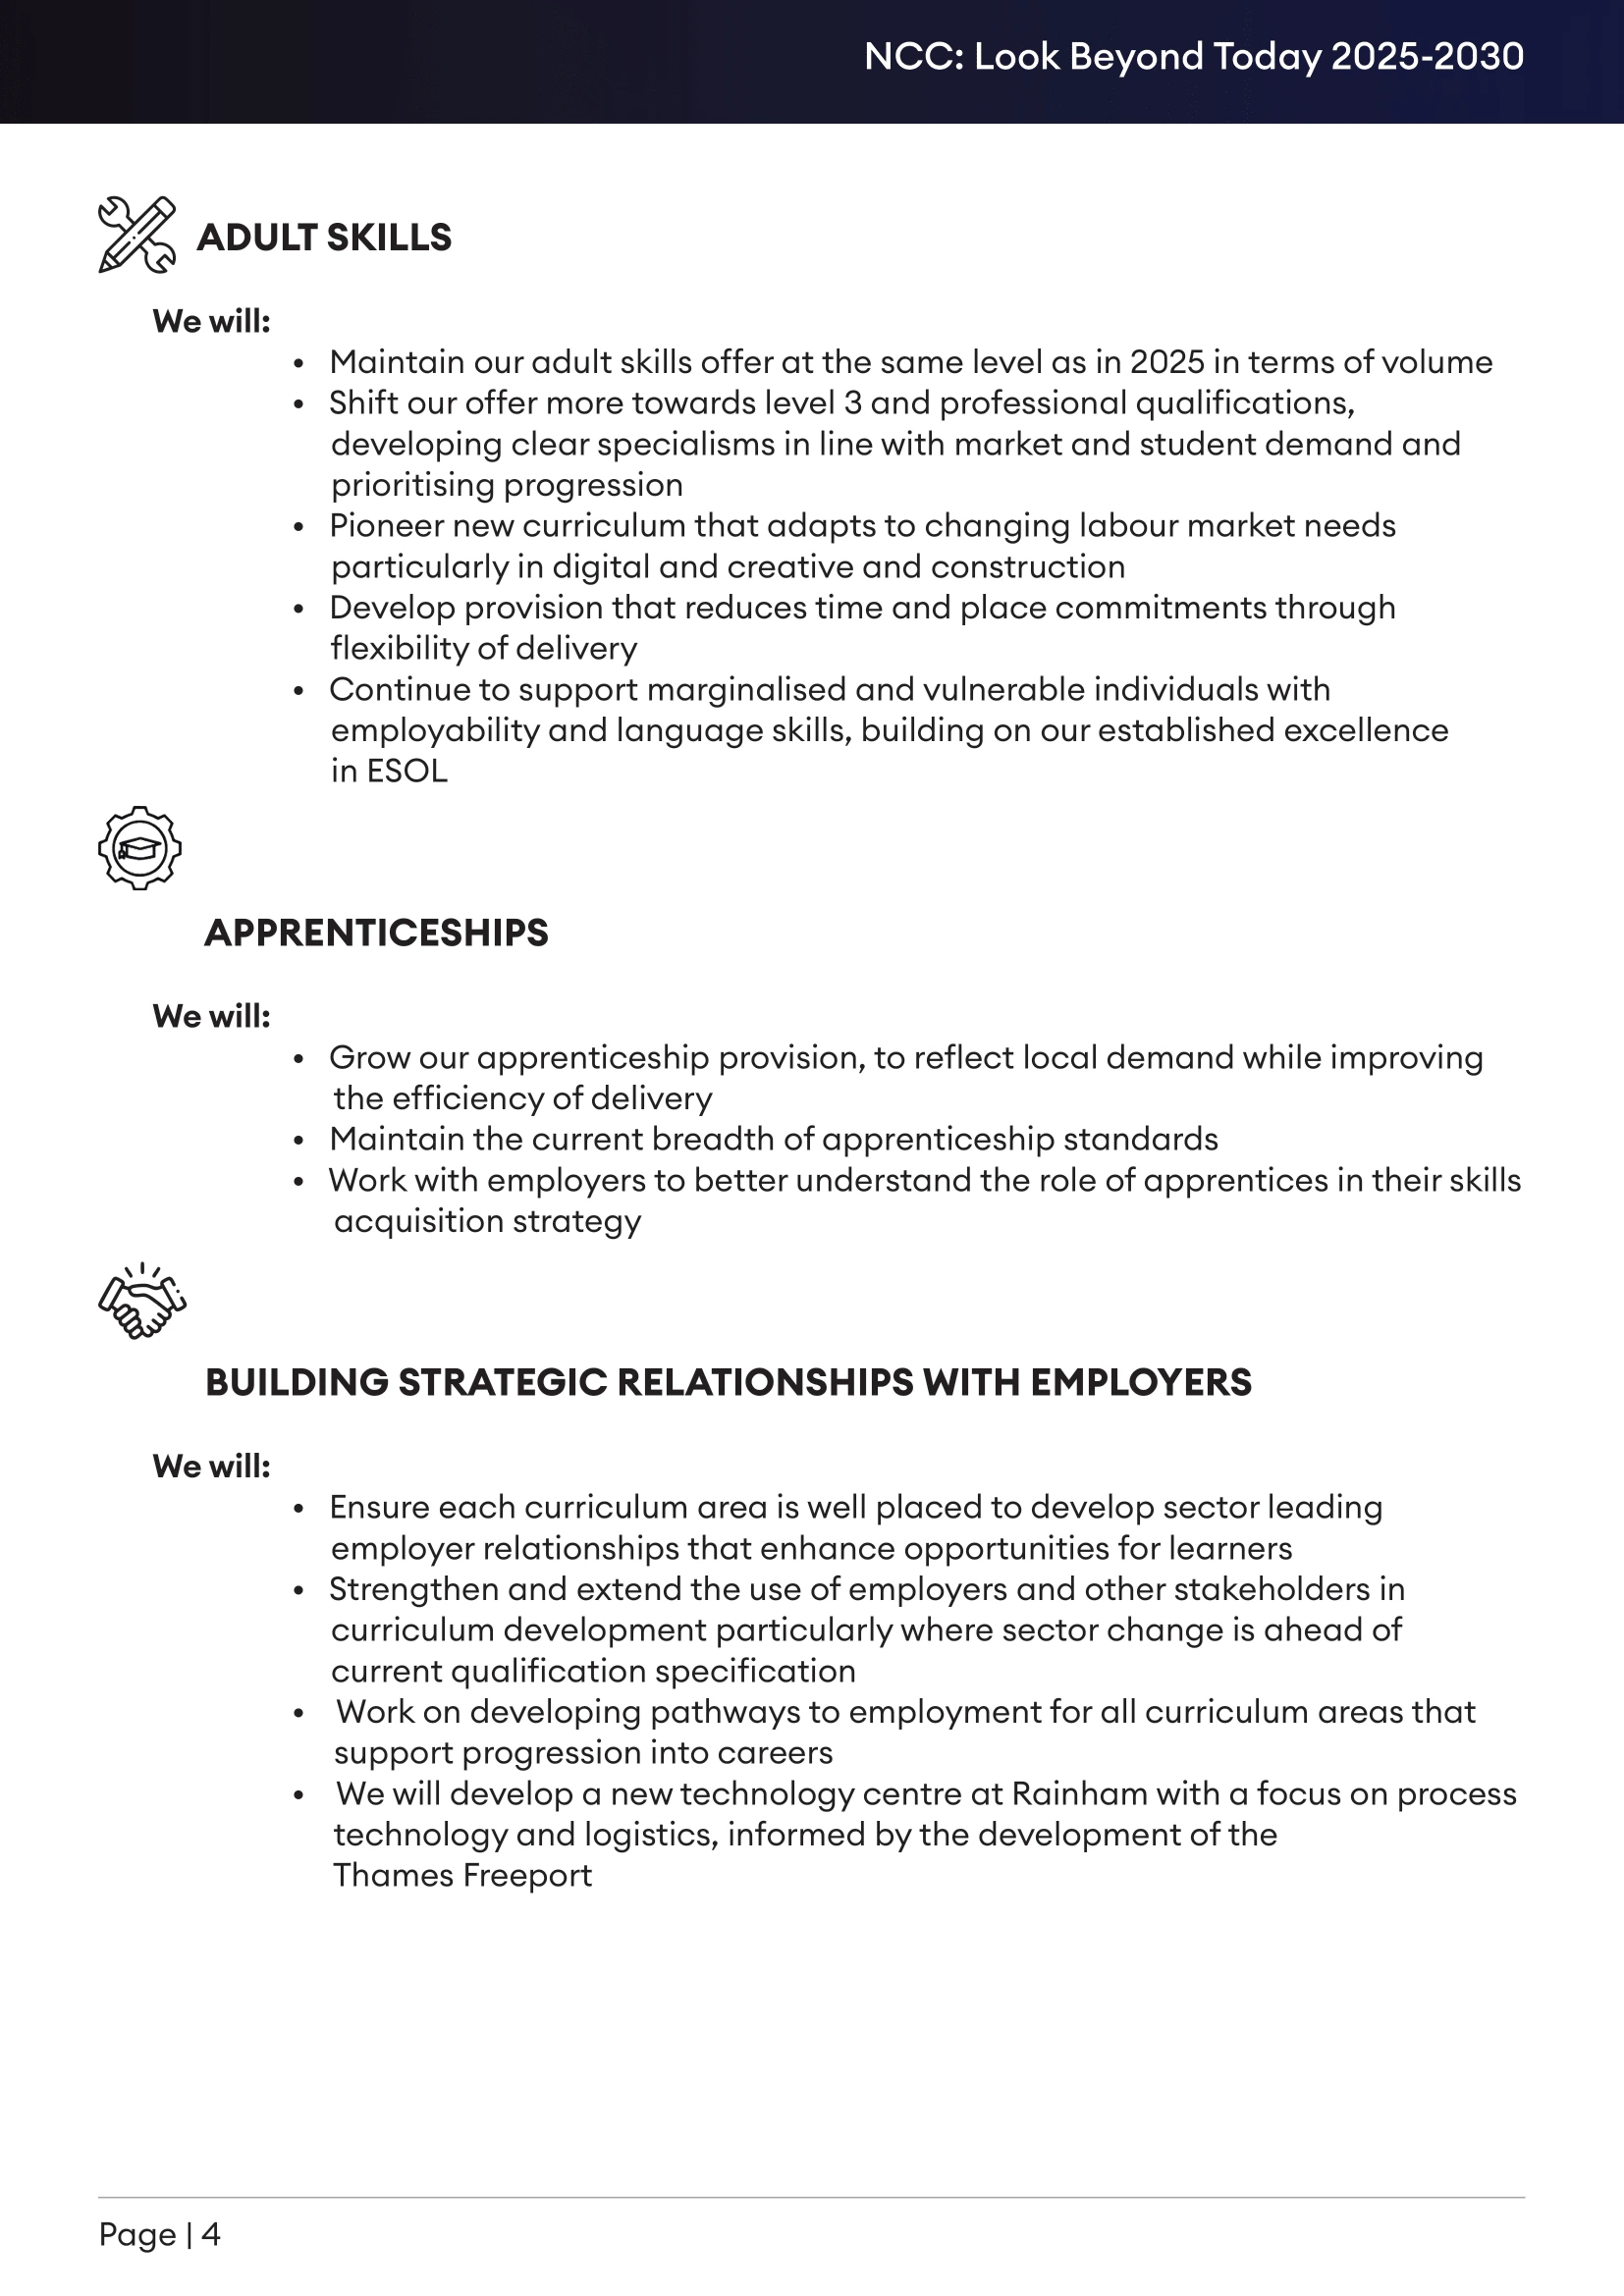
Icons Made, Adjusted Typefaces to Align with NCC's Branding. Copy was Provided by NCC.
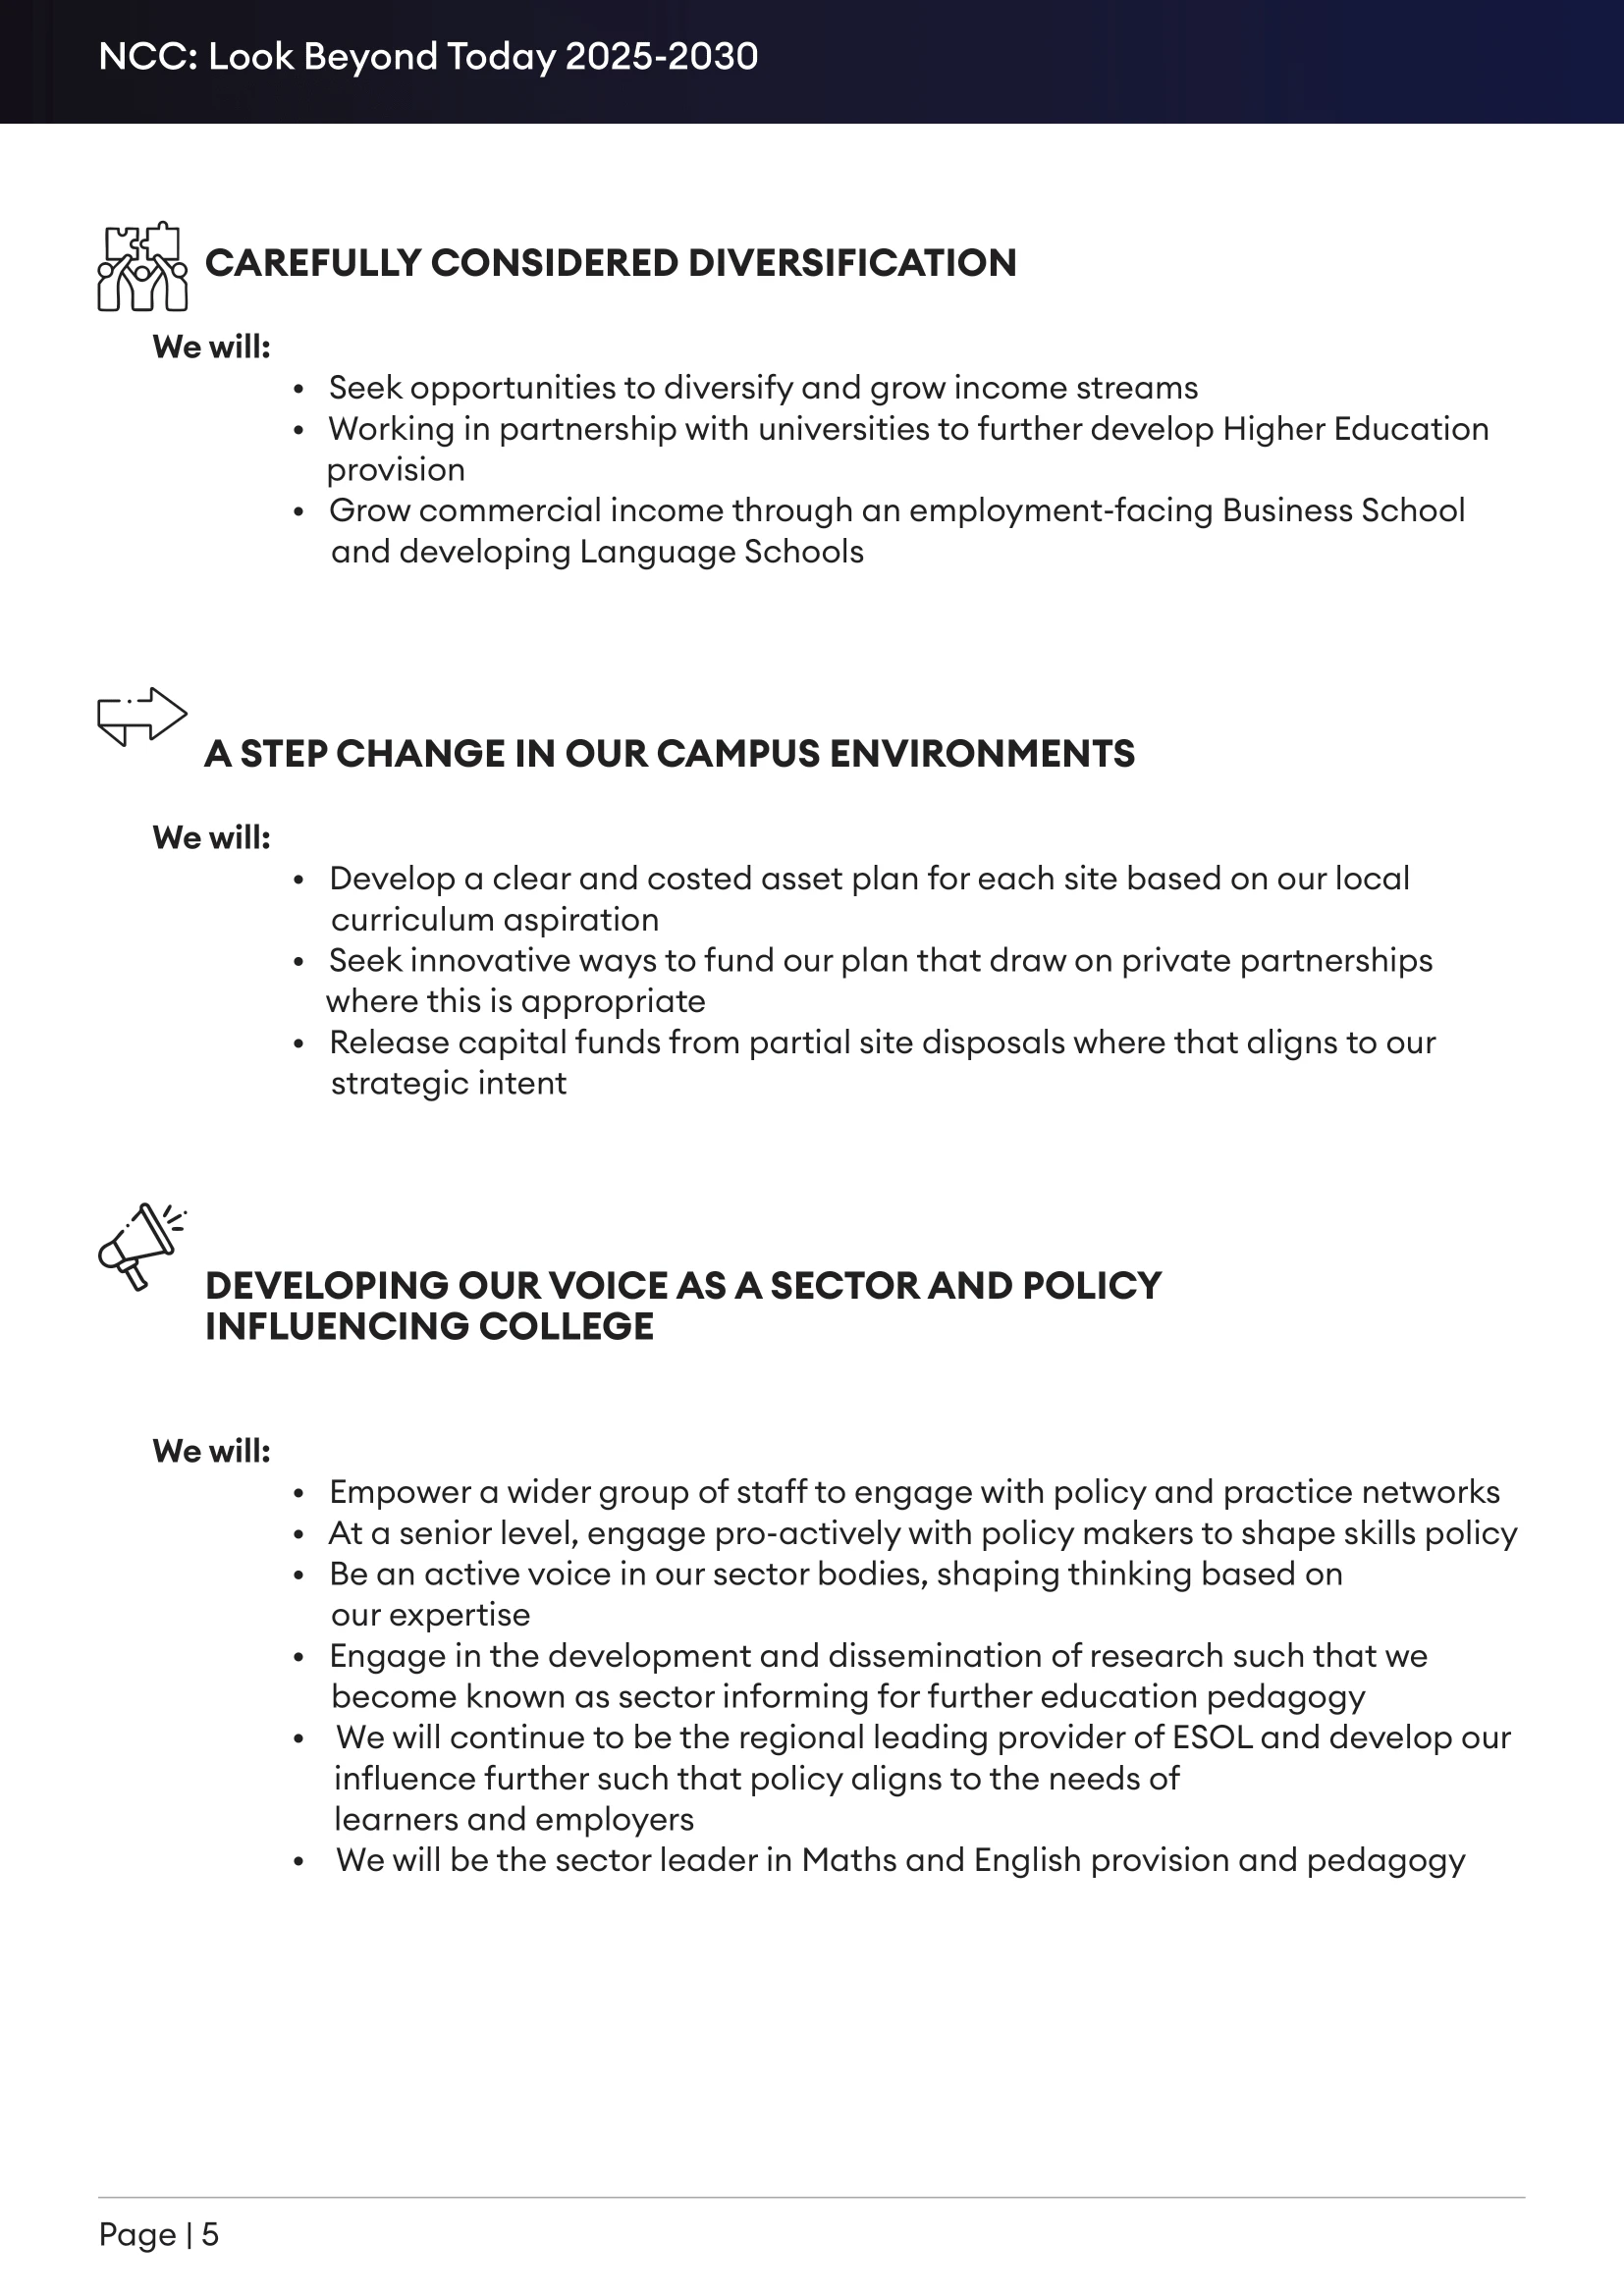
Icons Made, Adjusted Typefaces to Align with NCC's Branding. Copy was Provided by NCC.
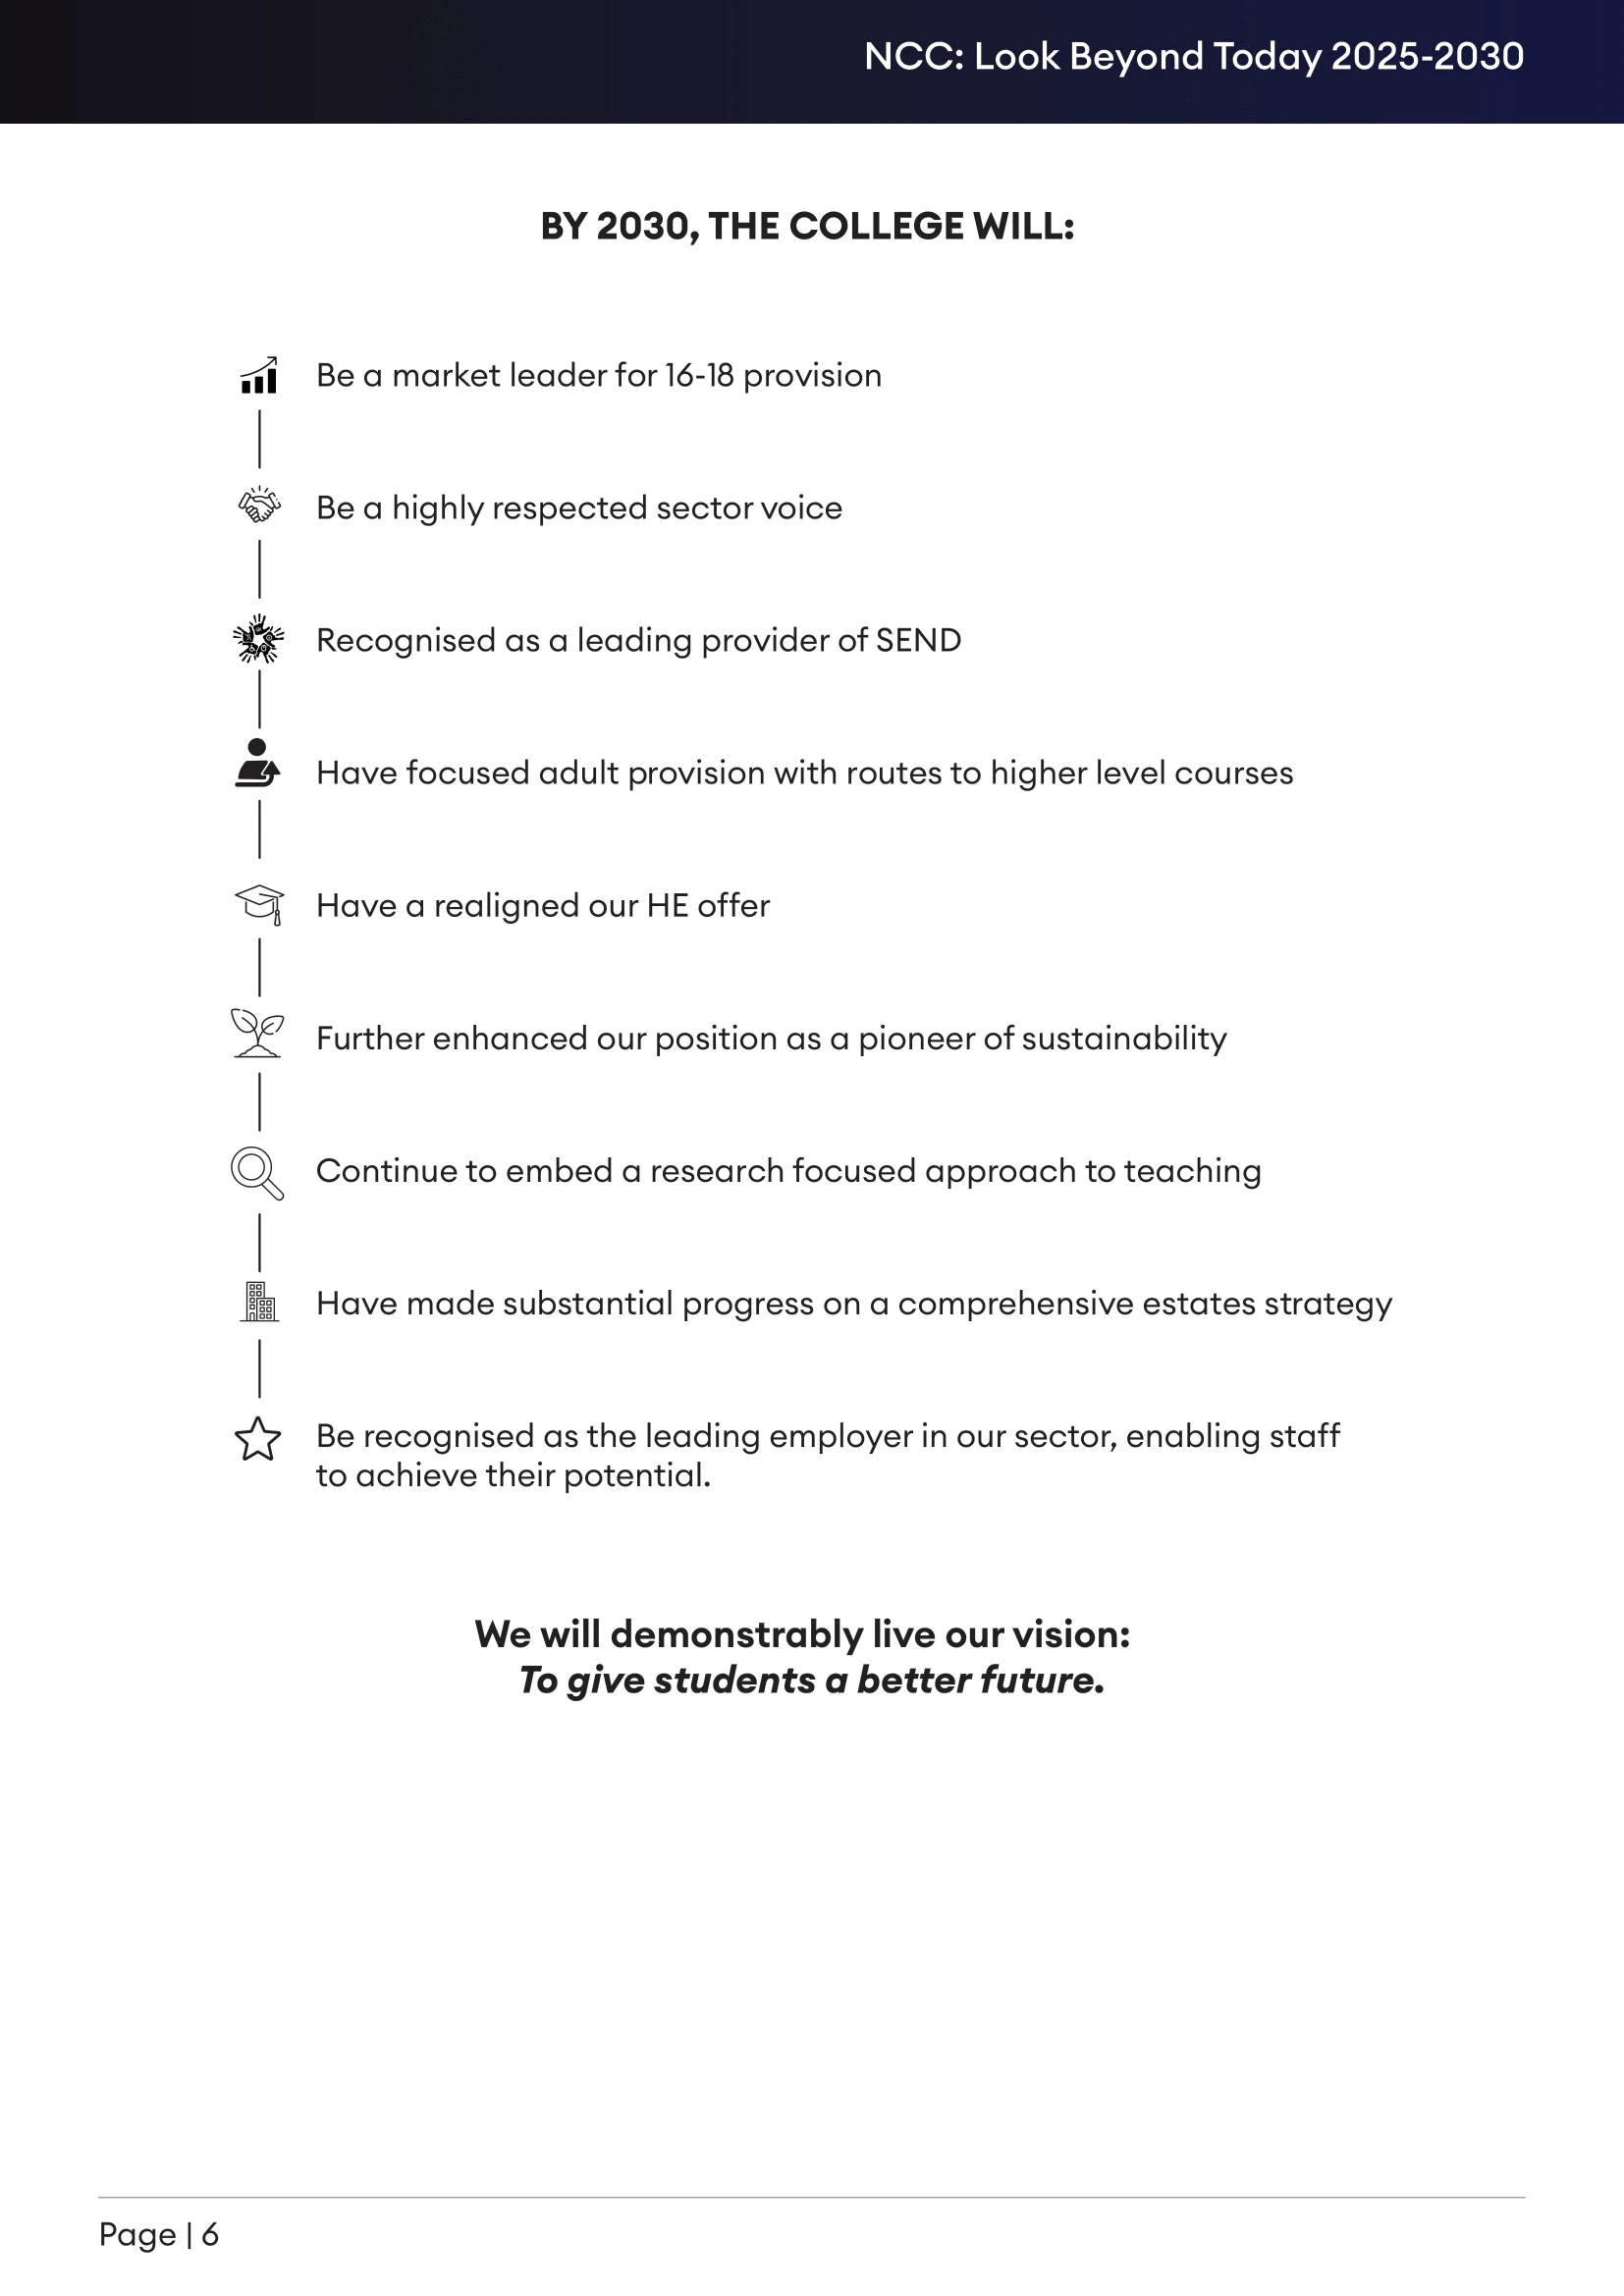
Visual Timeline to show the NCC's Goals Clearly. Copy Provided by NCC.
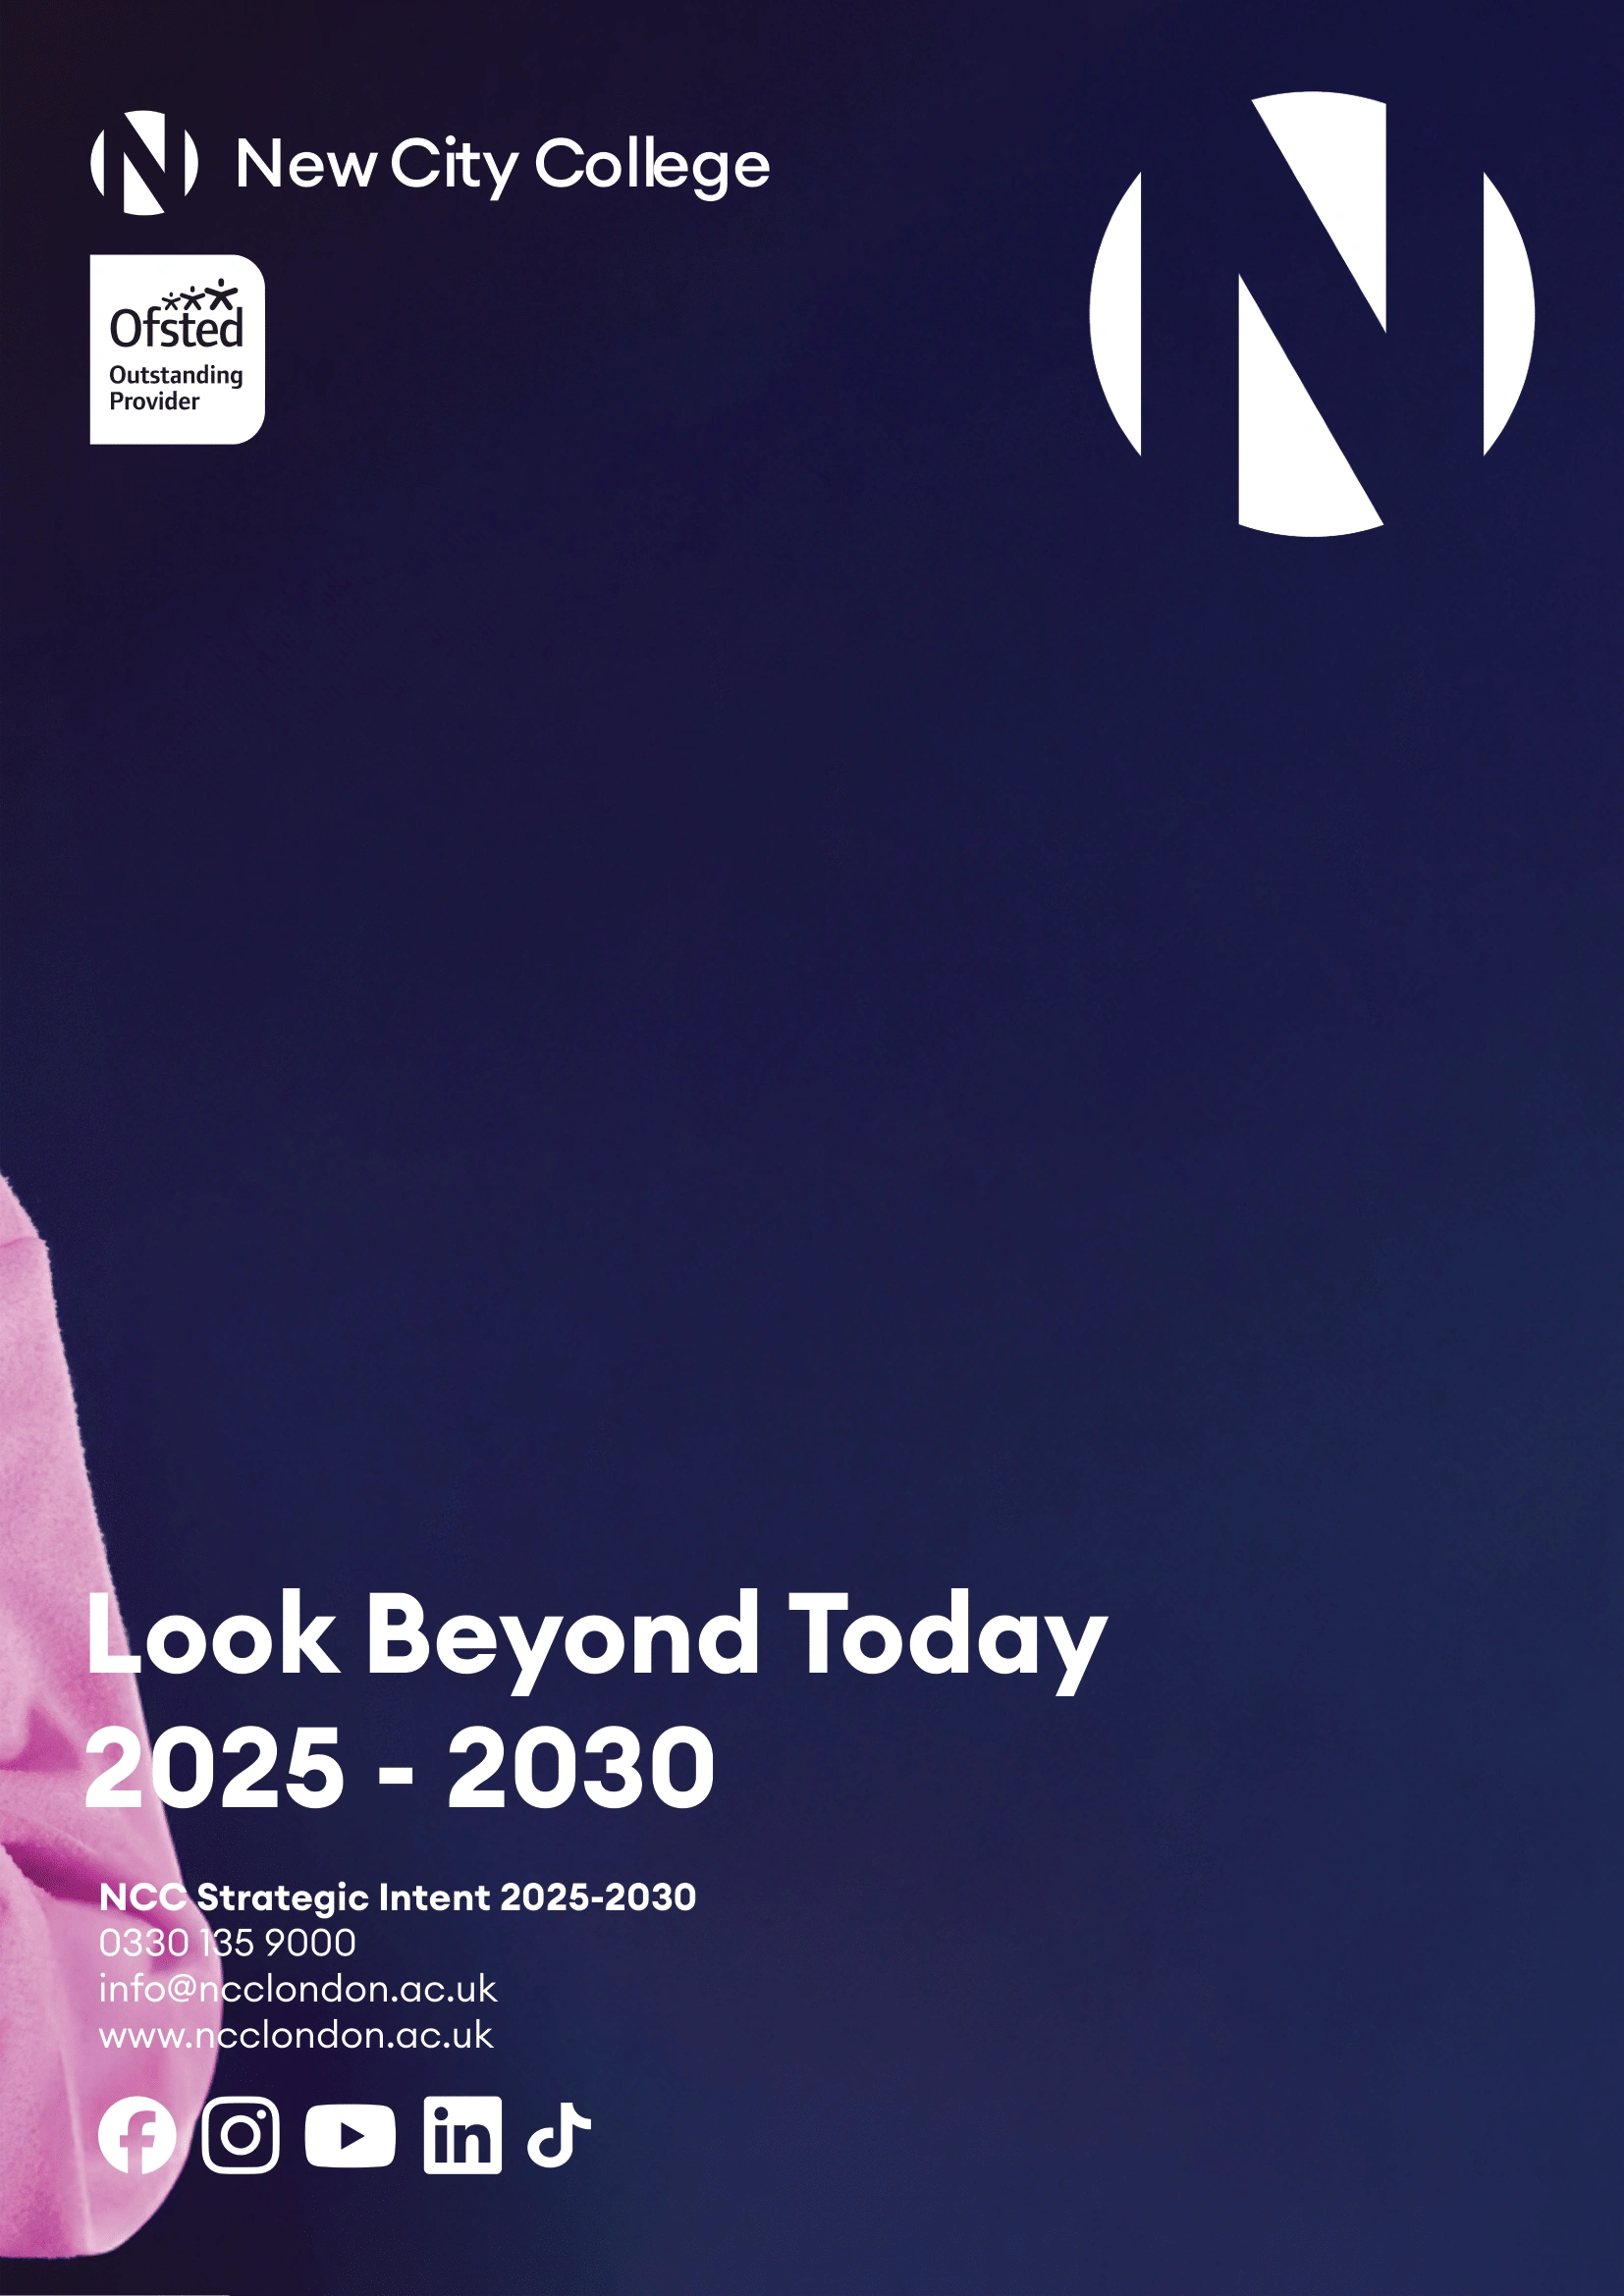
Back Cover of Document Icons Made, Adjusted Typefaces to Align with NCC's Branding. Copy was Provided by NCC.
Like this project
Posted Jan 18, 2026
Created infographics for NCC's strategic briefing, simplifying complex data visually.
Likes
1
Views
1
Timeline
Sep 1, 2025 - Sep 14, 2025