R Shiny App Visualizing Probability Distributions
Josip Novak
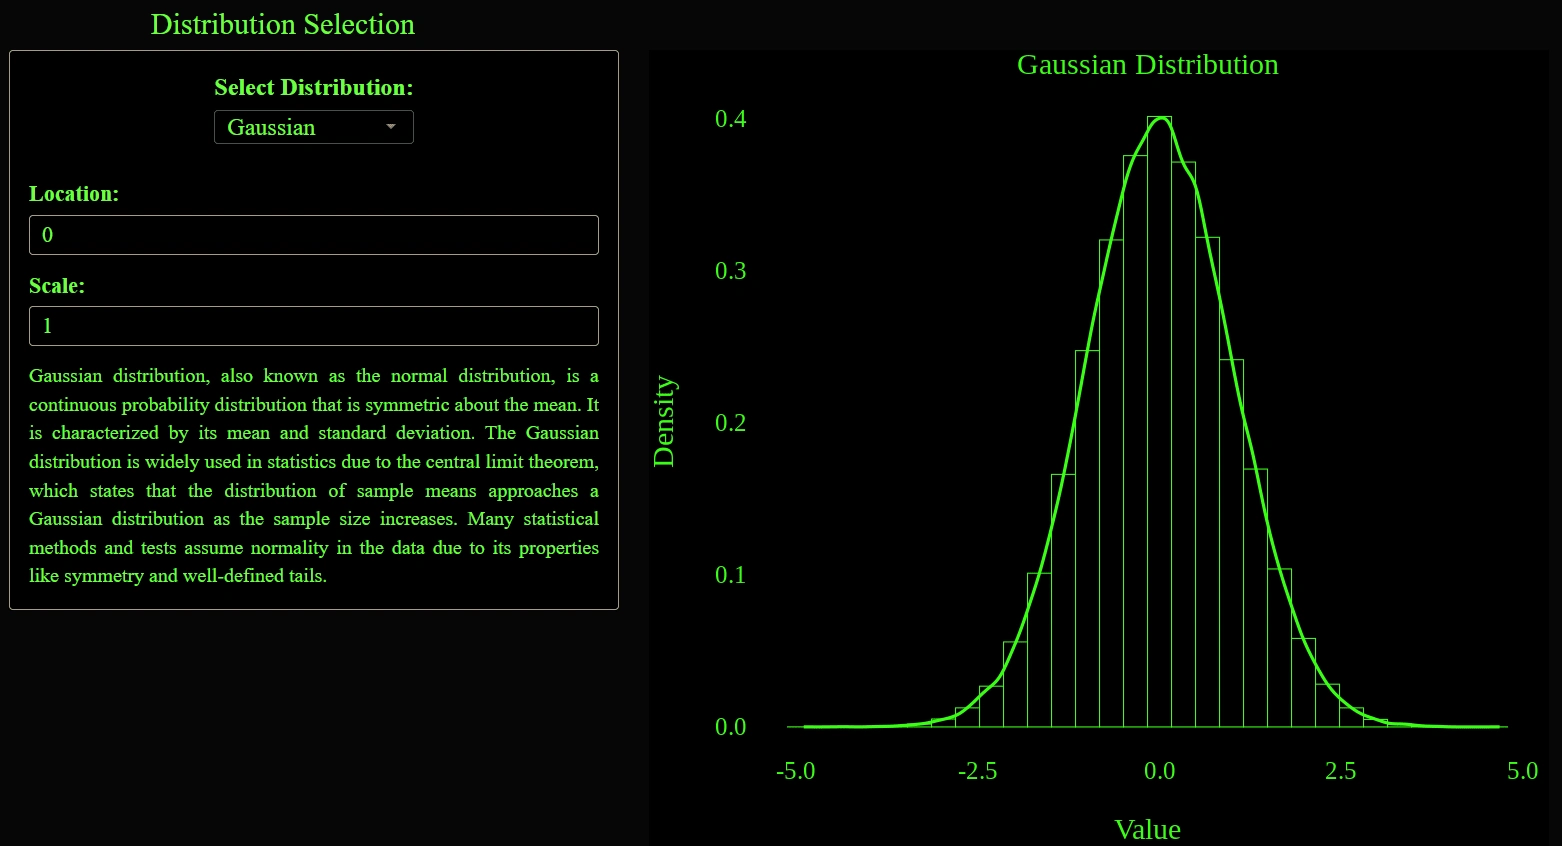
This project, developed in R, represents a deployed Shiny web application. This interactive application covers various statistical distributions including Gaussian, t, F, chi-square, uniform, Bernoulli, binomial, Poisson, exponential, gamma, inverse Gaussian, Gompertz, beta, log-normal, Weibull, Pareto, geometric, hypergeometric, Cauchy, log-Cauchy, Rayleigh, Laplace, etc. Users can adjust parameters for each distribution and see real-time updates, allowing them to observe the impact on the distribution's shape. This functionality makes the application particularly valuable for teaching and learning purposes, helping users gain a deeper understanding of particular statistical distribution through hands-on interaction.
Like this project
Posted Jul 22, 2024
This project, developed in R, represents a deployed Shiny web application. This interactive application covers numerous well-known statistical distributions.
Likes
0
Views
18