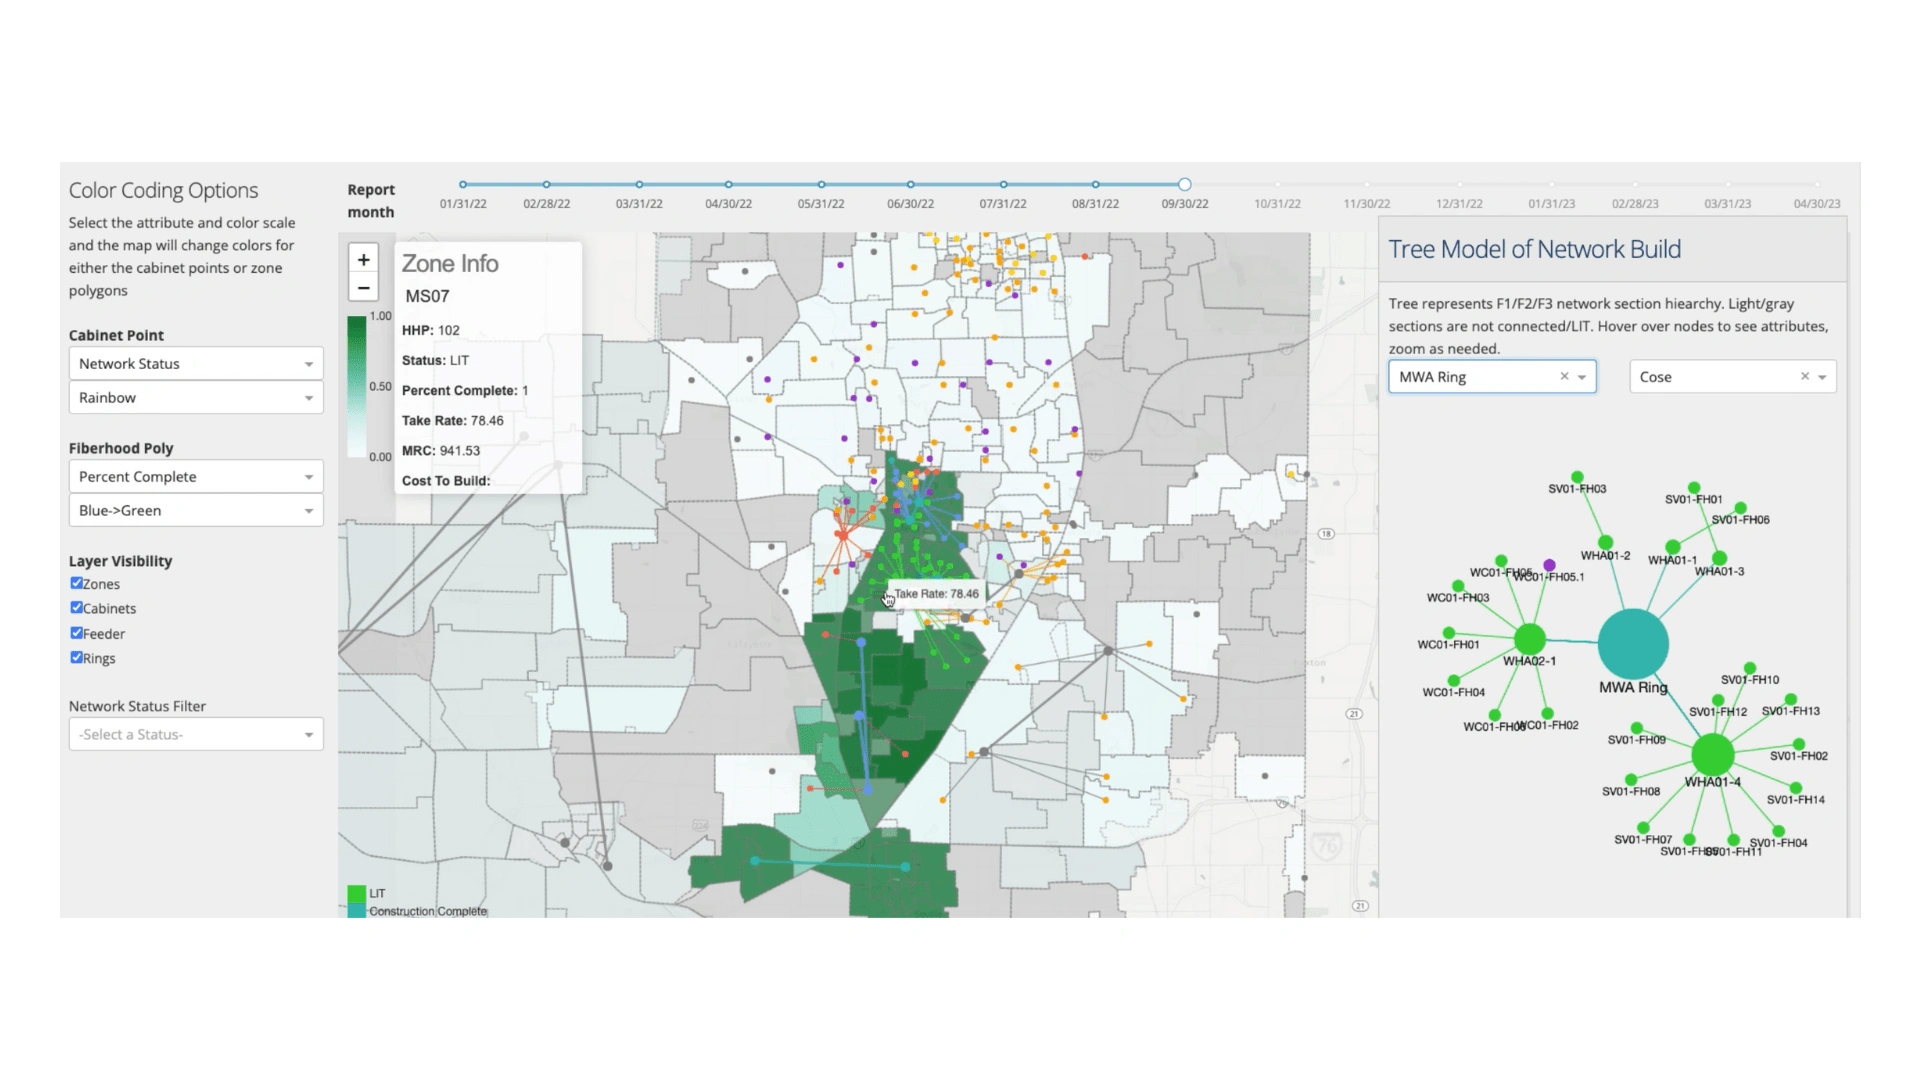
Interactive geospatial dashboard with Leaflet and Dash


Created a geospatial application for a customer that is responsible for building networks and data centers to serve Internet to customers in the United States. The dashboard gives a visualization of fiber network builds that will allow stakeholders to discover key business information
Key features:
I created a connected geospatial and network visualization, built with Plotly Dash, Leaflet and Cytoscape, that shows:
- Geographic location of each element and key attributes of each element (eg. Completion status, date)
- With a timeline, show evolution of growth of network over time
- Dropdown menus available to change data attributes to visualize on map
- A network visualization to show the hierarchy of networks and the relationships between them
Like this project
0
Posted Aug 9, 2023
Developed a geospatial app to visualize spatial customer data, giving client a bird-eye's view of biz operations, while able to investigate specific locations.
Likes
0
Views
156


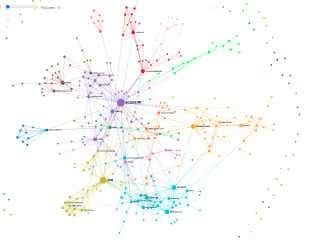
Network Visualization for Social Media Analysis
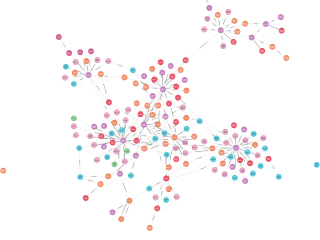
Constructing a Knowledge Graph from unstructured data with LLMs
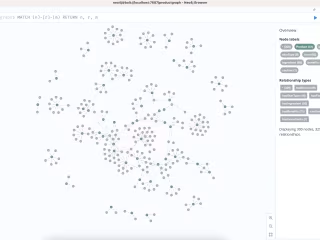
Implementing Retrieval-Augmented Generation with Knowledge Graph

D3.js: Scrollytelling Visual Article