A sales analytics Power BI
Shweta Kemani
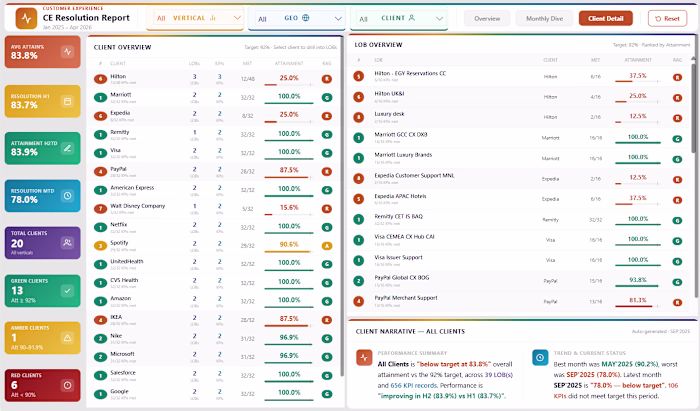
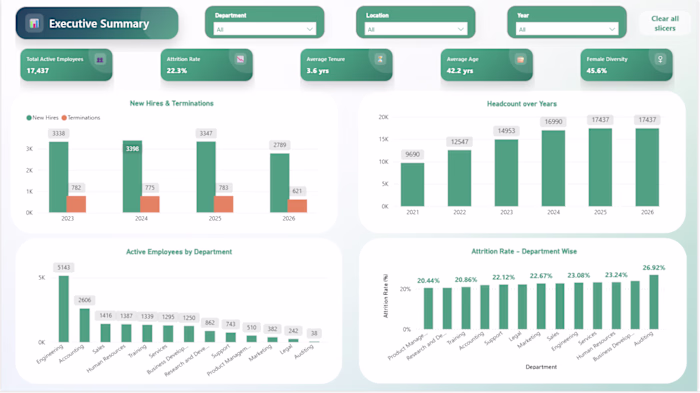
A sales analytics Power BI dashboard built to track revenue performance, category breakdown and subscription metrics for business leadership. The report covers current vs prior year revenue trends, margin analysis and category level performance across Hardware, Software, Services and Subscriptions.
The build features KPI summary cards, a revenue trend line chart with year over year comparison, bubble map for geographic performance, category performance breakdown and a dynamic narrative summary highlighting key insights automatically.
Designed for executive audiences who need to walk into a meeting and immediately understand where the business is growing and where it is not. Built using DAX measures, Power Query data transformation and custom visual layout engineering inside Power BI Desktop.
Like this project
Posted May 15, 2026
A sales analytics Power BI dashboard built to track revenue performance, category breakdown and subscription metrics for business leadership. The report cove...
Likes
0
Views
0