Built with Rive
European Seas Interactive Chart
Kris Blencki
European Seas – interactive chart in Rive
Overview
This project aims to visualize data on the depth of various European seas in an engaging and interactive format using the Rive app.
Solution
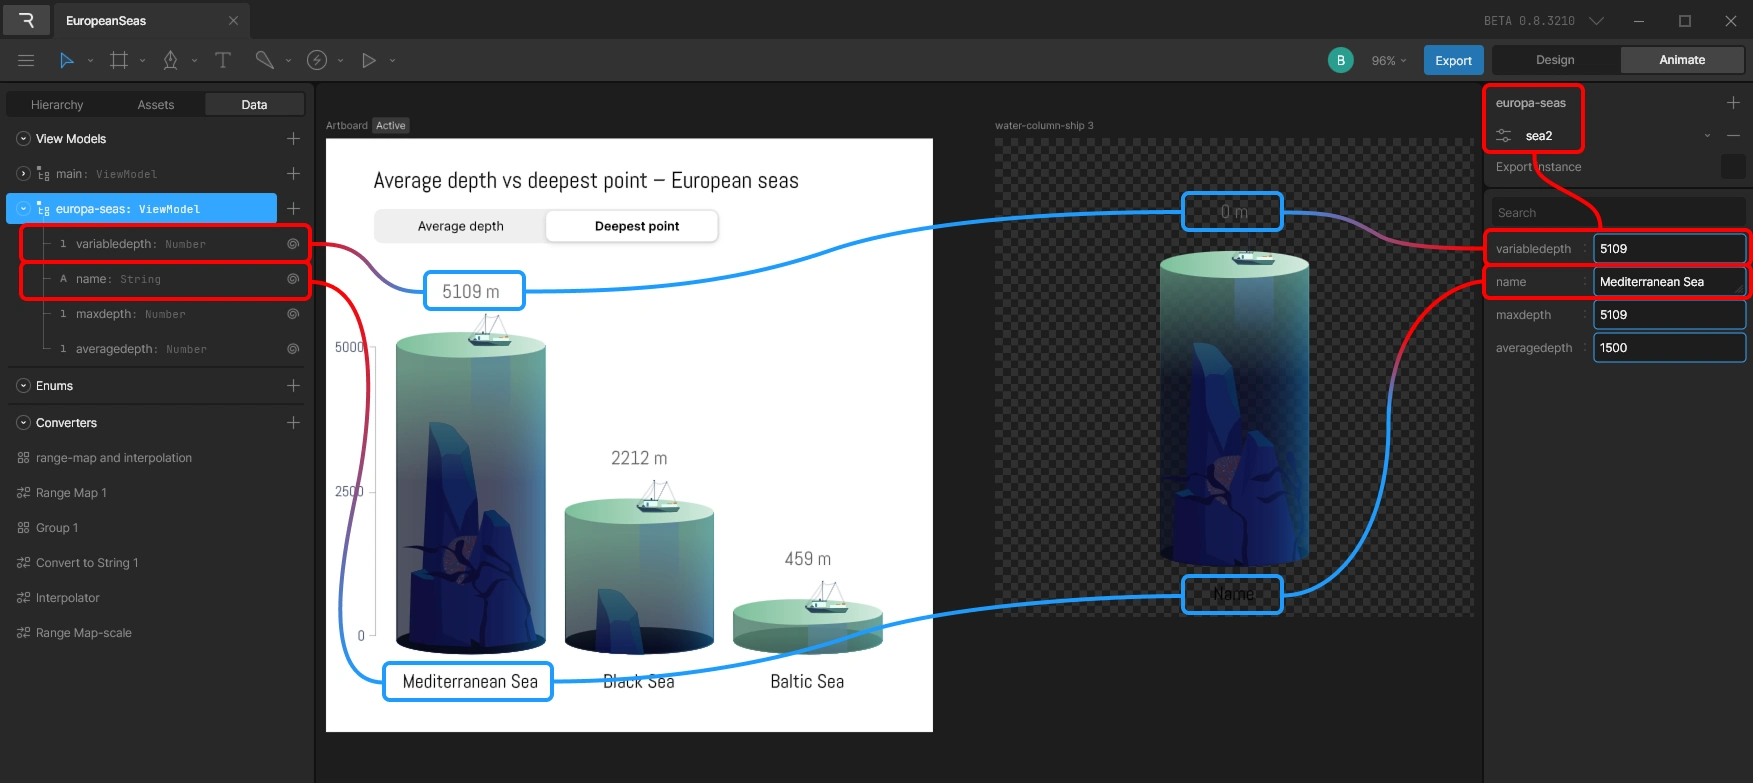
A significant portion of the project focused on illustration. The final design features a detailed visual style, using layered gradients to create a pseudo-3D appearance of the water column. Animation was implemented using Rive’s bone system—bringing motion to the water surface and gently swaying seaweed at the bottom, adding a sense of realism.
To accommodate multiple seas with varying depth properties, I utilized data binding and nested art boards. This allowed a single animated design to dynamically adapt based on specific data inputs. The structure was designed to be scalable, enabling easy addition of new water columns with unique characteristics without altering the core animation logic.
Like this project
Posted Jul 18, 2025
Created an interactive chart in Rive to visualize European seas' depth.