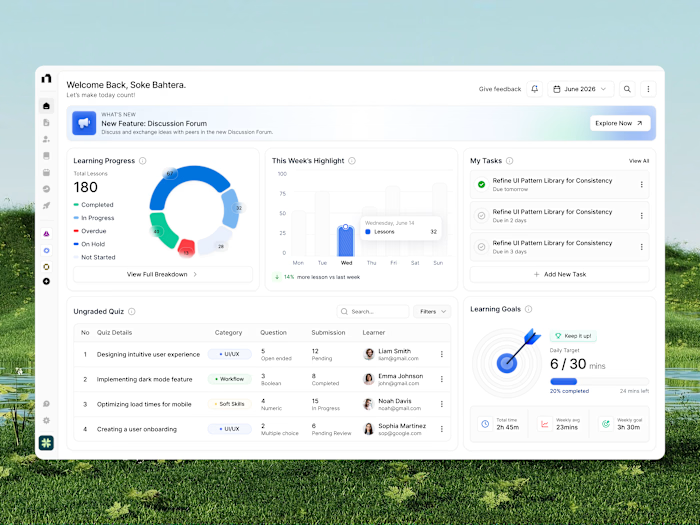
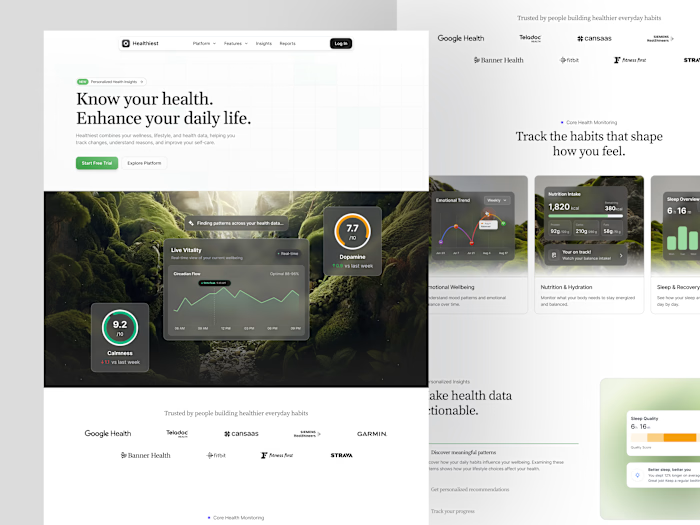
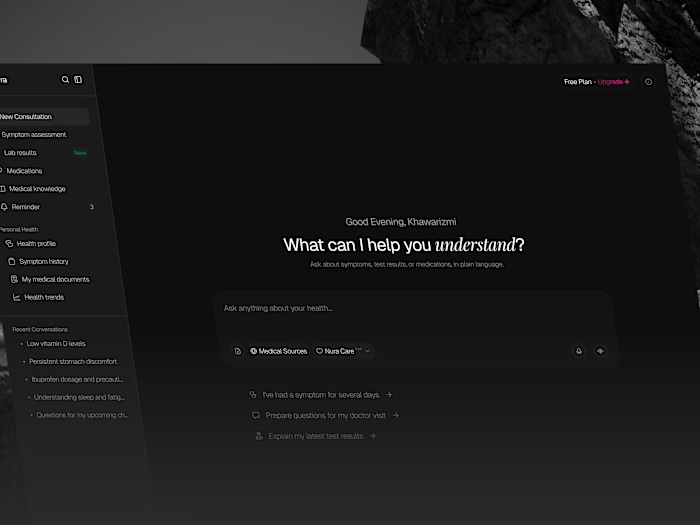
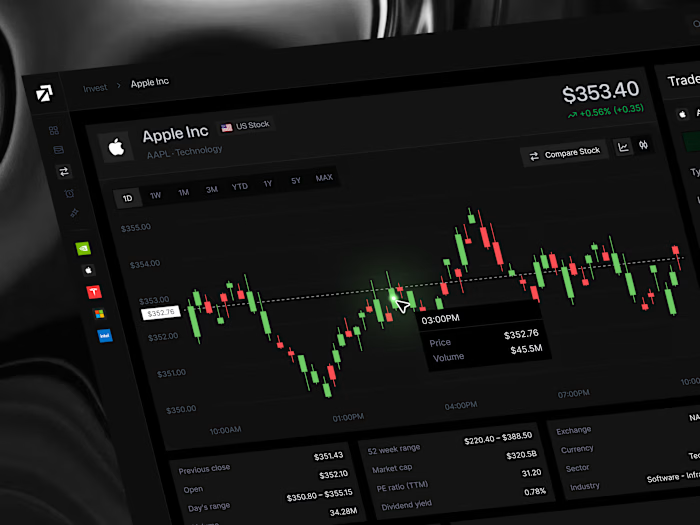
Monify Budget Management Dashboard UI/UX Design

Cansaas Agency

Overview
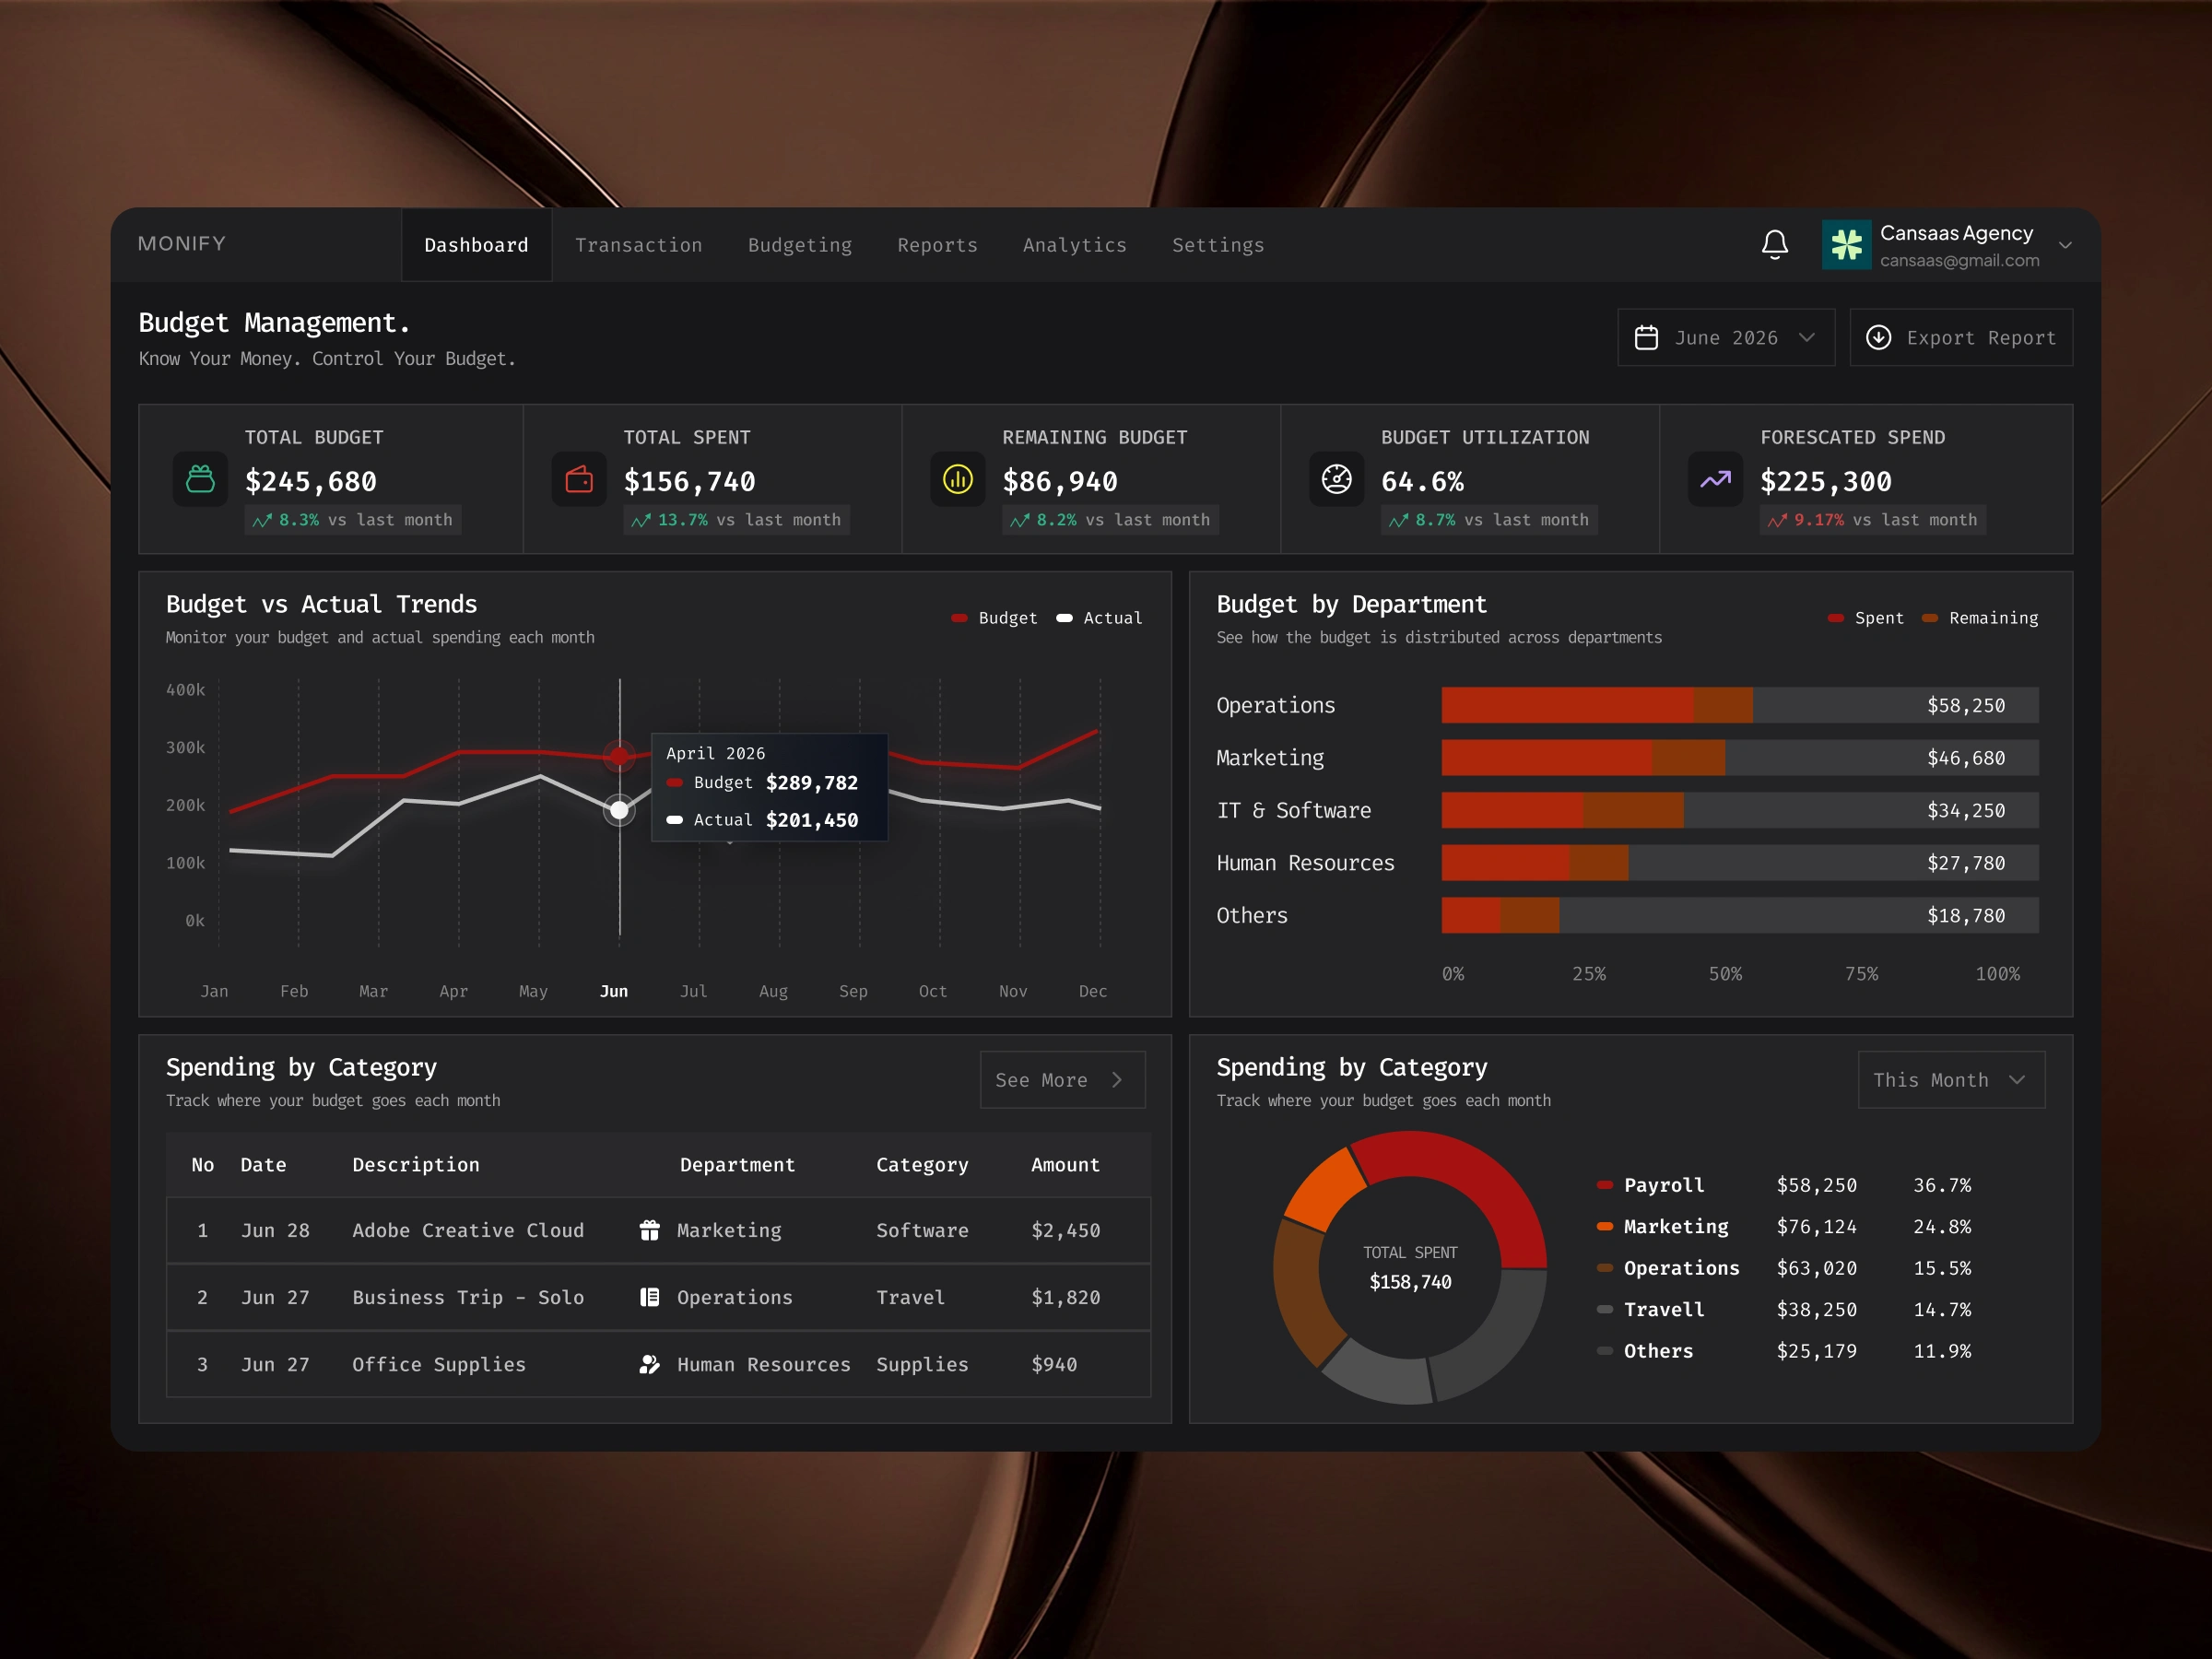
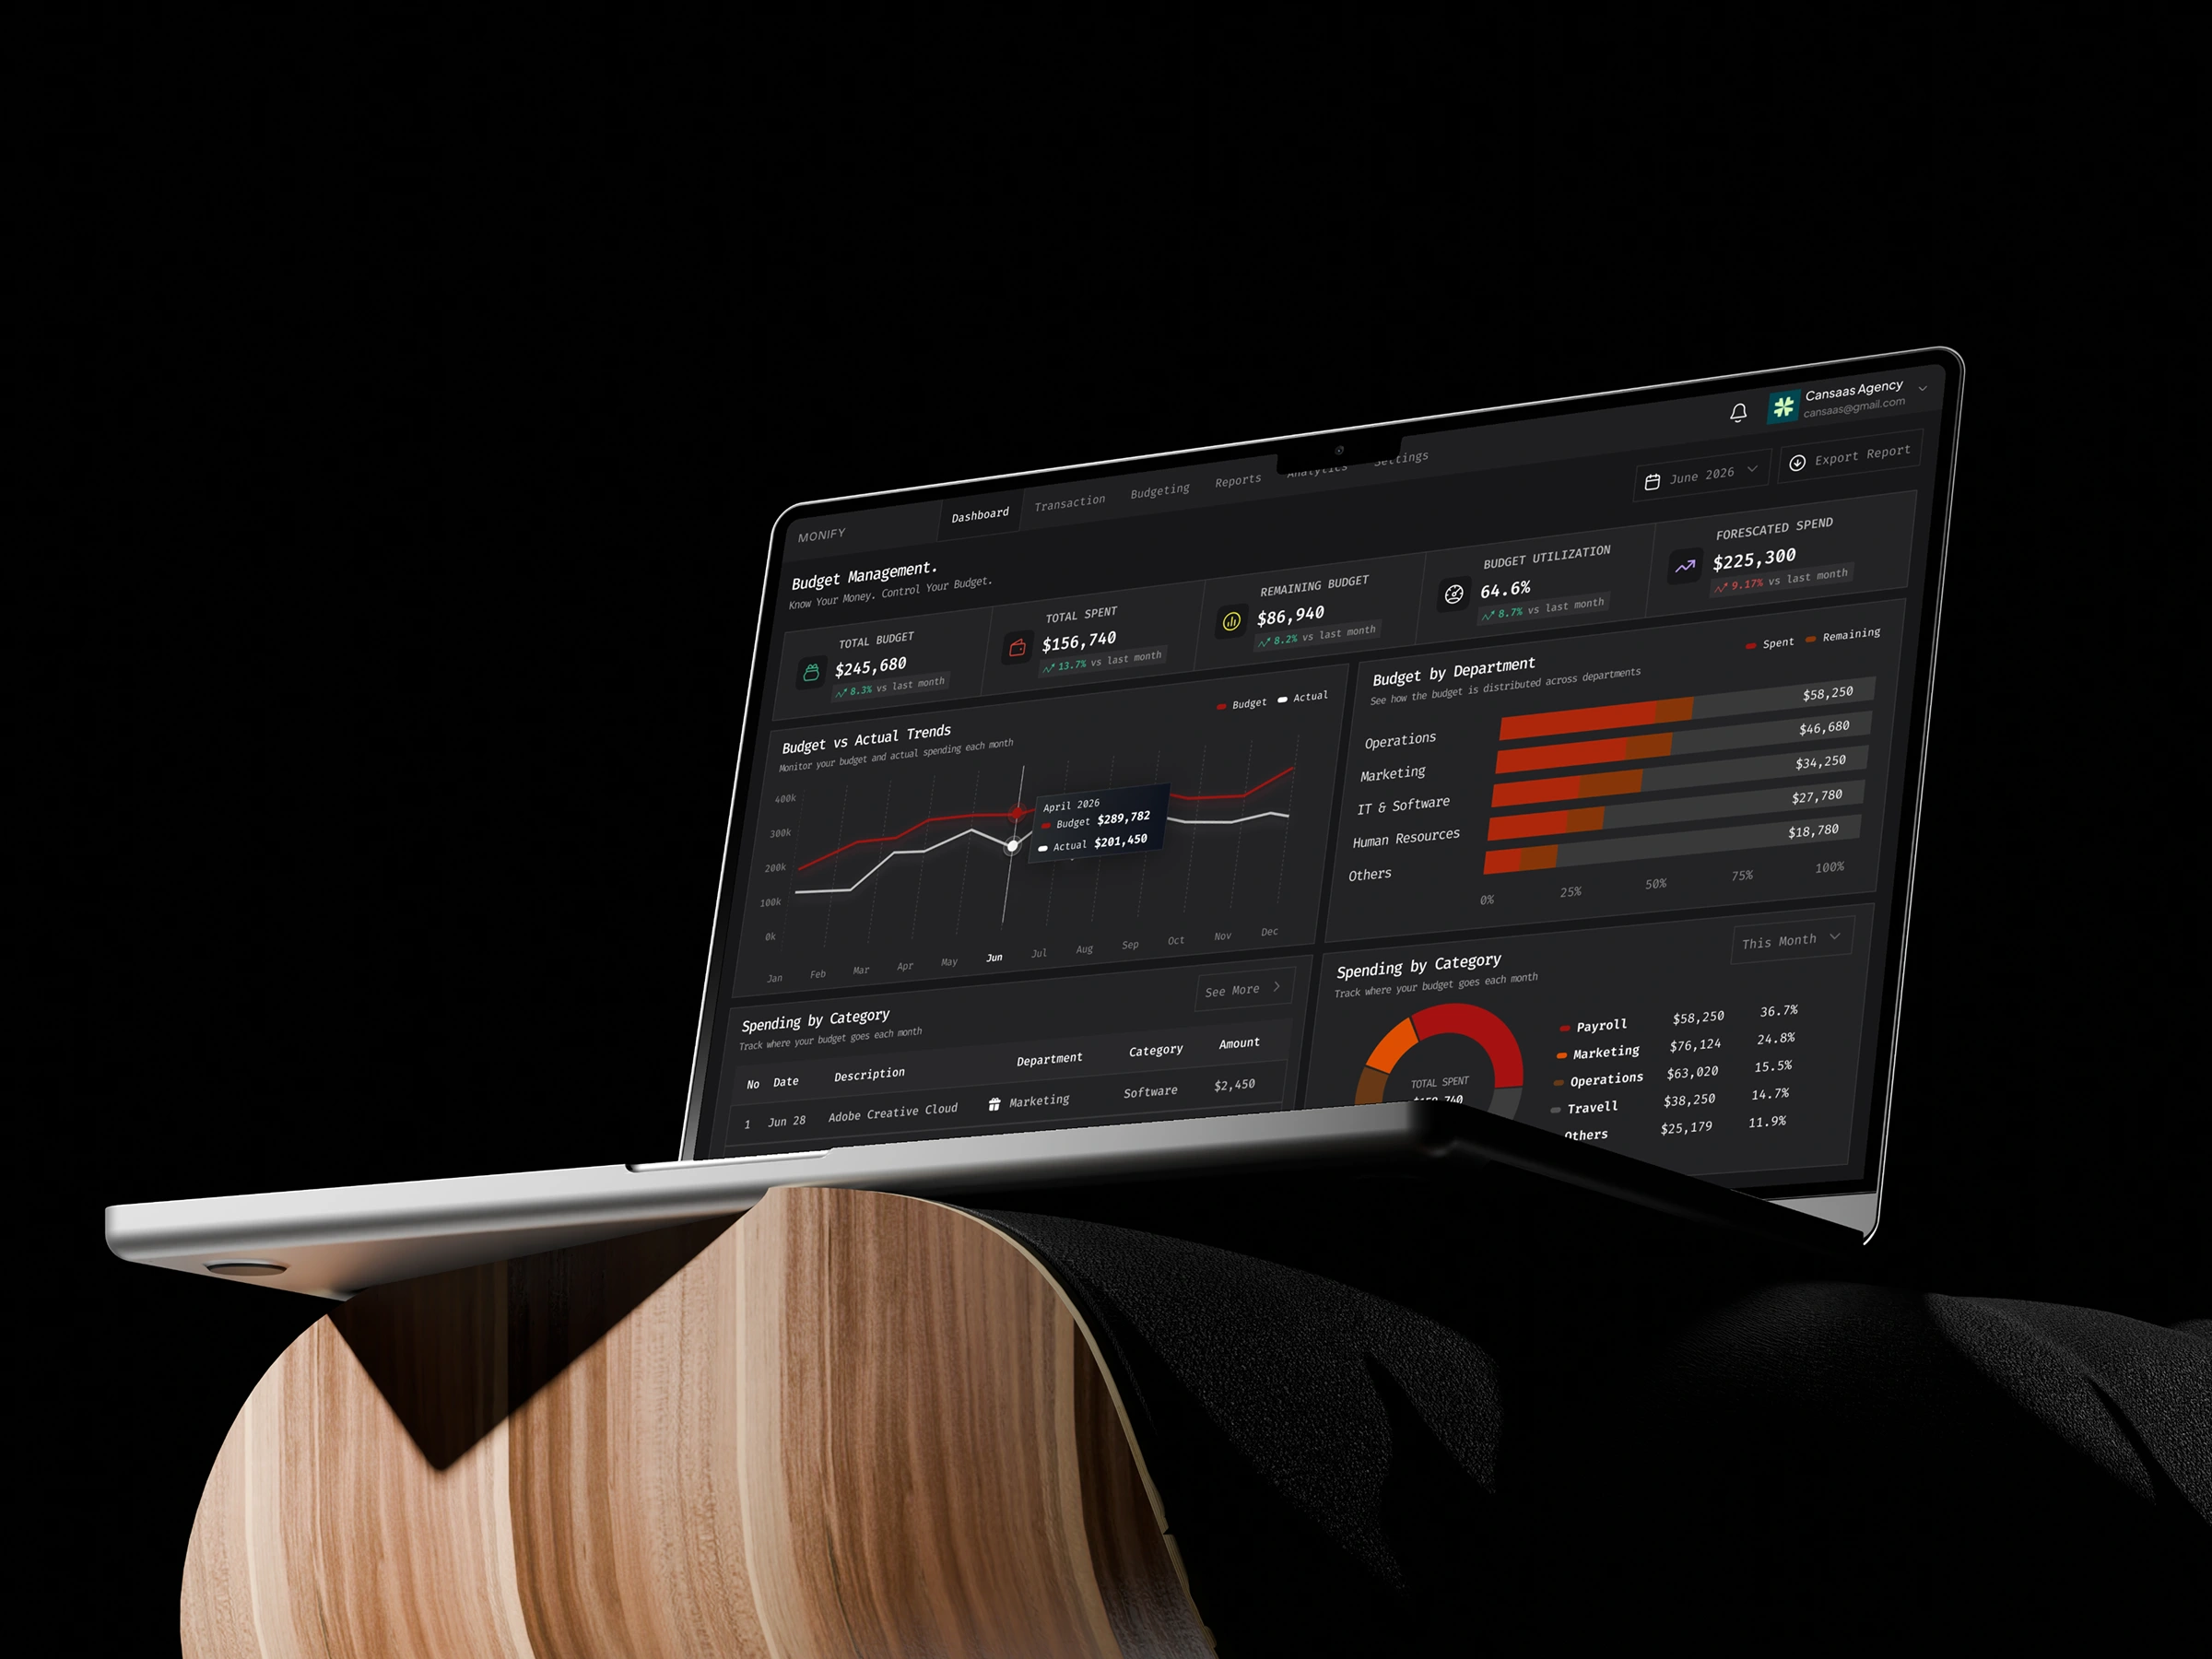
Monify is a modern budget management dashboard designed to help businesses and teams monitor financial performance, manage expenses, and track budgets within one organized workspace. The platform brings together budget utilization, spending forecasts, department-level financial analysis, and expense tracking through a clean, data-driven interface. With a sleek dark mode UI, structured financial metrics, and intuitive data visualization, Monify transforms complex budget information into a clearer and more focused financial management experience.
Design Approach
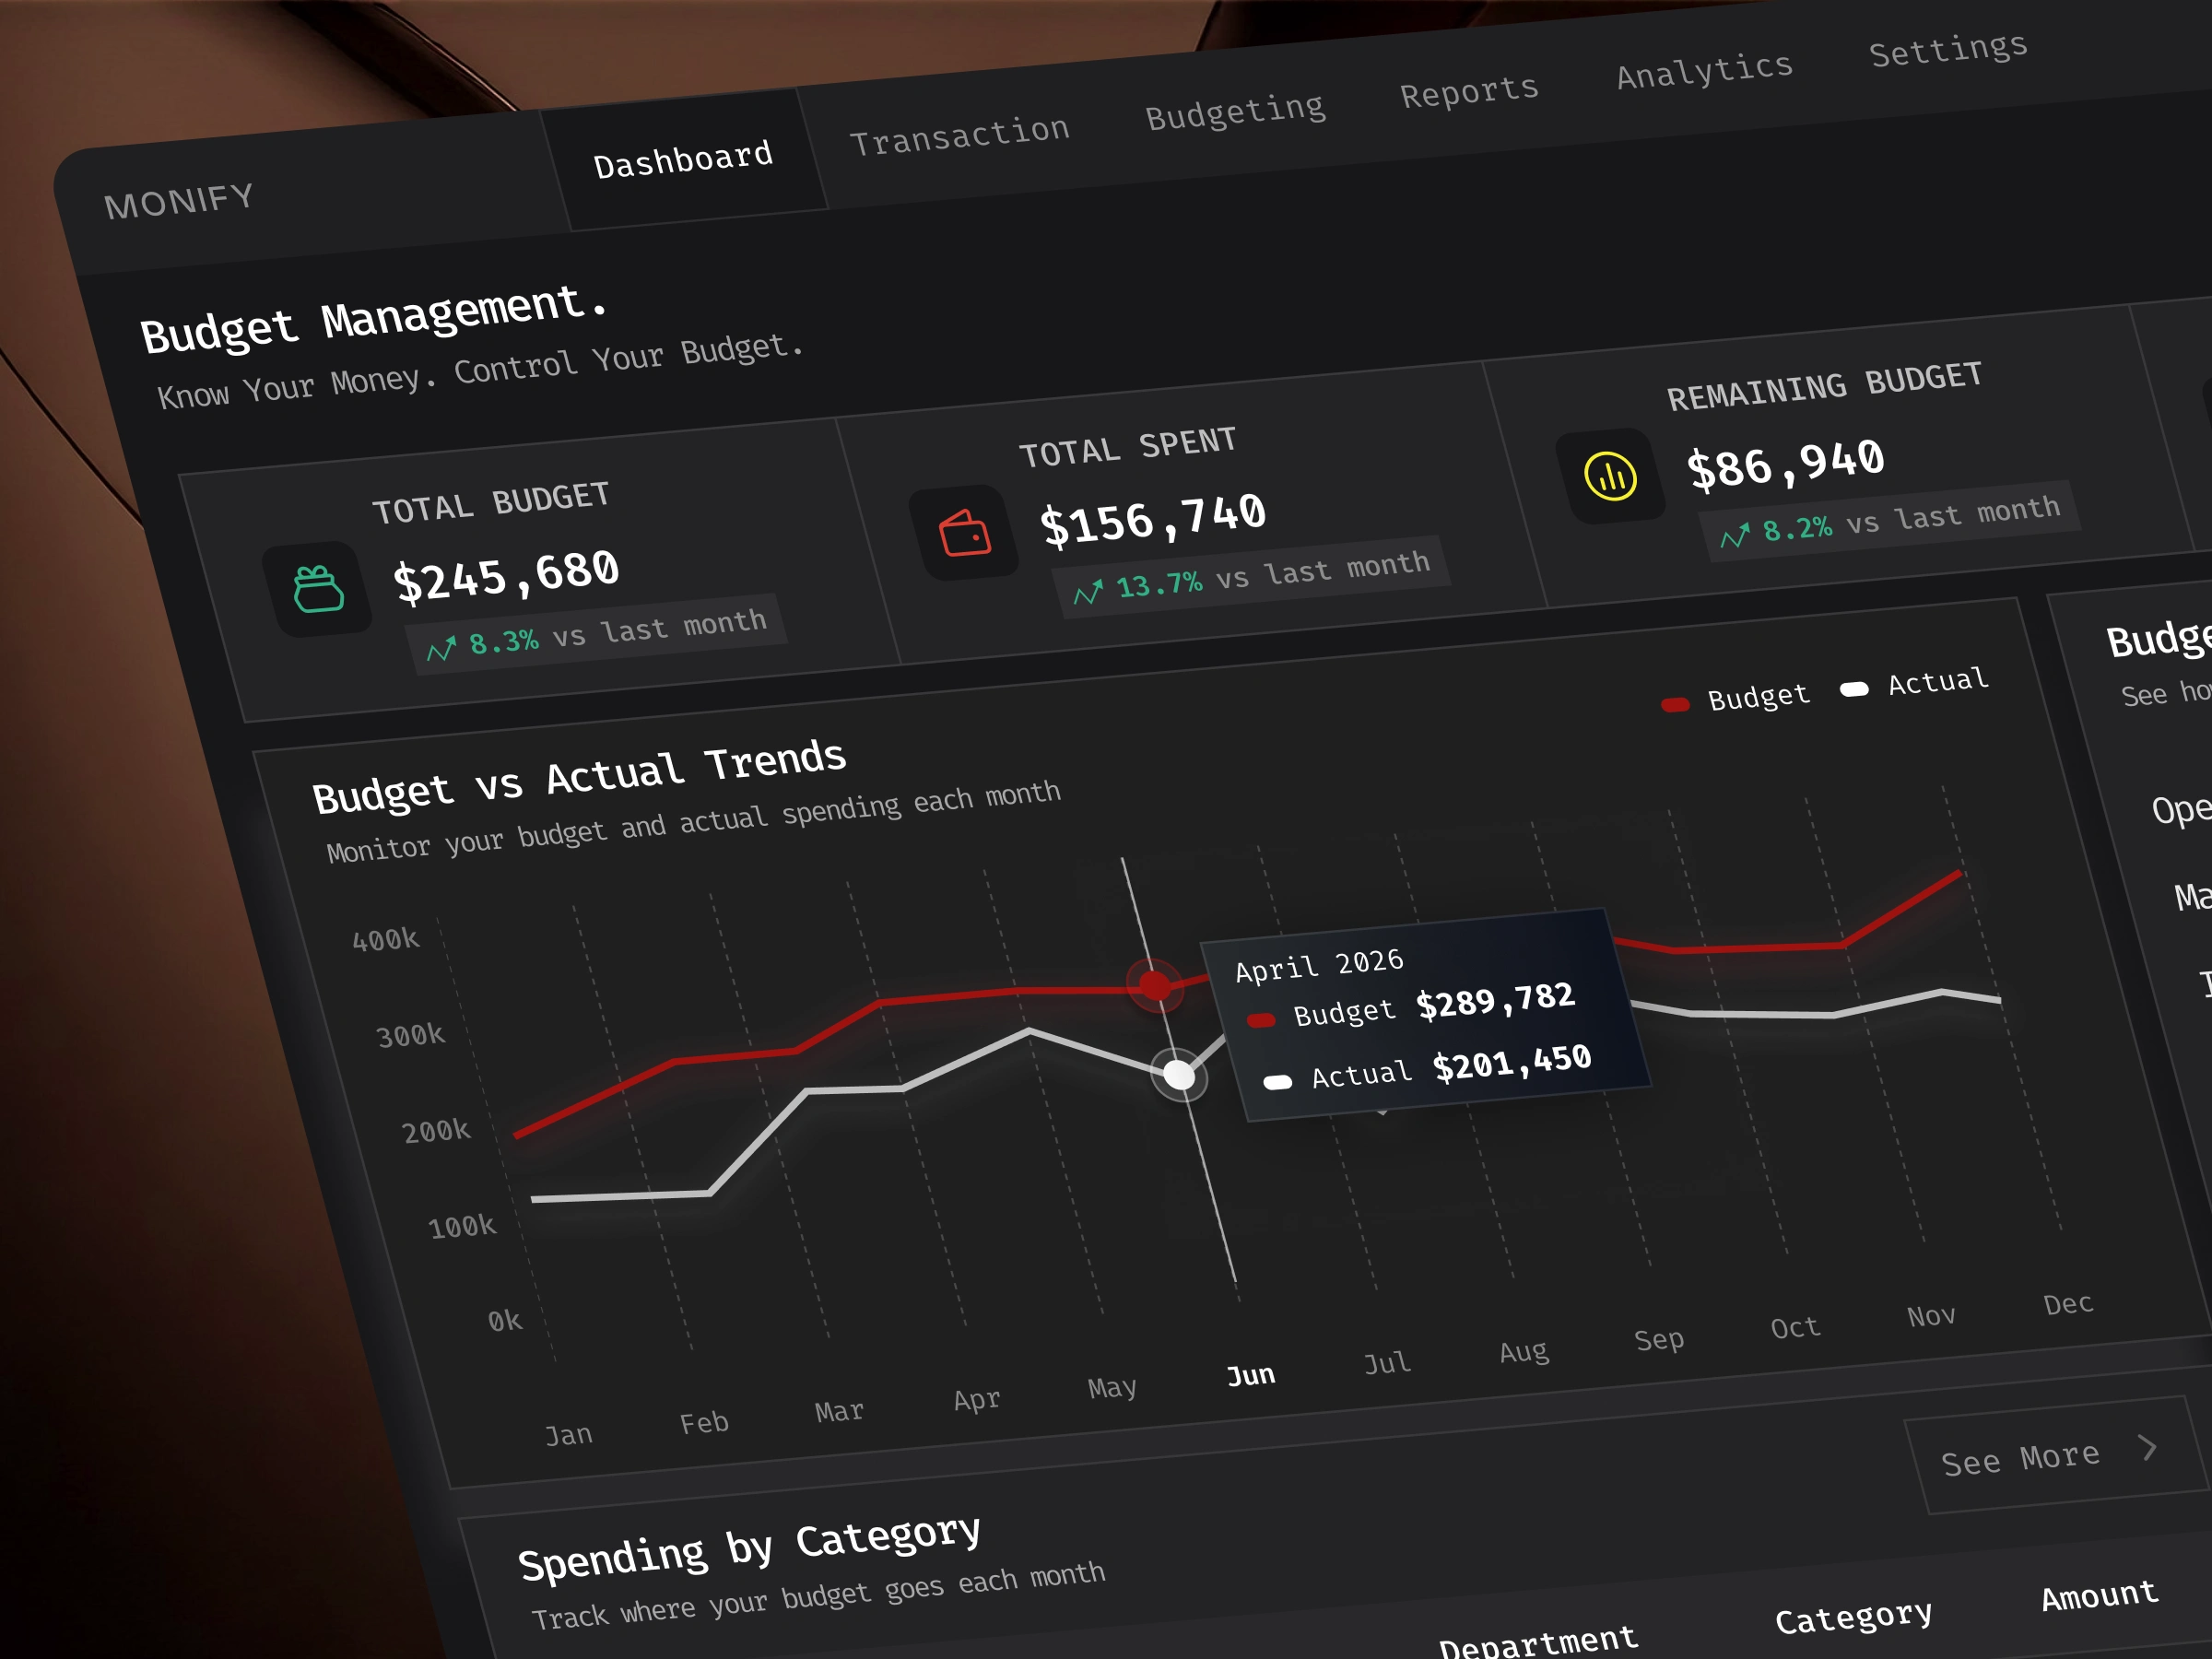
Our design approach focused on simplifying financial data through structured layouts, meaningful visual hierarchy, and easily recognizable dashboard components. We organized the interface around essential budget metrics, including total budget, total spending, remaining budget, budget utilization, and forecasted expenses. Interactive-style charts, department-level comparisons, and categorized spending summaries were incorporated to help users explore financial information and identify important trends without unnecessary complexity.
Key Features
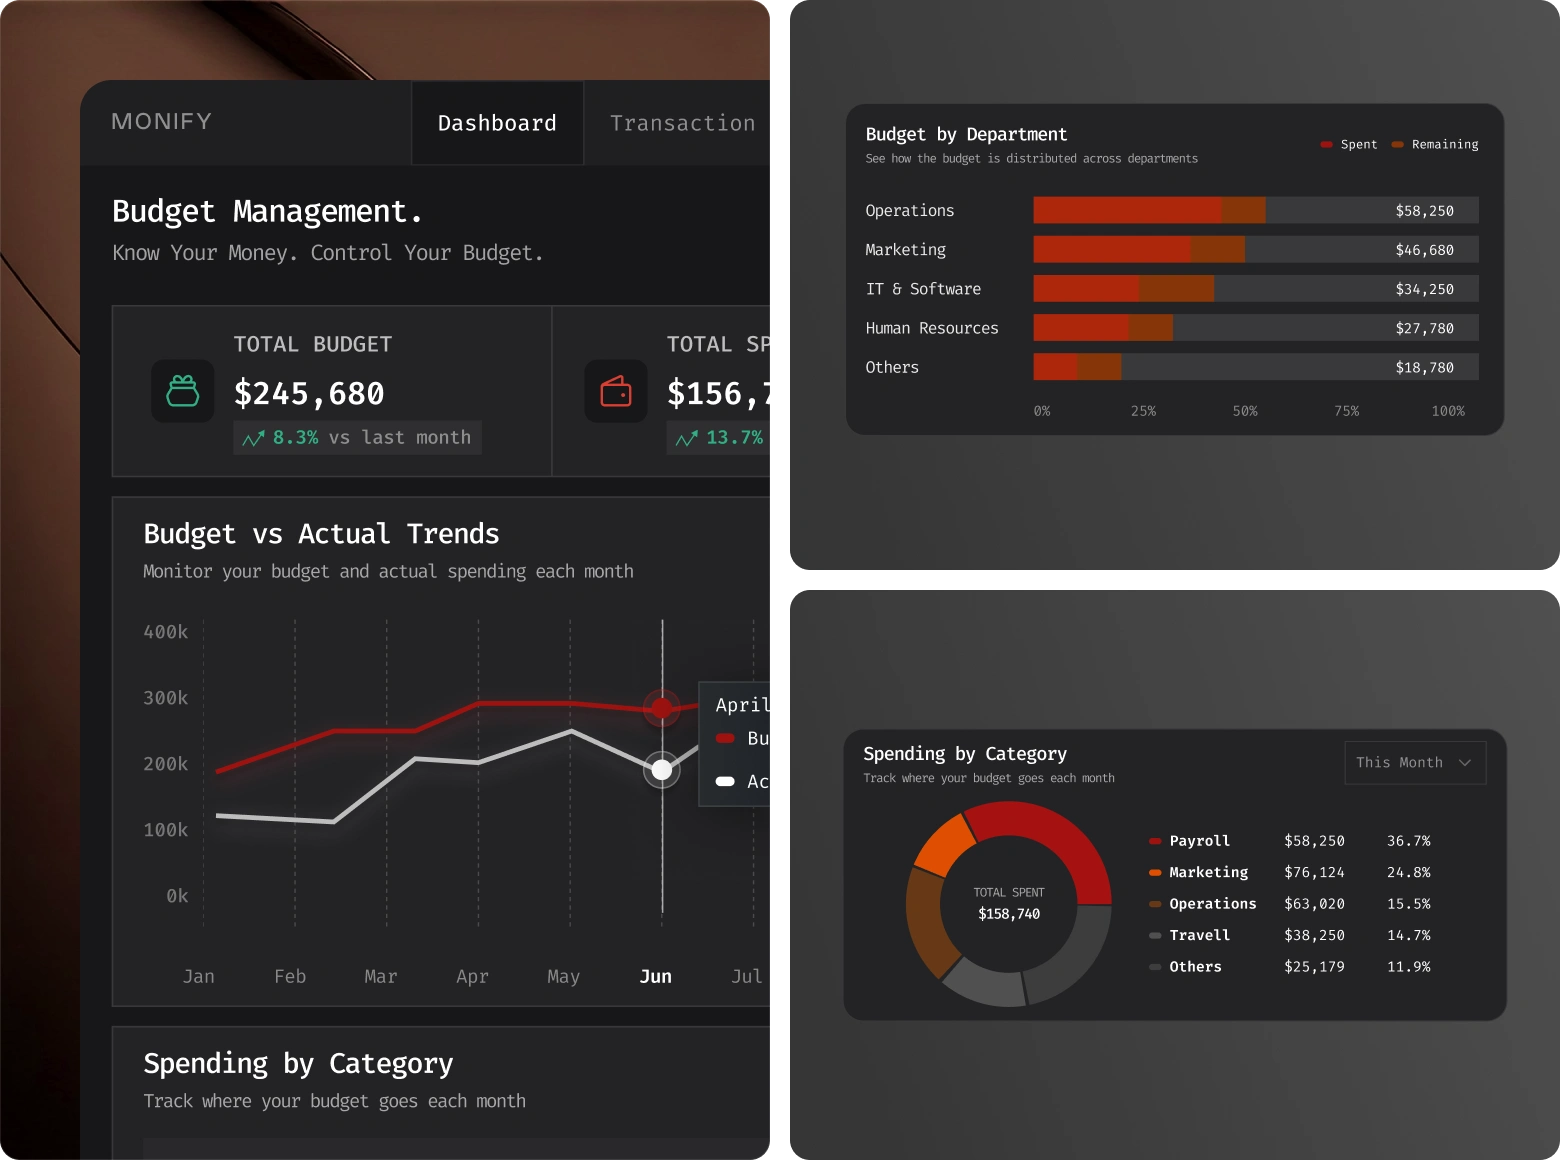
Monify brings essential financial management capabilities into a unified dashboard. The interface features a financial KPI overview, budget vs. actual spending comparison, department budget allocation, expense category breakdowns, spending history, and forecasted financial performance. Line charts, horizontal bar charts, donut charts, and detailed expense tables provide different perspectives on budget activity, helping users understand where resources are allocated and how spending compares with planned budgets.
User Experience
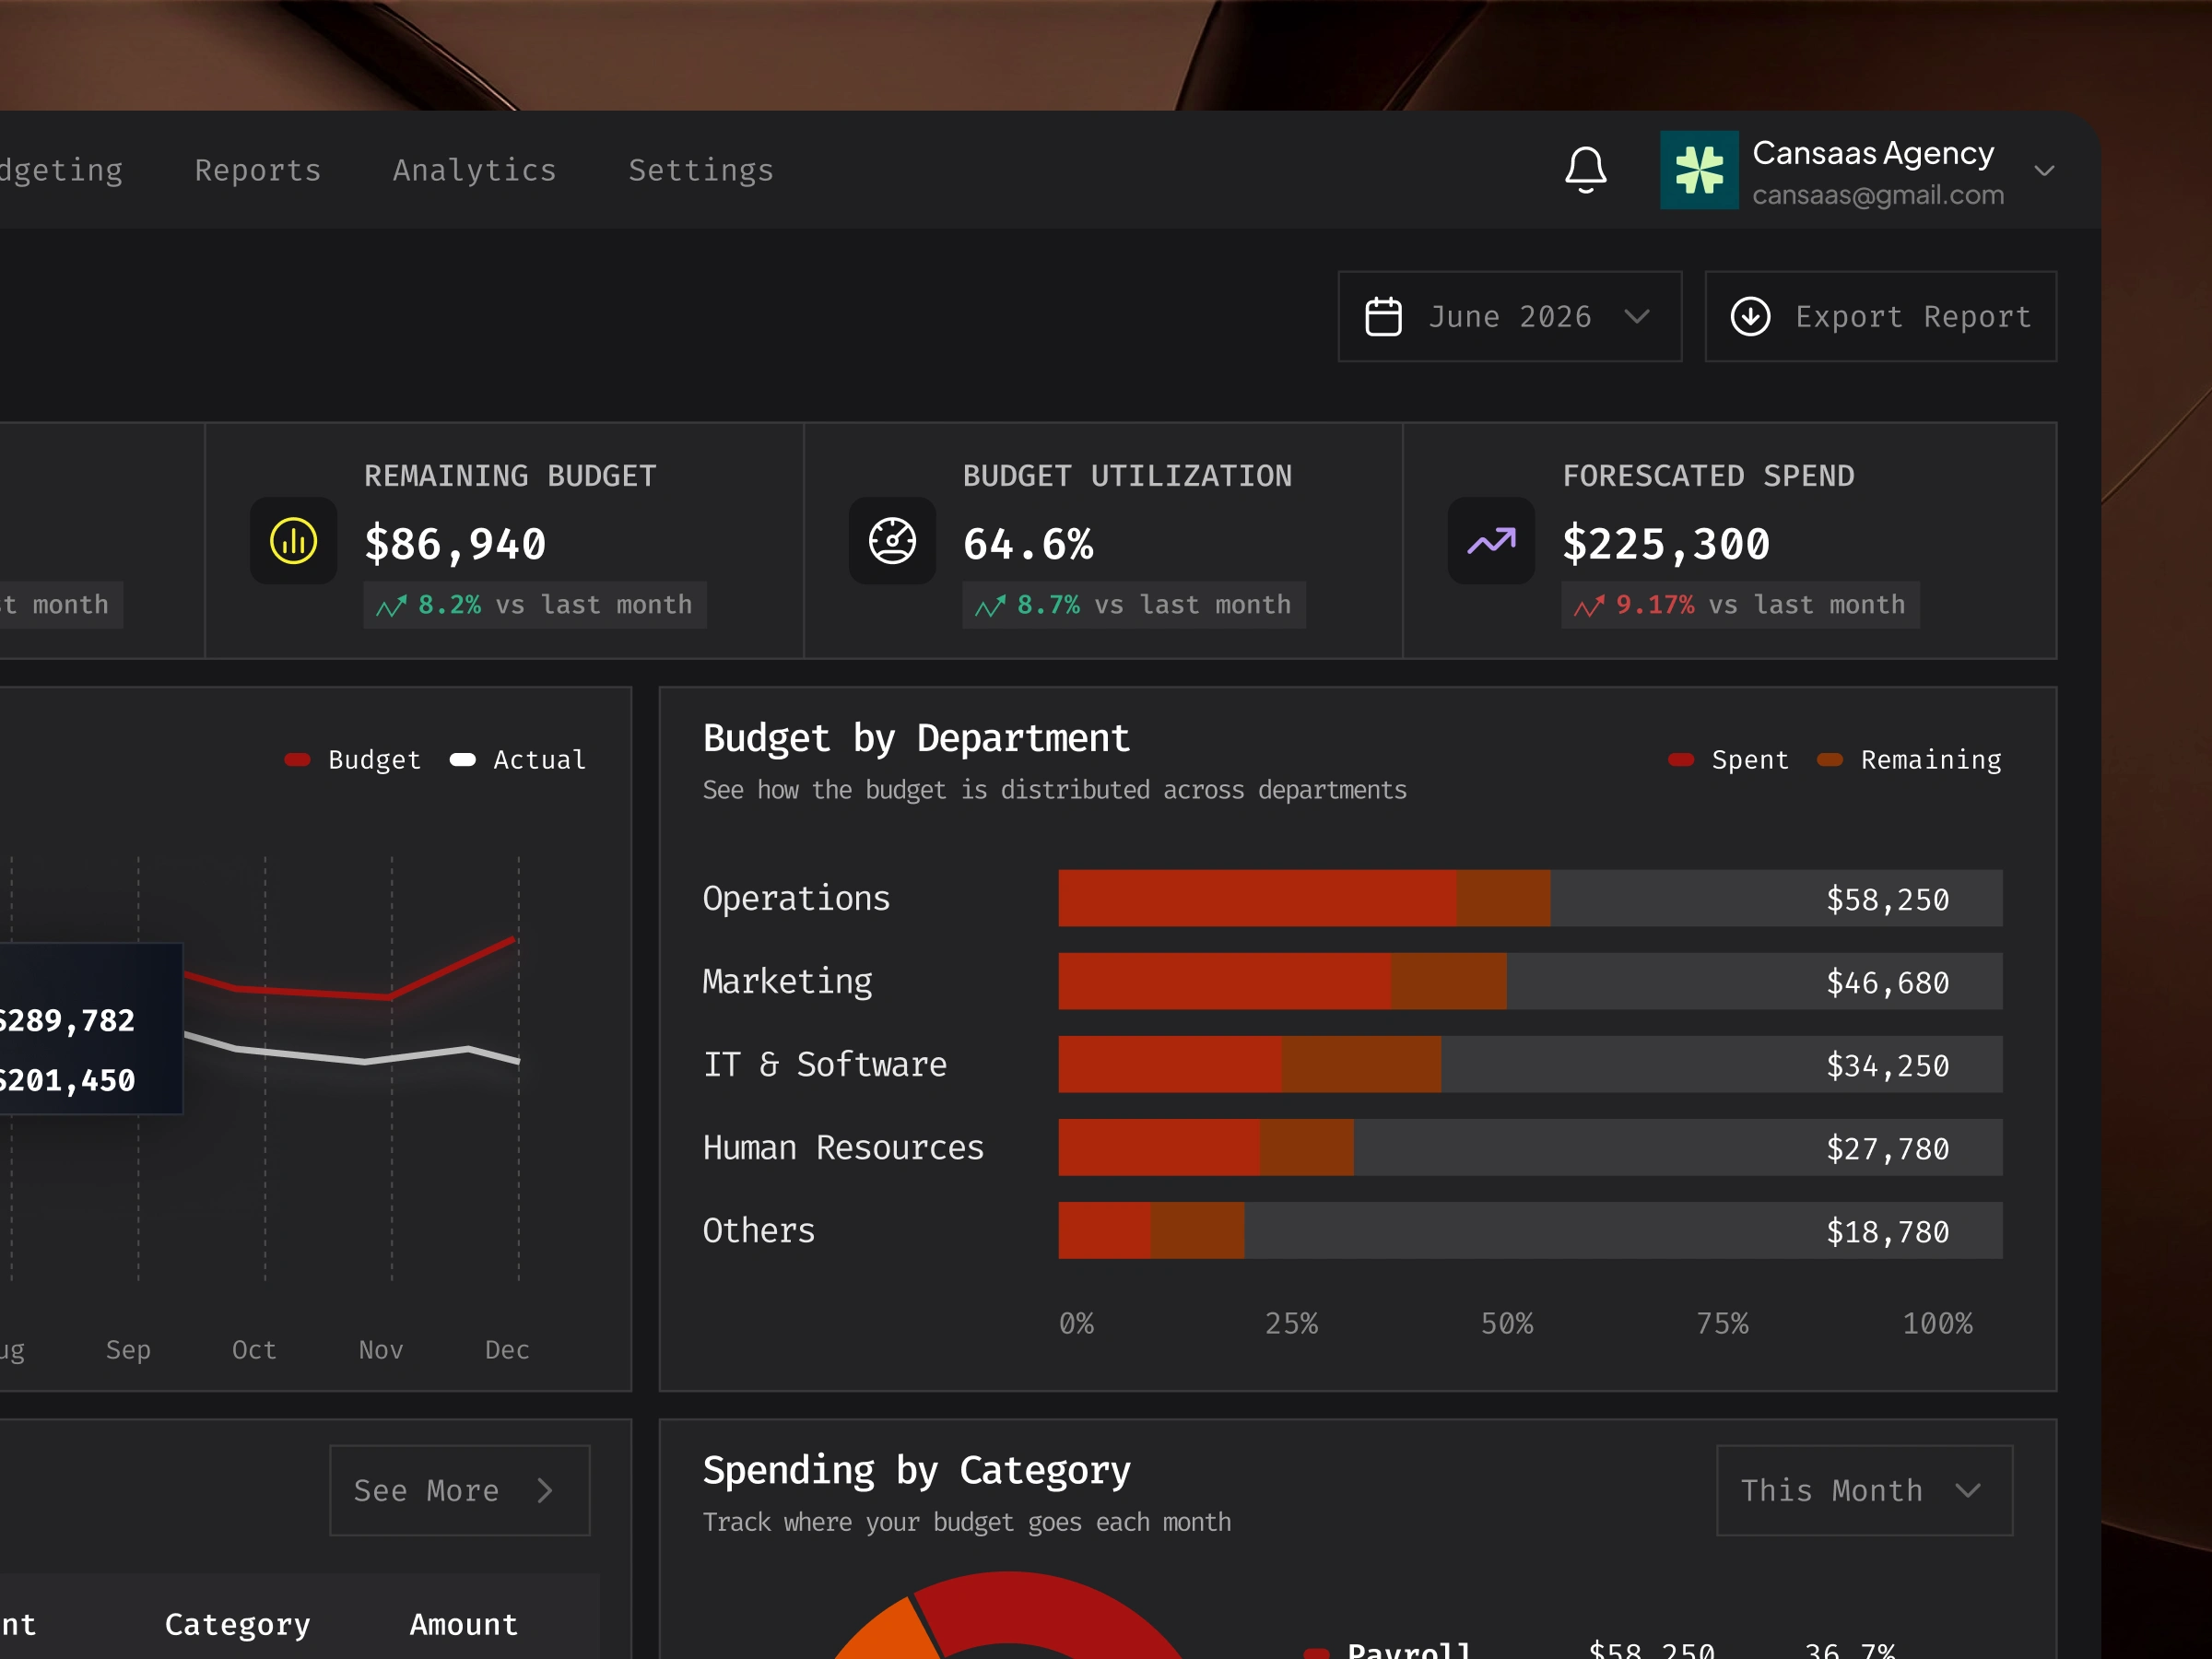
The user experience was designed around clarity, efficiency, and quick access to important financial insights. A straightforward navigation system organizes core functions such as transactions, budgeting, reports, and analytics. Prominent financial figures make key metrics easier to identify, while color-coded data visualizations support faster comparisons across spending categories and departments. Consistent component structures and clear content grouping make the dashboard easier to scan, navigate, and understand.
The Result
The result is a modern finance SaaS dashboard concept that brings budget tracking, expense management, and financial analytics into one cohesive digital experience. Monify demonstrates how thoughtful UI/UX design and effective data visualization can make complex financial information more approachable, organized, and actionable. By prioritizing clarity, consistency, and functional design, the interface presents a practical direction for business budgeting software and financial management platforms.
Like this project
Posted Oct 21, 2026
Designed a streamlined finance dashboard for budget and expense management.
Likes
0
Views
0
Clients
Monify