Here's how I designed a
Emmanuel Daniel
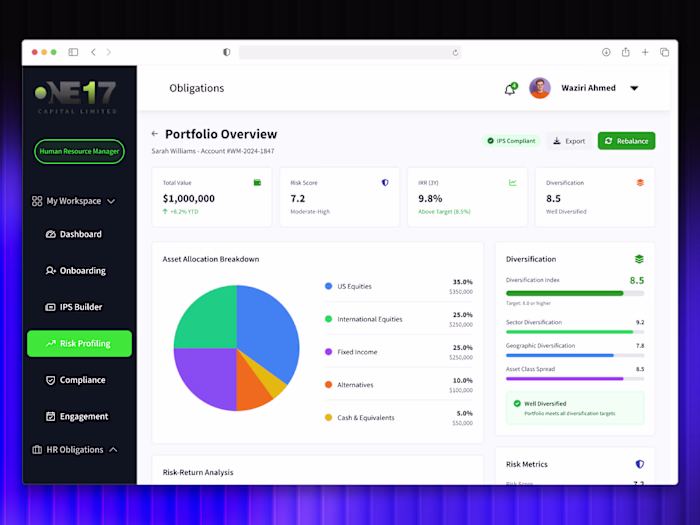
Here's how I designed a SaaS analytics dashboard that reduces churn and the decisions behind it.
KPI cards first. Total Users, Signups, Active Users, Churn Rate, MRR all above the fold. The founder should never have to scroll to know if the business is healthy.
Churn gets its own chart. Most dashboards bury churn in a settings page. I put "Users leaving this period" right next to the retention and engagement charts because churn context only makes sense next to growth data.
Revenue and subscription plan in one section. MRR trend + plan distribution side by side = one complete picture of revenue health.
Sidebar stays minimal. Dashboard, Analytics, Revenue, Users. That's it. No feature bloat. No 12-item mega menu.
The result: a founder can open this dashboard and make a decision in under 60 seconds.
I design SaaS dashboards for founders who want to reduce churn and improve retention. Open to new projects.
#UIDesign #UXDesign #ProductDesign #SaaSDesign #DashboardDesign #Figma #SaaS
Like this project
Posted Apr 19, 2026
Here's how I designed a SaaS analytics dashboard that reduces churn and the decisions behind it. KPI cards first. Total Users, Signups, Active Users, Churn ...
Likes
0
Views
0