Inspection Matrix: Enhancing Construction Inspection Workflows
Bailey White

Inspection Matrix: Bringing Clarity to Complex Inspection Workflows
4 min read
·
Aug 13, 2025
At Visibuild, I led product design for a high-impact feature addressing a critical pain point in large construction projects: managing and tracking thousands of inspection templates across multiple locations, trades, and handover stages. Working closely with PMs, engineers, QA managers, and client stakeholders, I drove this project end-to-end — from problem definition through to successful public release, balancing strategic vision with hands-on design execution.
The Challenge
Large constructions projects like AirTrunk involve hundreds to thousands of linked inspection templates (ITPs and ITCs). Existing tools fragmented visibility, forcing teams to juggle spreadsheets and multiple trackers just to piece together inspection progress. This led to:
Significant time lost manually reconciling inspection data
Missed or duplicated inspections risking costly rework and delays
Frustrated teams and anxious clients due to poor real-time visibility
As one coordinator at Richard Crookes put it:
“Currently, teams are tracking progress across thousands of spreadsheet lines, particularly during the fit-out phase, making it difficult to get a clear, consolidated picture.”
Mirvac echoed this frustration:
“Our teams are forced to use multiple single inspection trackers and external spreadsheets, which creates silos and confusion.”
Brady Group highlighted the risk of lost visibility when data doesn’t roll up correctly:
“Ultimate Air shows no completion at the level view, but data exists in sub-locations, teams simply can’t trust the status reports.”
These quotes reveal how manual reconciliation, fragmented tools, and poor data visibility combine to create workflow friction, delays, and risk in complex inspection programs.
Research & Insights
We ran a mixed-methods discovery process:
Quantitative baseline:
Only 5.34% of users exported inspection data weekly, ranging from single exports to over 10,000 rows at a time
Export sizes typically involved thousands of rows, requiring manual reconciliation taking anywhere between 1 to 4 hours per project
Qualitative findings:
Coordinators expressed a need for saved views to avoid rebuilding complex filters every session
Project managers needed quick, high-level grouping by status, trade, or location for accurate, timely reporting without deep dives
Competitive benchmark:
Tools like Procore offered filtering but lacked persistent saved views and flexible grouping, leaving a clear opportunity to differentiate
How might we…?
Constraints
Technical: Database query performance suffered when handling or filtering datasets exceeding 100,000 records, necessitating backend optimisation
Timeline: A Q3 release was essential to align with enterprise renewal cycles and support the sales pipeline
Adoption risk: Coordinators had deeply entrenched Excel-based workflows and needed demonstrable time savings to switch tools
Product scope: Saved views were a new feature concept for our team; to meet the release deadline, views were implemented as company-shared without user-specific permissions
Usage patterns: Only a small percentage of users exported data weekly, but with large export sizes and significant manual reconciliation time, underscoring the urgent need for improved in-product filtering and views
The Process
To address these challenges, I:
Conducted user interviews and surveys with coordinators, PMs, and QA managers to deeply understand workflows and pain points
Mapped user outcomes focused on noise reduction, early gap detection, and confident program-level reporting
Benchmarked competitor platforms for best practices in filtering, grouping, and saved views
Collaborated closely with engineering to surface and work around technical performance constraints
Ran iterative design workshops and usability testing sessions to validate concepts and refine interaction models
Used Google Sheets as a rapid prototyping tool to design and test matrix layouts and interactions quickly — since traditional design tools like Figma aren’t well suited for complex data tables and needed fast iteration
The solution
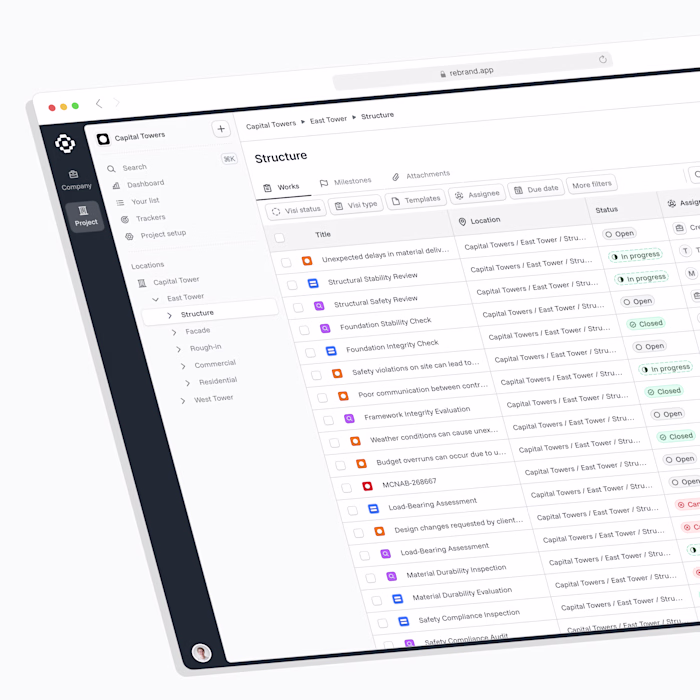
We designed the inspection matrix into a live, bird’s-eye view of inspection templates, featuring:
Robust, multi-dimensional filtering by location, trade, company, and template to cut through noise
Grouping and condensation tailored to roles , coordinators, PMs, QA managers, and clients, so each user sees what matters most
Clear visual status indicators for missing, due soon, overdue, or incomplete inspections
Direct links to detailed inspections, reducing the need for tool-switching
This transformed the matrix into a single source of truth, eliminating spreadsheet chaos and manual reconciliation.
Impact & metrics
Early beta testing with key clients showed:
A reduction in coordinators exporting and manually reconciling inspection data, supported by qualitative feedback that the new feature eliminated their need to export
Increased confidence from project managers in reporting program-level progress, reducing last-minute surprises at handover
Positive feedback on usability and clarity, with high adoption among large project teams
Users immediately recognised the value and ease of the new multi-template tracker:
“Looks good, easy way to see all the information.”
“Team likes the visual understanding of project status.”
This early love confirmed that the design met user needs and set a strong foundation for wider rollout.
Collaboration & learnings
Partnered cross-functionally with PMs, engineers, QA, and clients throughout the product lifecycle
Balanced technical constraints with user needs to deliver performant, intuitive UI at scale
Learned the critical importance of aligning views and interactions to user mental models and workflows
Realised simplifying complexity requires thoughtful information architecture and interaction design as much as visual polish
What’s next?
Continue iterating based on user feedback, focusing on saved views, notifications, and reporting features
Explore AI-driven insights to proactively highlight inspection risks and anomalies
Expand role-based customisation to empower all project roles with relevant, actionable data
Like this project
Posted Oct 3, 2025
Led product design for a feature improving inspection workflows in construction projects.