Sales & Profit Dashboard for FY 2024-25
Archit Thakur
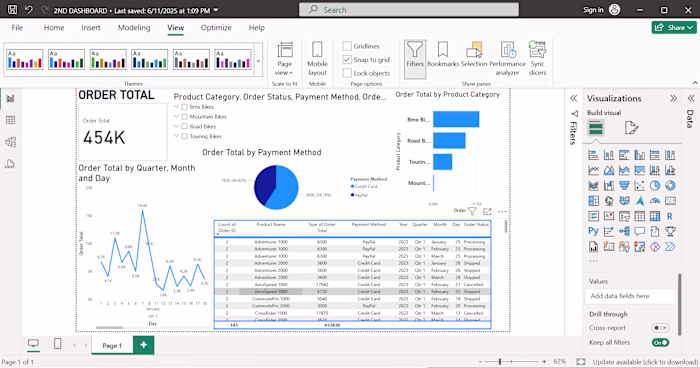
🚀 Just Finished Building My First Power BI Practice Dashboard!
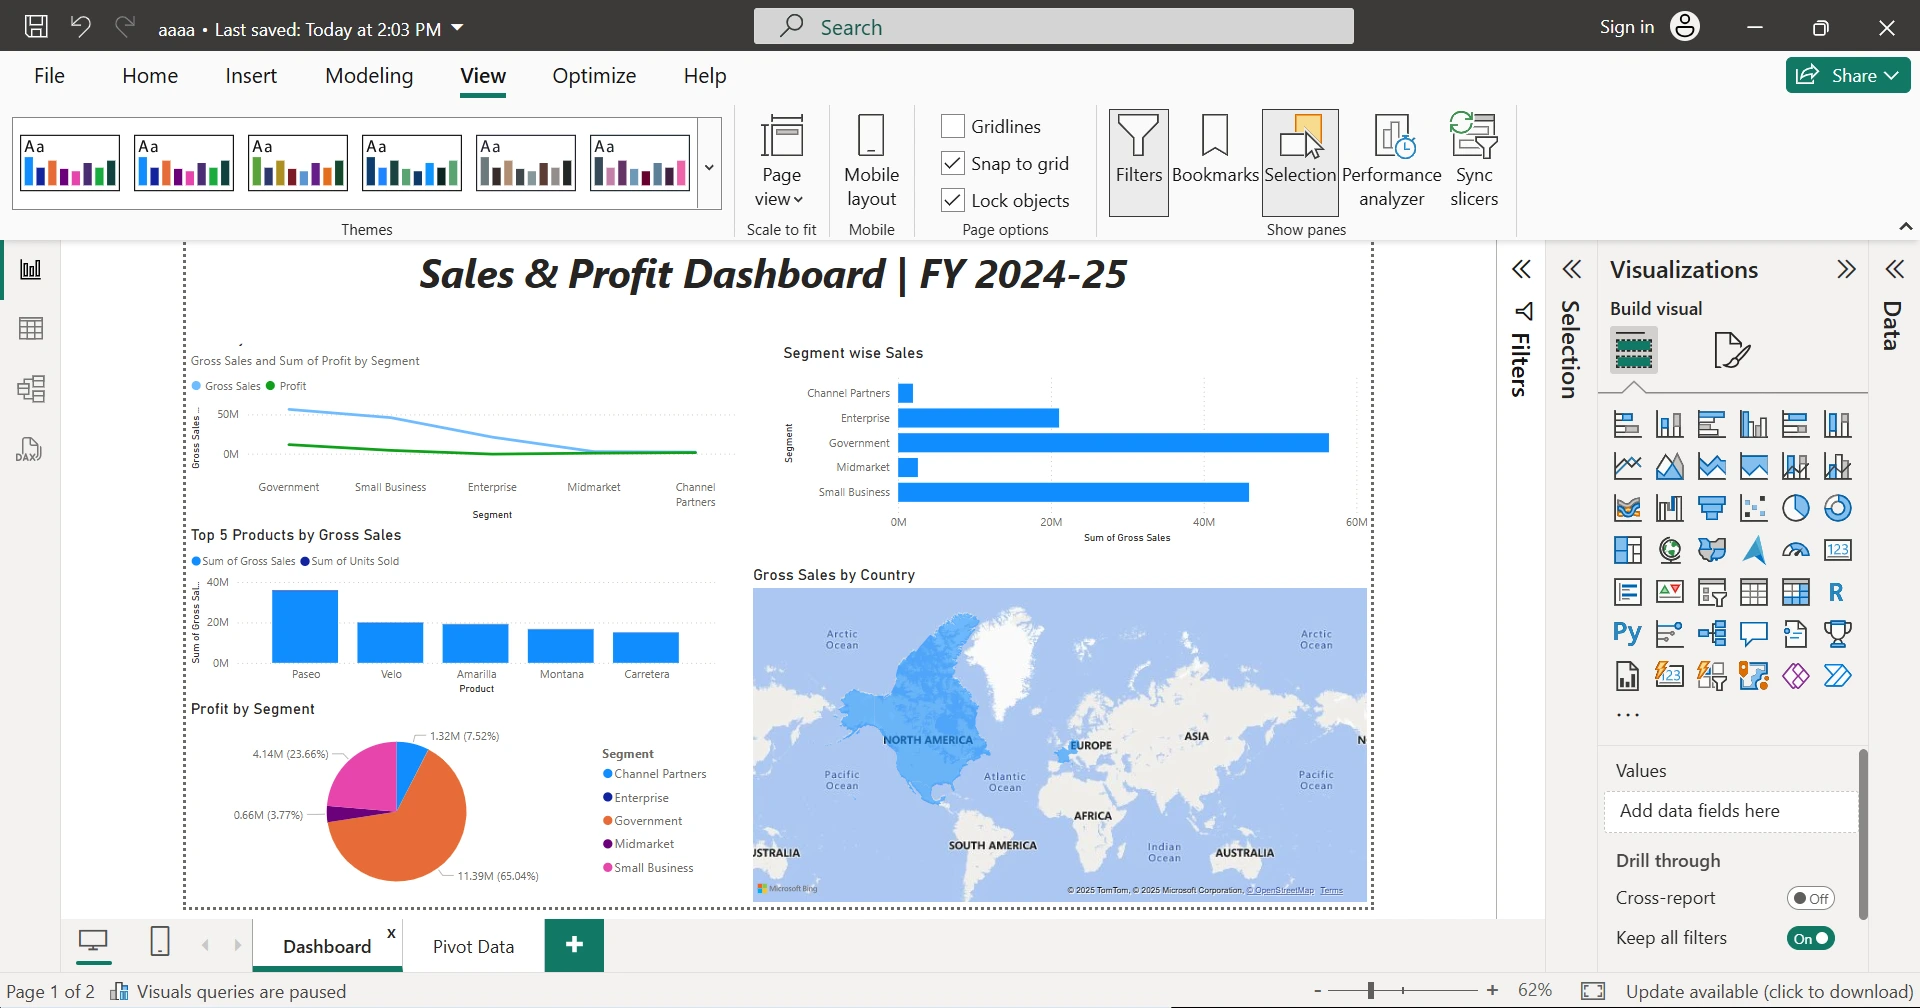
📊 Sales & Profit Dashboard | FY 2024-25
Thrilled to share this interactive dashboard that visualizes:
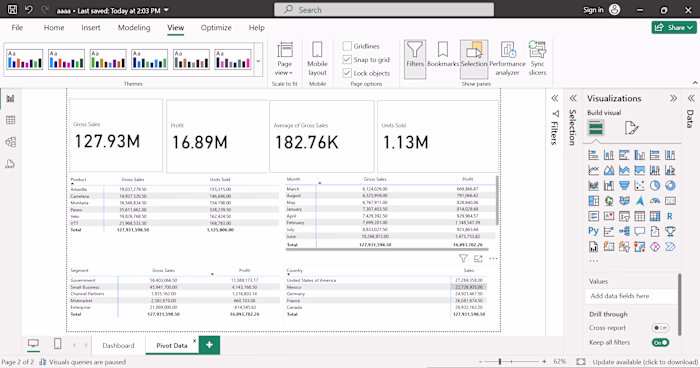
✅ Gross Sales & Profit trends
✅ Segment-wise and Country-wise performance
✅ Top-performing products
✅ Key KPIs with dynamic visuals & maps
As a Biotech student diving into data analytics, this project taught me the real impact of transforming raw data into meaningful insights.
💡 Tools Used: Power BI | Excel
🧠 Skills Applied: Data Modeling | Dashboard Design
Would love to hear your thoughts & suggestions!
hashtag#PowerBI hashtag#DashboardDesign hashtag#DataAnalytics hashtag#BiotechToBusiness hashtag#LearningByDoing hashtag#DataVisualization hashtag#StudentProject
Like this project
Posted Jun 21, 2025
Built an interactive Power BI dashboard for sales and profit analysis.
Likes
0
Views
0