Order Analytics Dashboard with Power BI
Archit Thakur
🚀 Just Completed My Second Power BI Dashboard!
📊 Order Analytics Dashboard
As a student exploring data visualization, I recently built this dashboard to analyze product orders by category, payment method, and time. Key insights include:
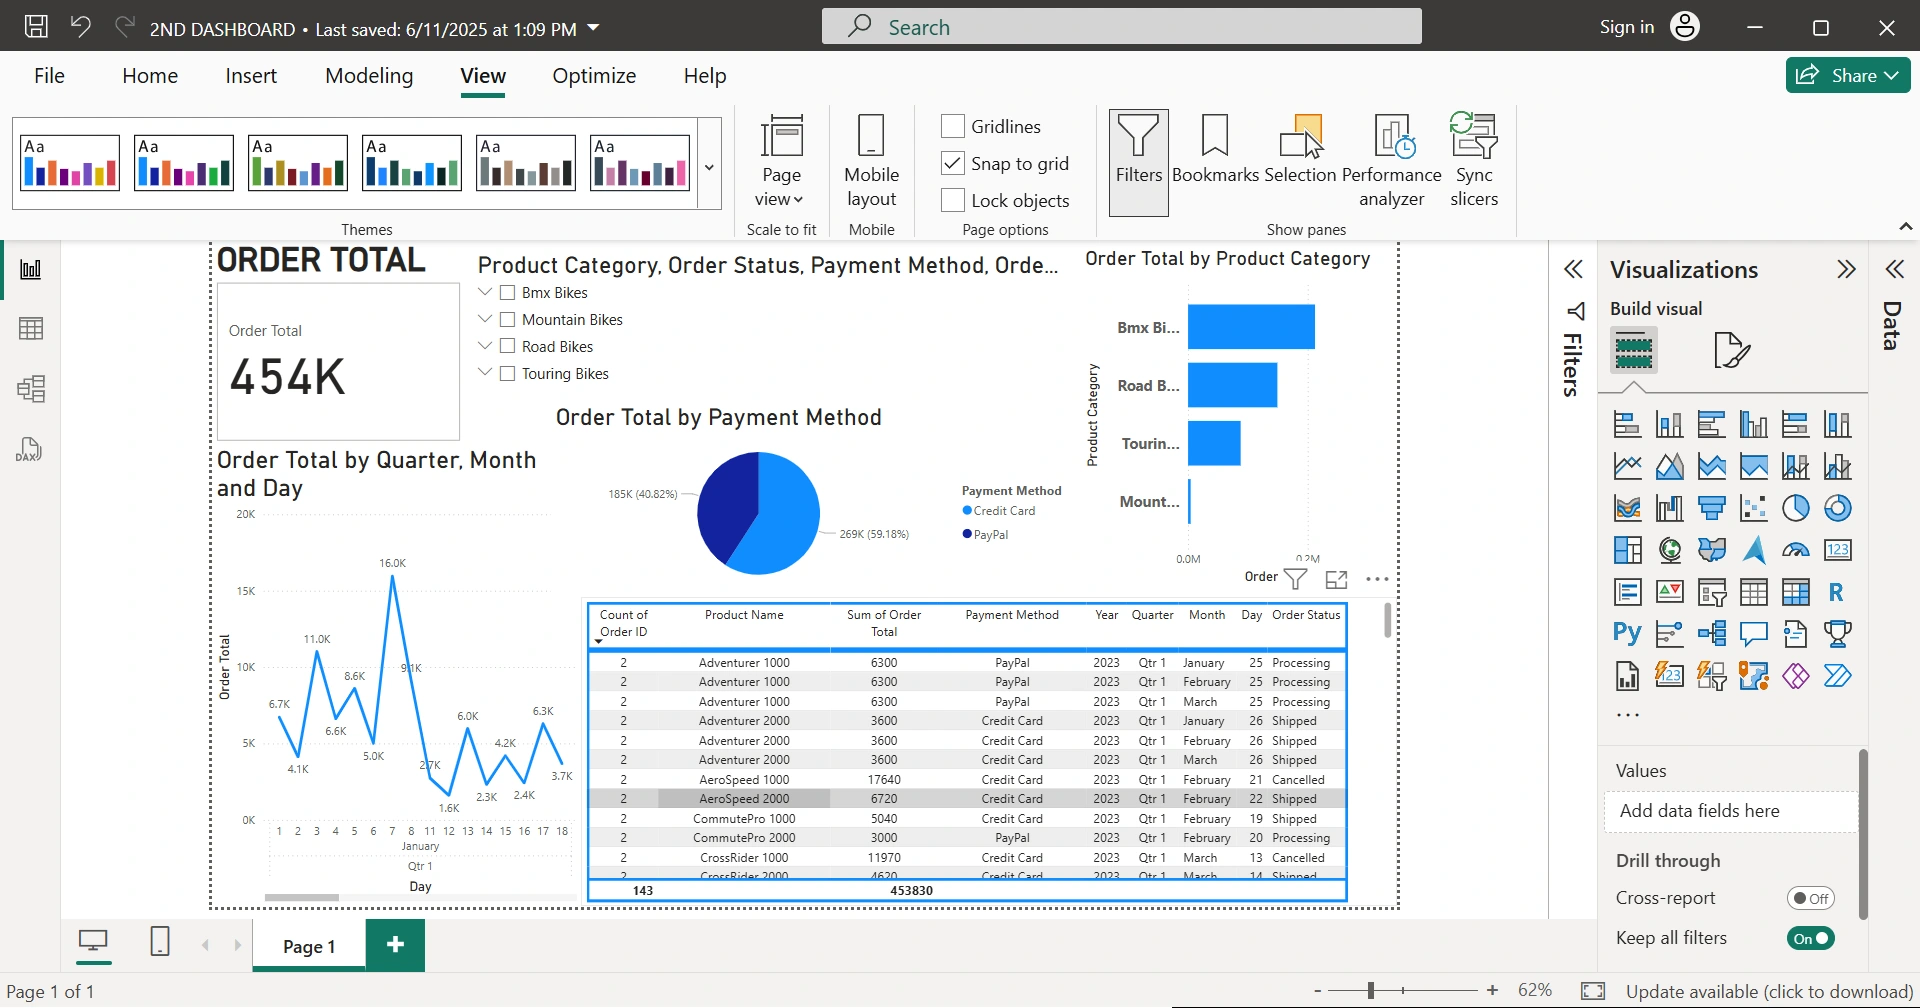
✅ Total Orders: 454K
📅 Breakdown by Quarter, Month & Day
💳 Payment Insights (PayPal vs. Credit Card)
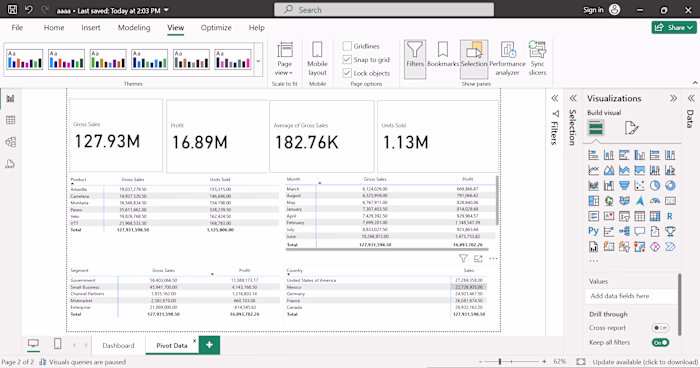
🚲 Product Categories: BMX, Road Bikes, Mountain, Touring
📦 Order Status: Shipped, Processing, Cancelled
🔍 Visual tools used:
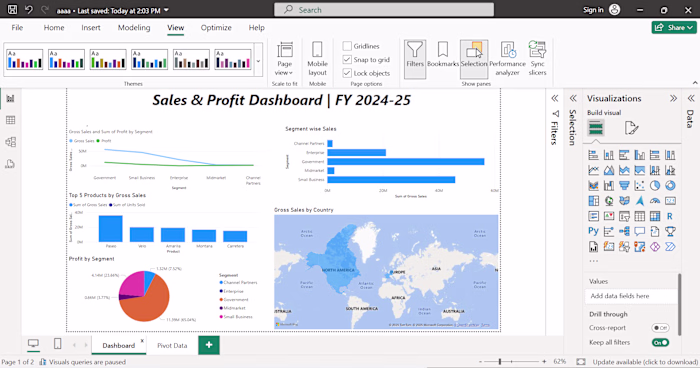
Line Chart
Pie Chart
Bar Graph
Interactive Table
This hands-on practice helped me understand how to turn raw data into meaningful visuals for better business decisions.
#PowerBI #DataAnalytics #StudentProject #DashboardDesign #ExcelToPowerBI #DataVisualization #LearningByDoing #BIJourney
Like this project
Posted Jun 21, 2025
Created a Power BI dashboard for order analytics as a student project.
Likes
0
Views
0